COMMUNICATION, INFORMATION AND RESPONSIBILITY DISTRIBUTION STRATEGIES FOR EFFECTIVE REAL-TIME TRANSIT SERVICE MANAGEMENT
by
David P. Barker
B.A., Vassar College (1998)
SUBMITTED TO THE DEPARTMENT OF CIVIL AND
ENVIRONMENTAL ENGINEERING IN PARTIAL FULFILLMENT
OF THE REQUIREMENTS FOR THE DEGREE OF MASTER OF SCIENCE IN TRANSPORTATION
at the
MASSACHUSETTS INSTITUTE OF TECHNOLOGY June, 2002
Copyright © Massachusetts Institute of Technology 2002. All rights reserved.
Signature of Author
Certified by
Certified by
Accepted by
Department of Civil and Environmental Engineering May 24, 2002
d Professor Nigel H. M. Wilson
/1 -. Ihs pervisor
Senior Rseach Associate Carl Martland Research Supervisor
'am.m
Oral Buyukozturk Chairman, Departmental Committee on Graduate Students
MASSACHUSETTS INSTITUTE OF TECHNOLOGY
M IT
Libraries
Document Services Room 14-0551 77 Massachusetts Avenue Cambridge, MA 02139 Ph: 617.253.2800 Email: docs@mit.edu http://Iibraries.mit.edu/docsDISCLAIM ER
MISSING PAGE(S)Page 166 / Table A-1 is missing from the Archives copy. This is the most complete version available.
COMMUNICATION, INFORMATION AND RESPONSIBILITY DISTRIBUTION STRATEGIES FOR EFFECTIVE REAL-TIME TRANSIT SERVICE MANAGEMENT
by
David P. Barker
Submitted to the Department of Civil and Environmental Engineering on May 24, 2002 in partial fulfillment of the requirements for the degree of
Master of Science in Transportation
Resolving disruptions is a continual challenge to providing quality, cost-effective transit service. While a number of recovery techniques exist to recover from disruptions, detecting a disruption, choosing a response and implementing it in a timely manner is a difficult task. Different agencies use different combinations of field supervision, centralized control, and traditional and advanced communication technology. While these different service management strategies have different results, there is no consensus on what makes a good strategy, nor a systematic method for evaluating a proposed strategy and predicting its strengths and weaknesses. The purpose of this thesis is to create a framework for studying bus service management strategies and draw general lessons from an application of that framework.
This thesis categorizes 15 distinct disruptions in bus service, the most common responses to each, and the information and resources necessary both to reach a decision on the most appropriate response and to implement it. It introduces a spreadsheet model for starting with the number of disruptions an agency faces and its chain of command for dealing with them and calculating the number of conversations that take place and the demand those conversations put on
communications channels. Values gathered from studying Chicago Transit Authority (CTA) supervisor radio recordings allow this model to show the unused capacity of communications channels, if any, so that the feasibility of a prospective strategy can be determined.
This method of studying strategy is applied to CTA. It is found that CTA bus operations suffer from two bottlenecks. The control center relays delay reports too slowly for them to be useful, and the communications channels allotted to supervisors are less than they would be required to air all messages related to service restoration. As a result, street supervisors have few service restoration options available to respond to delays, and they lack the information needed to choose an option effectively. The net result is that minor delays typically go unaddressed until they deteriorate into major ones, and major delays impose greater cost on passengers than they should. The impact of adding handheld computers with real-time location information is studied, and it is found that this would let supervisors use a wider range of restoration techniques, allow them to choose the best technique more accurately, let them address minor delays before they become more serious and free the supervisory radio channels for more effective management of breakdowns, accidents and disturbances.
It is concluded that there are inherent advantages in managing schedule adherence from the field and managing incidents from a control center, regardless of an agency's level of communication investment. It is further concluded that digital messaging has a natural strength in dealing with routine and well-understood instructions, while voice communication is essential for tasks that are less predictable or require collaboration. Digital messaging can play a substantial role in a
good service management strategy but can never replace voice radio.
Acknowledgements
First of all, thank you to Nigel Wilson and Carl Martland, for guiding my hand, for pushing me to do more, and for not giving up on me when any sane man would. At CTA, thank you first of all to Darryl Lampkins, for welcoming me during my internship and being so supportive of my work. Thank you to George Neal and Tom Pleuger, who answered every question I could think of and just as many that I couldn't, and who between them know all that is knowable about the bus side of the control center. Thank you also to Daniel Shurz, who knows everything else about CTA, for answering my questions. Thank you to all the dispatchers that I spoke to, including Raheem, Minnie, Brooks, Hodges, George and Chris, each of whom withstood literally hours of questioning. And thank you to the CTA itself for making this research possible.
Thanks also go to everyone at the MBTA who helped me, including Marion Driscoll, Maureen Trainor and Janice Murphy who were kind enough to answer so many
questions, and Bill MacArthur who did that while letting me watch him juggle half the T's breakdowns and emergencies. Thanks also to Dave Carney for taking the time to study my conception of delays and responses and for providing such encouraging feedback.
Thanks to Mike Gil in Denver for telling me so much about their dispatching system. Thanks to Scott Wilder of the Brookline Police Department for graciously allowing me to use their dispatching recording and playback system, coming to my rescue when I needed it most. Thanks for Lawrence Wilson for filling me in on some CTA history all had forgotten. Thanks to Mark Schofield and Cindy Barnhardt for helping me move to a more productive work environment with free donuts.
Thanks to Ken Krukemeyer and Fred Salvucci, for providing such a wonderful research program so filled with opportunity and flexibility. Thanks to Ginny Siggia, for putting out more fires than I can count.
Thanks to Angela Moore, for contributing in more ways than can be consolidated here.
A full summary of the ideas, information, perspective and support she provided would
require not just its own page but an entire acknowledgements chapter to cover in full. Finally, thanks to my mom and dad for getting me here, and to Shaula for getting me through this.
Table of Contents
Abstract ... 3
A cknow ledgem ents ... 5
List of Figures ... 10
List of Tables... 11
1. Introduction ... 13
1.1 Disruptions and Recovery: The Context of This Research ... 13
1.2 M otivation... 15
1.3 Purpose of this thesis ... 16
1.4 M ethod... 17
1.5 Structure of this docum ent ... 18
2. Literature review ... 20
2.1 Context: Theory and Practice of Bus Service Management... 20
2.2 Som e Basic Approaches to Service M anagem ent ... 23
2.3 Techniques for Studying Service Management Strategies ... 27
2.4 Communication's Limits: The Burlington-Northern Study ... 30
2.5 Sum m ary... 31
3. An Overview of Communications Channel Types ... 33
3.1 Open M ic Radio Channels ... 33
3.2 Digitally M anaged / Trunked Radio Channels... 34
3.3 Digital M essaging ... 36
3.4 Direct Contact... 38
3.5 Cellular Phones ... 39
3.6 Conventional Phones and Payphones... 40
3.7 Silent Alarm s ... 41
4. Situations and R esponses ... 45
4.1 C om m on Service D isruptions ... 45
4.1.1 Bus early ... 46
4.1.2 Bus delay (short headway route) ... 47
4.1.3 Bus delay (long headway route)... 47
4.1.4 Crush load (one bus, not delayed)... 47
4.1.5 M echanical problem (m inor -bus movable)...48
4.1.6 Mechanical problem (serious -bus movable without passengers) ... 48
4.1.7 M echanical problem (m ajor -bus immobilized) ... 48
4.1.8 Em ergency / Security / Fare Dispute... 49
4.1.9 Accident...49
4.1.10 Operator M isses Relief ... 49
4.1.11 Blockage ... 50
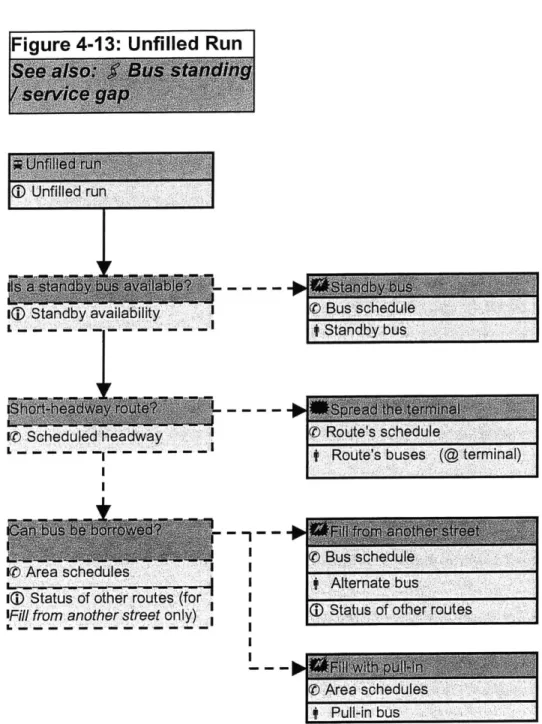
4.1.12 Bus Standing / Service Gap ... 50
4.1.13 Unfilled Run...50
4.1.14 Unplanned Bus Bridge... 51
4.1.15 Congestion / W eather / Route-wide Crowding... 51
4.1.16 Late Pull-Out ... 52
4.2 Recovery Techniques... 52
4.2.1 M anaging Headways and Schedules (H) ... 55
4.2.2 Solving M echanical Problems (M )... 59
4.2.3 M anaging Reliefs (R)... 60
4.2.4 Providing Additional or Altered Services (A) ... 62
4.2.5 Dealing with Emergencies (E)... 63
4.3 Information Needs in Disruption Management... 64
4.3.1 Chart Form at ... 64
4.3.2 Bus Early ... 67
4.3.3 Bus Delay (Short Headway Route)... 70
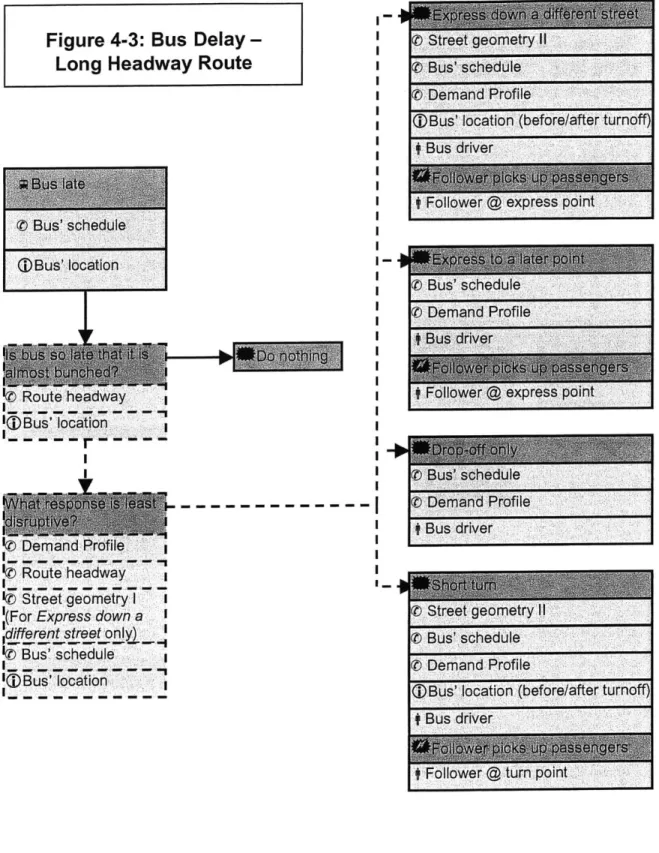
4.3.4 Bus Delay (Long Headway Route) ... 72
4.3.5 Crush Load (One Bus, Not Delayed) ... 72
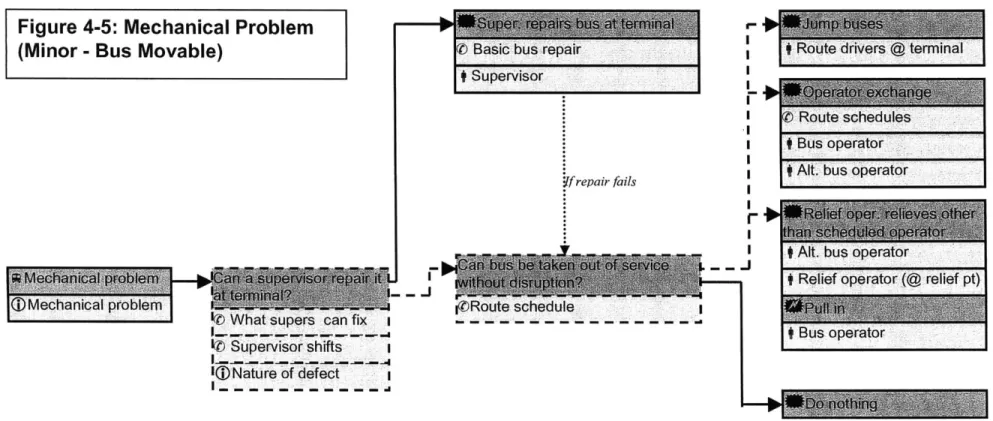
4.3.6 M echanical Problem (M inor - Bus M ovable)...75
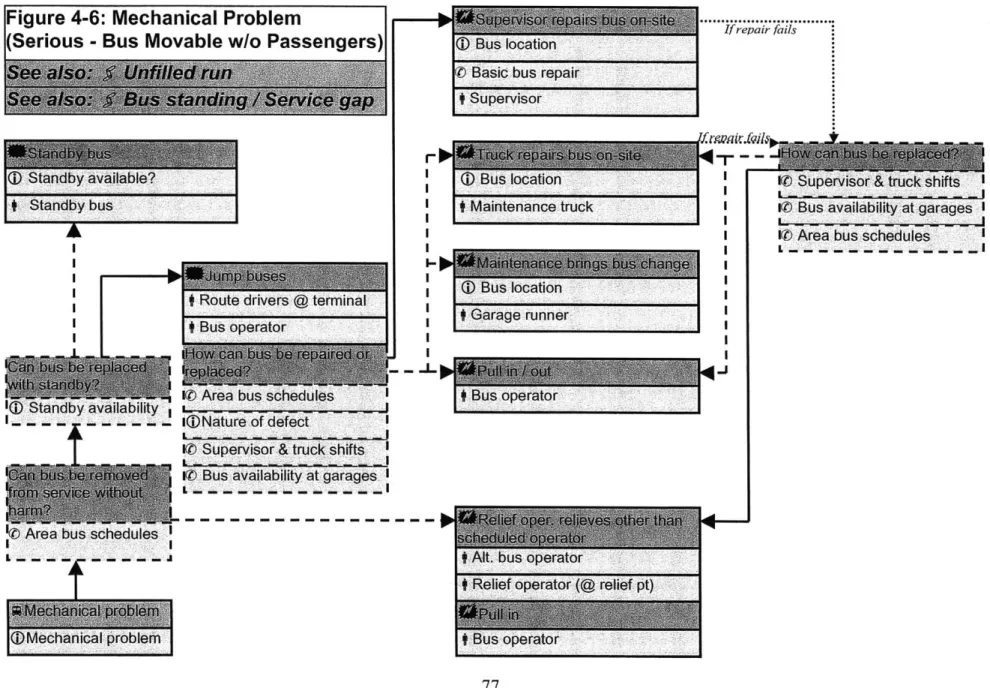
4.3.7 Mechanical Problem (Serious - Bus Movable without Passengers)...75
4.3.8 M echanical Problem (M ajor - Bus Immobilized)...78
4.3.9 Em ergency / Security / Fare Dispute... 78
4.3.10 Accident...81
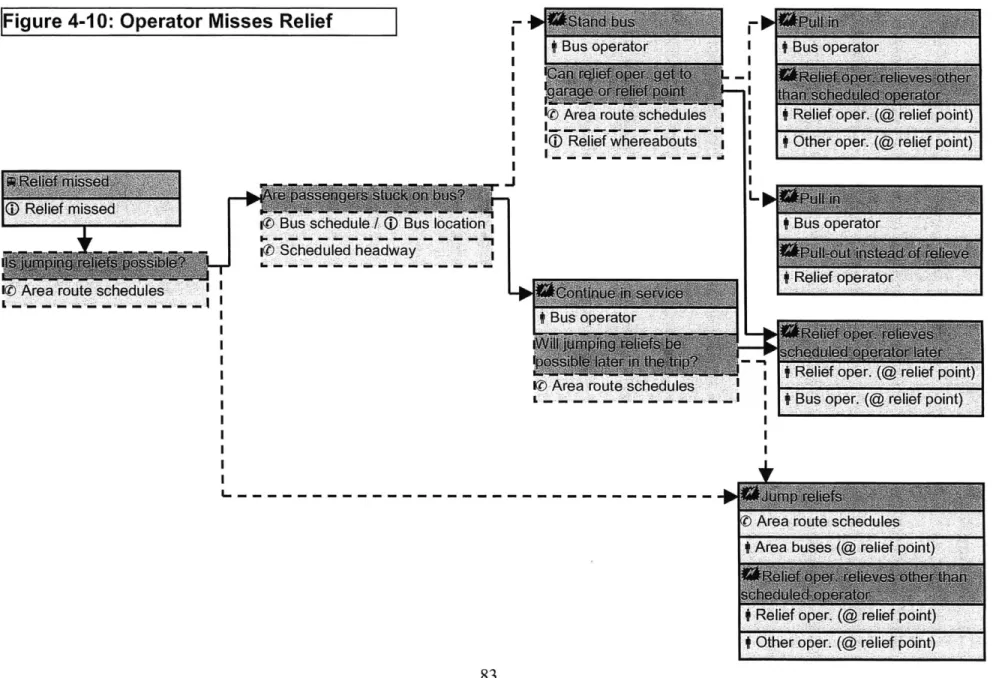
4.3.11 Operator M isses Relief ... 81
4.3.12 Blockage ... 84
4.3.13 Bus Standing / Service Gap ... 84
4.3.14 Unfilled Run...87
4.3.15 Unplanned Bus Bridge... 87
4.3.16 Congestion / W eather / Route-wide Crowding... 90
4.3.17 Late Pull-Out ... 90
5. Introducing the M odel... 101
5.1 Assumptions ... 101
5.2 Analysis Approach... 102
5.2.1 Situations, Decisions, and Actions: Structure and Volume...102
5.2.2 Actors and Tasks: Responsibility and Assignment ... 103
5.2.3 Information and Knowledge: Known, Requirements and Transmission...104
5.2.4 Strain on Channels: Individual and Total Costs ... 105
5.3 M odel Definition... 106
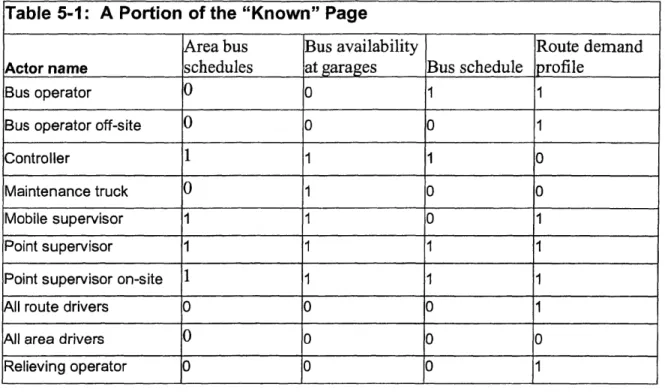
5.3.1 Known: What Actors Already Know ... 106
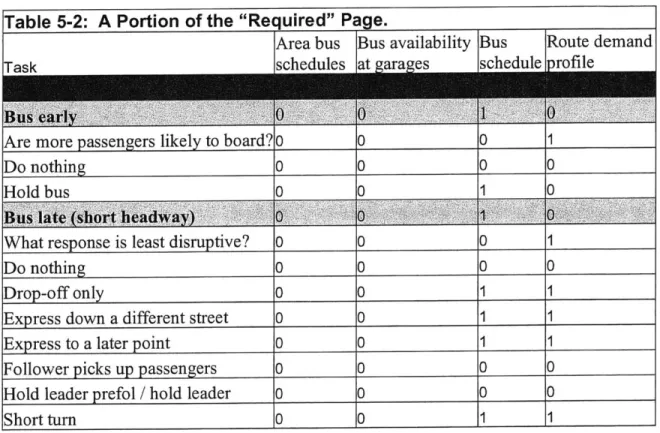
5.3.2 Required: The Facts Required for Each Action...107
5.3.3 Conversations: The Conversations that Stem from Each Situation ... 108
5.3.4 Strain: The Bandwidth Taken by Each Tranmission of a Fact ... 114
5.3.5 Results: The Total Strain on Each Channel ... 115
6. Application of the Communications Model to the Chicago Transit Authority... 121
6.1 Data Sources ... 121
6.1.1 Communications Bandwidth Usage: Voice Recordings ... 121
6.1.2 Event Volume: The BECS Database...122
6.1.3 Communications and Decision-Making Procedures: Observations, Interviews an d In feren ce ... 12 8 6.2 M odel W alk-Through ... 129
6.2.1 Creating and Understanding Conversation Tables ... 129
6.2.2 Adjusting Goals to Results ... 134
6.3 Implications for CTA: Available Service Restoration Options ... 138
6.4 Predicting the Impact of PDAs on CTA... 143
7. Sum m ary and Conclusions... 151
7 .1 F in d in g s ... 15 1 7.2 Conclusions... 155
7.3 Future W ork... 161
7.3.1 Im proving the M odel ... 16 1 7.3.2 Developing a Better Understanding of the Costs and Benefits of Service R estoration T echniques...162
7.3.3 Determining the Optimum Placement of Supervisors...162
7.3.4 Efficiently Dividing Work Among Supervisors Along a Route ... 162
7.3.5 Developing Digital Messaging Systems for Transit Tasks ... 163
References ... 163
Appendix A: Tables from Communications M odel ... 165
List of Figures
4 -1: B u s E arly ... 6 8
4-2: Bus Delay - Short Headway Route... 71
4-3: Bus Delay - Long Headway Route ... 73
4-4: Crush Load (One Bus - Not Delayed)... 74
4-5: M echanical Problem (M inor - Bus M ovable)... 76
4-6: Mechanical Problem (Serious - Bus Movable without Passengers) ... 77
4-7: M echanical Problem (M ajor - Bus Immobilized)... 79
4-8: Emergency / Security / Fare Dispute... 80
4-9: Accident... 82
4-10: Operator M isses Relief ... 83
4-11: Blockage ... 85
4-12: Bus Standing / Service Gap ... 86
4-13: Unfilled Run ... 88
4-14: Unplanned Bus Bridge... 89
4-15: Congestion / W eather / Route-wide Crowding ... 91
4-16: Late Pull-Out ... 92
6-1: Use of CTA Supervisory Radio, 3-3:30PM ... 121
6-2: Disruption Volum es by Hour Throughout Day... 124
6-3: Range of the Average Time to Relay Delay Reports ... 126
6-4: Lower Bound of Average Time to Relay Equipment Defect Reports... 127
6-5: Current Accident Procedure... 129
6-6: Use of Voice Channels, Observed and Simulated... 137
6-7: Current Accident Procedure... 138
6-8: Implied Delay Procedure ... 139
6-9: Actual Delay Procedure ... 141
6-10: Delays Procedure with PDAs... 145
7-1: Unfilled Run ... 152
List of Tables
4-1: Response Techniques by Category ... 53
4-2: D isruptions and Responses ... 65
4-3: Information Timeliness Example: On-Time Operations ... 94
4-4: Information Timeliness Example: No Response... 95
4-5: Information Timeliness Example: Immediate Response ... 96
4-6: Information Timeliness Example: Delayed Response 1... 98
4-7: Information Timeliness Example: Delayed Response 2... 99
4-8: Change in Passenger Waiting Time Given Different Response Times... 100
5-1: A portion of the "Know n" Page ... 107
5-2: A Portion of the "Required" Page... 108
5-3: Meanings of Rows in "Conversations" Page ... 110
5-4: Selection of "Conversations" Related to Crush Load ... 112
5-5: A Portion of the "Transm ittable" Chart ... 115
6-1: Breakdow n of a C onversation... 119
6-2: Model Input: Number of Events in Time Periods ... 124
6-3: Modeling How CTA Responds to Accidents ... 130
6-4: Supply on Supervisory Channels Available for Conversations Represented in M o d el... 13 4 6-5: Supply on Digitally Managed Bus Channels Available for Conversations R epresented in M odel ... 134
6-6: Use of Radio Channels, CTA Today (Preliminary) ... 135
6-7: Use of Radio Channels, CTA Today (Adjusted)... 136
6-8: Implied CTA recovery techniques to a delay on a short headway route ... 140
6-9: Implied CTA Recovery Techniques to a Delay (Short Headway Route)... 142
6-10: CTA Recovery Techniques to a Delay (Short Headway Route) with PDAs... 145
6-11: Supervisor Channel Sum m ary ... 147
7-1: Supervisor Channel Sum m ary ... 154
7-2: Implied CTA Recovery Techniques to a Delay (Short Headway Route)... 154
Chapter 1: Introduction
Disruptions are unplanned problems that, if not addressed, will cause transit service to gradually or suddenly worsen. Some study has been put into the effects of certain disruptions and ways to abate or recover from them. These studies sometimes assume perfect information and sometimes assume very limited information. Other studies have
looked at ways to distribute information or move decision-making, with the assumption that certain changes will improve the choice of recovery strategies. Few studies have looked at the difference that information can make, at the different ways it can be distributed, or at the capacity of a certain number of individuals to recommend and implement service management strategies based on the information they've been given. This thesis will study the effectiveness of different organizational structures and
communication systems at allowing decision makers to resolve disruptions, and present an original methodology for studying the load on communication channels and
individuals, thus allowing transit agencies to better plan communication investments and reorganization.
1.1 Disruptions and Recovery: The Context of This Research
Disruptions are unplanned events posing an obstacle to routine operation. Despite the implication of this definition, disruptions are routine in transit. A trolley breaks down, unable to carry its passengers and blocking the vehicles behind it. A passenger holds a subway door open twenty seconds for a friend, creating a slight imbalance in rush-hour headways. Construction blocks a street, stranding buses until they know how to reroute and adding travel time to the route. Other common examples of disruptions are:accidents, wheelchair lift use, fare disputes, missed reliefs, late pull-outs, demand spikes, and traffic jams.
Left unaddressed, disruptions such as these can have a number of negative consequences. In the event of the use of a wheelchair lift on a busy bus route, the extra two minutes can be enough to put the bus behind schedule and lead to bus bunching. Passengers on board that bus and passengers waiting downstream are delayed. The driver may then arrive too late to pull out of the terminal on time for his next trip, prolonging the delay to the other direction; miss a relief, creating a delay on another route; or finish his run late, costing the agency overtime.
It is usually desirable or necessary for a transit agency to respond to a disruption in some way. Often there are several aspects to respond to. In the case of a late bus, changes may need to be made to the schedule of the line to minimize passenger wait time and agency overtime. In the case of a breakdown, the above also applies, but the agency must also respond with a repair crew that can either fix the bus where it stands or tow it to a garage. In the case of an accident, both of the above also apply, but the agency must also dispatch a supervisor and the police to each take their reports. In addition, relief problems
generated by any of these incidents may need to be addressed, and vehicles on other routes might need to be held to allow for connections to be made.
A number of different service management techniques aimed at restoring regular service
and recovering from a disruption have been used and studied. A delayed bus might be short-turned before it reaches its terminal; it might be expressed to a later point; its leader might be held, to pick up passengers that would otherwise be waiting for the delayed bus;
etc. Or there might be no service management intervention other than to let the bus finish its trip, hoping its recovery time at the terminal will be sufficient to let it start the next trip on time. Many papers have studied the costs and benefits of different techniques, usually approaching the problem from the point of view of a single omniscient and
omnipotent decision-maker, knowing all quantifiable data and able to give any instruction to any vehicle. This is an excellent way to study different control strategies, but it differs significantly from the usual reality of real-time control.
1.2 Motivation
A wide variety of communication systems and strategies are in use throughout the world.
At the Chicago Transit Authority (CTA), buses communicate digitally with a control center, which communicates verbally with supervisors in the field. At the Massachusetts Bay Transportation Authority (MBTA), buses, chief inspectors, radio cars and
dispatchers all share one radio channel for their service area. These communication systems offer very different capabilities to decision-making personnel. At the CTA, the control center can track the location of individual buses and send text messages to an individual bus operators or operators en masse, but street supervisors cannot
communicate with bus operators without going through the control center or visiting the bus in person. At the MBTA, buses cannot be tracked and there is no digital messaging, but supervisors and bus operators can communicate directly.
Different service management techniques require different kinds of information and communication channels. The CTA can easily hold buses ahead of schedule at certain points where street supervisors are stationed, but it is difficult to hold the leader of a late bus. The MBTA, having fewer street supervisors at points along routes, would find it
takes more work to hold a bus that's ahead of schedule than at CTA, but thanks to easier communication it would be no harder to hold a late bus' leader. Even within the use of one service management technique, different communication systems allow for different variations of that technique. In a recent study Xuhui Yang found that vehicle holding
supported with real-time information could be more precise than without, leading to a
38% reduction in passenger wait time (Xuhui Yang, 2002.)
Different communication systems enable an agency to use different service management techniques. Agencies across the country are beginning to make serious investments in technologies such as GPS, digital radio, digital messaging, cell phones, etc. As they look at technologies and choose among them, the fundamental question an agency must face is "how will this communications system allow us to improve service, and does it justify the cost?" Currently, there is no documented systematic method for answering this question in transit.
1.3 Purpose of This Thesis
This thesis studies the effectiveness of different organizational structures and communication systems in supporting transit personnel's efforts to recover from disruptions. The impacts of centralization and decentralization are considered. Communication technologies, including conventional radio, trunked radio and digital messaging are considered. This study is to produce information on which structures, and which technologies, effectively enable an agency to use particular service management techniques, and therefore how effectively the organization can then improve service.
This thesis also introduces a new methodology for assessing a transit agency's real-time decision-making capacity. This methodology takes the personnel deployment,
communications system, service volume and disruption frequency data as inputs and produces the service management techniques that are available to recover from these disruptions as outputs. This methodology can also illustrate bottlenecks and potential areas of improvement. It is to be usable for diagnosing an existing system, studying a proposed organizational change, studying a proposed communications change, and studying change to both at once.
1.4 Method
The methodology has two parts. The first must be performed once to calibrate the model; the second must be performed for each use of the model.
In the first part, the author will categorize the different disruptions to which an agency can respond, the different service management techniques it can use, and how they correspond. He will break down each step of each service management technique, and determine what information is needed to effectively carry out each step, as well as what instructions must be given out. The author will categorize different communications technologies, and the amount of "strain" that relaying the above instructions and pieces of information takes.
The second part is to study an agency for a given time of day. Using knowledge of an agency's management structure, the author will map out who performs what step, who gives instructions to whom and what communication options people in different positions have available. From this, the model will derive what information needs to be
communicated from the information people already have and the information each task requires. It will also derive what methods of communication can be used for these
methods. Combining this information with the number of disruptions (and hence tasks) an agency faces and the "strain" each message takes will show the use of each
communication channel, and the elimination of infeasible options will show the limits of the responses available to the agency.
1.5 Structure of This Document
Chapter two will serve as a literature review. This will include papers on the
appropriateness of responses to disruptions, some existing service management strategies, some of their positives and negatives, and the study of organizations and
communications.
Chapter three will provide a brief overview of different communication technologies currently available. The strengths, limitations and capacity issues of voice
communication, digital messaging and direct contact, among others, will be described.
Chapter four will catalogue the different disruptions that can affect operation, the different service management techniques that an agency can employ, and how they correspond. The decisions that must be made to choose the most appropriate response and the information required for every step will be identified. Each disruption and service management technique will be described individually, and while broad
generalizations will be made regarding the general usefulness or effectiveness of each technique, the thesis will not attempt to simulate the choice of an appropriate technique for a given situation, or attempt to demonstrate that any technique is categorically more useful than another. The importance of timeliness in information will also be described.
Chapter five will describe the model for appraising an agency's service management strategy. It will outline the assumptions, the theory, and the step-by-step instructions involved.
Chapter six will analyze the Chicago Transit Authority's bus operations, and serve as a walkthrough of the methodology used. The agency's actors and communication system will be described; the agency's volume of disruptions and assignment of responsibility will be described; the methodology will be walked through, step by step. The model will also be applied to study the introduction of a new communication system. The strengths and weaknesses the model indicates for each strategy will be described, and a
recommendation of whether the change would be a significant improvement will be made.
Chapter seven will review the thesis and the analysis method, including its strengths and weaknesses. Conclusions will be drawn on effective service management strategies. Finally, future work will be suggested.
Chapter 2: Literature review
In this chapter, we will first review bus service management and the context of a bus service management strategy. We will look at the differences between some service management strategies, and some of the differences in their effectiveness. We will introduce an existing framework that could be applied to service management strategies, and observe where it is applicable and where it is lacking, notably in the role of
communication. We will introduce a model used to study communications issues, and finally we will propose a means of combining these two models into one method, and outline the steps necessary to do so.
2.1 Context: Theory and Practice of Bus Service Management
An extensive body of literature exists describing the problems ("disruptions") that can occur in bus service and the effectiveness of various responses. One excellent guide covering numerous disruptions and responses is Theory and Practice ofBus Service Management, based on the restoration techniques used by RATP in Paris (Edith Froloff etal., 1994). This book details the problems that commonly occur in bus transit, the responses commonly applied, and what one must consider in choosing the most appropriate response. It begins by defining service management:
"The OS [Operating Schedule] is the result of an optimization of the supply of service as a function of the objectives and the constraints of the operation. However, since this optimization is carried out in "anticipated time," it requires, in particular, the formulation of hypotheses on the conditions of traffic and the demand for service. Now, these two factors are complex phenomena, and are of an uncertain nature. This is why the
OS can only define the modes of optimal functioning of the route for the
average conditions, it becomes necessary to manage the service in order to confront the degradation of the quality of service which arises from this drift.
"Service management is, therefore, the process of the adjustment in real time of the OS to operating conditions." (p 11)
There are many disruptions that can occur on a route. A bus can be behind or ahead of schedule. Buses can bunch together. A breakdown can occur, needing a repair or a tow and leaving the route with one less buss but just as many drivers. Supervisors face competing and conflicting goals, as well, principally headway regularity, schedule adherence, serving all passengers, getting relief drivers to relief points on time, and staying within budget. Management identifies fifteen different common restoration actions that address some of these goals:
"a) Six restoration actions at the originating terminal: - jumping
- reassigning
- shift schedule time frame - elimination of a departure - insertion of a departure - re-spacing of intervals "b) Six restoration actions on the route:
- modification of the scheduled running times - waiting at a bus stop
- bus change
- passing on the route
- exchange of drivers on the route - deviation
"c) Three service management restoration actions which can be directed as required by the situation, at the terminal or on the route:
- the change of trip type by short-turning
- the change of the trip type by means of extension
- the change of the trip type by means of trip modification" (p 18)
(See chapter 4 for explanation of these response techniques.)
Management describes a number of situations for which the impacts of different
responses are discussed. A wealth of information is provided for the reader to consider: the schedule of a route, branches, length, demand along various segments, relief points, traffic conditions, the nature and cause of a problem, and a time/space diagram showing every bus on the route are shown and their impact on decisions discussed. Of a route with even loads throughout it notes that when dealing with a late bus
"the restoration action of a deadhead, which is intended to move a vehicle, as quickly as possible, to a point of loading is, therefore, not effective. In regard to short-turns, these are very poorly received by the passenger in this configuration. In case of a significant delay, the controller can be led to order dropping a round trip for one or several vehicles." (p 69)
On a route where the relief point is far from the garage, it observes that if a relief driver is absent then "a long time is necessary for a substitute driver from the depot to get to the relief point. The controller is often led to cancel the departure, with re-spacing, and to have the vehicle parked." (p 87)
These diverse problems offer the reader an opportunity to learn what makes one response appropriate for a given situation and another not. They also serve to illustrate one of the chief difficulties in service management. While it is already challenging to solve these problems when shown all information, a supervisor charged with making such a decision often knows a fraction of the information given in the book and is unable to use some of the techniques shown. For instance, if one bus is falling behind schedule, one technique
is to hold its leader. But to do that a supervisor standing on the street must know the bus is late as its leader passes him or must be able to communicate with the leader when the late bus reaches him. The comparison is not strictly fair, but illustrative: a street
supervisor and a service planner are both charged with creating an operating schedule, but a supervisor must do so with less data, with fewer tools, and in a fraction of the time. Because if he takes too much time, not only has the situation deteriorated (a route "tends to move away from optimum") (p 12, Edith Froloff et al., 1994) but other disruptions he is responsible for will begin to pile up.
This begs the question: what can we do to facilitate effective decision-making for service restoration? What information and tools should we provide, what tasks should we
automate, how many people should oversee one route, how many routes should one person oversee, should a given disruption be managed by different people, how should they divide up the work, and who should have final authority?
An organizational structure with associated communications and computations systems provides a set of answers to these questions and is what is meant by service management strategy.
2.2 Some Basic Approaches to Service Management
The basic resources for service restoration are" Point supervisors " Mobile supervisors
* Dispatchers
" Communication " Computer aid
There are many ways in which these resources can be combined. Some of the broad characteristics that differentiate service management strategies are
" Centralization - work and responsibility can be focused in the control center, or in the field
" Automation - tasks can be accomplished with much or little computer help
" Regionalization - people can be organized into groups overseeing different service areas or can be organized as one large unit
" Specialization - individuals can manage one aspect of many disruptions or all aspects of fewer disruptions
These characteristics are all relevant to the service management strategies described briefly below. In Denver's Computer Aided Dispatch Automatic Vehicle Location System: The Human Factor Consequences, Mary D. Stearns, describes the strategy of Denver's Regional Transportation District (RTD.) RTD operates a system of about 800 buses and two light rail lines, with 12 mobile supervisors and six dispatchers on duty at peak (there are no point supervisors.) A digital messaging system allows location tracking and digital messaging between all parties, and automation facilitates seeing all buses on a route. Voice communication is possible between dispatchers and supervisors with no delay and possible from buses to dispatchers or supervisors with some delay. The strategy is highly centralized and automated. Bus operators report problems to the control center, and schedule deviations are detected electronically and reported to the control center. If a situation can be addressed through instructions to bus operators a dispatcher will address it, otherwise he will dispatch a supervisor to the scene. This
system has helped the agency be very effective at incident management and schedule adherence - on time performance increased from 88% to 90% between 1992 and 1996 despite increasing ridership (Mary D. Stearns, 1999.)
The Massachusetts Bay Transportation Authority (MBTA) operates a similarly sized bus system with about 800 buses, and also operates four subway lines and an extensive commuter rail network. (A bus rapid transit line is under construction at this writing.) They have 18 point supervisors, 18 mobile supervisors and two dispatchers on duty at peak. Each of two radio frequencies is applied to buses, supervisors and a dispatcher by service area, and supervisors have access to one additional frequency. Their system is regionalized, very decentralized and uses almost no automation. Buses that experience a significant disruption announce it over their radio channel and the supervisor assigns it to a supervisor, who handles all aspects of the disruption. Schedule and headway issues are dealt with almost exclusively by supervisors at terminals. This system helps the agency be effective at incident management but poor at schedule adherence - in a recent
performance review, not one route achieved the agency's on-time performance goals.
The Chicago Transit Authority (CTA) operates a bus system of 1,800 buses as well as six rapid transit lines, and works in cooperation with Metra, which provides an extensive commuter rail network, and Pace, which provides suburban bus service. At peak it has over 60 point supervisors, five mobile supervisors and six dispatchers. Eight radio frequencies are available to bus operations. Most of CTA's buses have digital
messaging, GPS and automatic voice channel management. Supervisors have ordinary radios and the control center has both but supervisors cannot communicate with bus operators except in person. Their system is specialized and not very automated. Two radio channels are allocated to supervisors and the balance to bus communication. Buses report problems to dispatchers, dispatchers may take some action but for most issues
inform the supervisors of the problem. The system helped the agency be adequately with at incident management but is poor in terms of schedule adherence.
It should be noted that CTA's digital messaging technology has only been in use since
1999, and was originally intended to be part of a more complex system. The current
dispatching technology, Bus Emergency Communication System (BECS,) was to be part of an automated schedule monitoring and adjustment system called the Bus Service Management System (BSMS.) This system would allow for centralized oversight of schedule adherence and headway regularity in the control center, where controllers would monitor routes and intervene to maintain schedule adherence. BSMS was designed to automatically suggest recovery techniques and automate their execution, and was intended to perform customer service tasks like automating stop announcements and updating real-time arrival signage at bus stops. For a variety of reasons CTA no longer plans to implement BSMS as described, although some of the underlying software would support a proposed modification discussed in chapter 6. The general opinion at CTA, as revealed in interviews conducted in the summer of 2001, was that BECS had made operations more difficult and been marginally detrimental to service quality.
Of course an agency's effectiveness at managing incidents or delays is not solely a
function of its service management strategy. But the importance of service management cannot be dismissed either. When Tri-Met introduced digital messaging and bus tracking in Portland, headway variation declined by 15% in the peak. In an experiment, Tri-Met then modified the division of responsibility among supervisors and dispatchers to facilitate more service restoration techniques along its "transit mall" trunk corridors, causing another 9.4% reduction in variance along those corridors (James G. Strathman,
2001.) In Canada the Toronto Transit Commission (TTC) introduced vehicle tracking and centralized schedule monitoring in 1976 and experienced moderate increases in on-time performance despite a 30% increase in vehicular traffic and a 13-21% increase in ridership (Edward K. Morlok, 1993.) But what characteristics of a service management strategy make it effective or ineffective? Why did Denver, Tri-Met and TTC experience service improvements with GPS and digital messaging while CTA employees felt the change made things worse? How can an agency predict what changes in effectiveness a change in strategy may bring? And how can it choose a strategy that will improve performance?
2.3 Techniques for Studying Service Management Strategies
In his 1990 thesis, Robert Fellows devised an effective method for studying alternate management strategies for maintaining even headways on the MBTA's Green Line. The Green line is a very old light rail line with four branches and 200,000 daily passenger trips, and has historically been operated in a decentralized manner. Point supervisors manage headways and schedule adherence with radio and personal contact, while a dispatcher served primarily to coordinate emergency response. The MBTA was considering upgrading the Green Line's communication system to provide location information in the control center, and using that information to heavily centralize operations. Fellows' thesis compared the performance of the existing strategy with the likely performance of centralized operations.Fellows drew on existing Green Line analysis to study the effectiveness of point
supervisors' headway restoration decisions. He cited Deckoff's 1990 work, in which a spreadsheet model of observed restoration decisions showed that 73.8% of short turns
reduced total passenger delay. Deckoff also concluded that by using different decision-making rules, supervisors could increase their success rate to 93.6% without any
additional tools (and passenger time saved would increase from 9,400 minutes to 13,000 despite a reduction in the number of interventions.) He then studied the control center's likely abilities based on the information that dispatchers would have. He found that while the dispatcher would have more access to information about the line as a whole than supervisors do, they would not have access to the level of detail that supervisors have, and in particular "The resolution of the information provided by the [proposed] system may not be fine enough to provide an intuitive graphical representation of train spacing..." (p 85) and that the system would "fall short of providing much of the
information needed to make the routine headway management decisions" (p 88) currently performed by supervisors. He concluded that, contrary to centralizing decision-making,
"continuing the present division of authority, such that dispatchers continue to manage incidents and inspectors continue to control headways, may be the only way to capture the benefits of improved information and strategic control promised by the introduction of AVI." (p 146) His advice was heeded and the MBTA did not centralize its Green Line operations.
Fellows' thesis suggests the fundamentals of studying service management strategies. He studied what people would know under different circumstances, and how that would impact the quality of their service restoration decisions. The methods of Fellows' thesis, however, cannot be directly applied to bus service management. Most bus networks are
significantly more complicated in total than one light rail line. The mechanics of headway and schedule restoration are different due to smaller passenger loads, larger
headways, and mixed traffic. Bus operations' higher frequency of accidents, mechanical defects and route diversions make studying the effectiveness of incident management strategies as important as studying headway maintenance. Finally, there may be
numerous routes that interact and far more vehicles, but far fewer supervisors per vehicle and fewer shared communications resources per vehicle. (The MBTA has 3.7 two-car Green Line trains per supervisor and 28 buses per supervisor. A national survey in 1991 found that 21 buses per supervisor was typical (Herbert S. Levinson, 1991.)) This makes effective division of labor and communication of information both more important and more difficult.
In Craig Phillip's 1980 thesis Improving Freight Car Distribution Organization Support Systems: A Planned Change Approach, he suggested a framework for studying a problem that reflects some of the complication of bus management: efficient distribution of empty cars on a large freight rail network. Phillip defines the goals of the process as "control tasks," and suggested the following approach to studying their effectiveness:
"Based on previous research concerned with decision-making and organization behavior, three key dimensions of this [task] environment have been identified: (1) the organizational structure; (2) the information systems; and (3) the decision processes. Unfortunately most previous research has focussed (sic) on a single one of these elements; linking the analysis of all three together in a consistent fashion remains a significant challenge. Yet it is the linkage which is essential, since the problem here is to understand how changes in one dimension impact, and are impacted
by, the other two dimensions.... by organizing the analyses of the three
dimensions around these control tasks it is possible to understand how changes in one will impact or be impacted by the other two." (pp 21-23)
The fundamental building blocks of the distribution problem are a number of moving vehicles traveling over a large network, a network that must be managed in a way that continually brings the system closer to its ideal (no empty cars,) despite continuously changing circumstances and the impossibility of one individual knowing or
understanding every system variable. Freight cars are not buses, but the problem is analogous to bus service management in slow motion. By defining the different control tasks of freight rail in the context of decision processes, organizational structure and
information systems - and how those aspects interrelate - one can determine the
effectiveness of a task environment at managing freight. By defining the different disruptions that must be addressed in bus service in the context of the steps of each decision and response, who has what responsibility, and how they communicate
information - and how those aspects interrelate - one can determine the effectiveness of a bus service management strategy.
The steps of decisions and responses can be derived from the detailed analysis of
responding to disruptions in Theory and Practice ofBus Service Management. Potential assignments of responsibilities to individuals can come from reviewing agency structure in the manner shown in section 2.2. What remains is a framework for studying
communication.
2.4 Communication's Limits: The Burlington-Northern Study
In 1990, the Burlington Northern radio was considering a shift from voice dispatching to digital messaging, and needed to determine what impact such a change was likely to have. In A Comparison of Voice and Data Link Communication: Railroad Dispatcher's Perspective, John Vanderhorst studied the existing use of communication to answerquestions such as "What does the dispatcher experience in using these media to
communicate? What amount of communication is required of the dispatcher using these media? How long do communication exchanges take? What types of messages are communicated?" (p 6) He accomplished this by transcribing entire days of radio communication and noting the purpose of the communication, the information being conveyed, and the length of time the communication took. He then compared it to the way each task would be handled and how each piece of information would be sent using a proposed digital system. This allowed him to compare the difficulty of the task for the dispatcher and the speed of information delivery between the two systems, and served to demonstrate whether any messages were currently in use but would not be supported digitally. The analysis concluded that the change would reduce dispatcher workload, by making information easier to get and automating some processes, and would improve communications speed and efficiency by eliminating problems of weak radio
transmission and multiple parties trying to use the radio at once.
This analysis was performed on freight rail, but the technique is applicable to bus communications. By studying the messages on a communication channel, the
information given, the people giving it, the time spent, and the conflicts from overuse, one can gauge what needs that channel is meeting and what needs it is not.
2.5 Summary
Bus service can experience frequent, varied and unpredictable disruptions. A number of responses can be used to mitigate these disruptions, and determining the most appropriate response to a disruption, even on paper, is a complicated process with many variables. In transit service, those choosing a response do not have access to all the variables or all
responses, and can make better decisions with more information and tools. Defining an organizational structure and communication system distributes information,
communication and responsibility to give a decision maker the most information possible related to the decisions he makes.
Not all service management strategies are equally effective. Existing studies of similar topics suggest a method for studying a bus service management strategy. The steps necessary to respond to a disruption and the information required to do them well can be derived from existing literature studying responses to disruptions. The assignment of tasks to decision-makers can be derived from an organizational structure. The
effectiveness of communication channels can be derived from studying the information that it needs to carry and its ability to carry it. Combining these approaches will show how quickly an organization can respond to a disruption, what techniques it can apply and how effectively it can choose between them. The more responses an agency has available to a kind of disruption and the more information it can use in choosing among them, the better the response chosen for each distinct disruption can be. This thesis will not determine the relative effectiveness of every response at dealing with every manner of disruption, but instead will understand that a strategy that enables more responses is more effective, and that certain types of responses are complimentary. This approach will lead to a demonstration of how well an organization can respond to particular disruptions using a given strategy, and an effective analysis of bus service management strategies.
Chapter 3: An Overview of Communications Channel
Types
In this chapter, we will examine some of the communications options available to an agency. For each channel we will comment on who can use it to communicate, and with how many people at once; how quickly it can be used; what can be communicated; what the capacity is, and how service degrades as it approaches capacity; how reliable they are, in general and under specific circumstances; and how they can be recorded. The
communications systems covered will include "open mic" radio channels, trunked radio, digital data, direct contact, cell phones, conventional and pay phones, and silent alarms.
3.1 Open Mic Radio Channels
Open mic radio channels are the most conventional form of radio, dating back to the start of the twentieth century. Fixed or portable radios can transmit sounds on a given radio frequency, and any other radio tuned to that frequency play the sound. Someone using the radio cannot speak over the frequency and listen to it at the same time. For wide areas, an agency may have "repeaters," large antennas that pick up signals and rebroadcast them in other areas, allowing for better reception over large areas. An agency typically has access to a fixed number of frequencies which it can use as it sees fit. Communications can be scrambled to prevent those outside the agency from
eavesdropping, but typically are not, in which case anyone with a commercially available police scanner can listen in. It is not uncommon for news agencies to have scanners listening to radio transmissions, including those of transit agencies.
Anyone with an agency radio can speak on one of these frequencies, and everyone else on the frequency will hear it. While in theory one can start speaking as soon as one
wants to - the moment someone pushes his radio key, his radio is transmitting - in reality not only must he wait for the frequency to be clear of other conversations, but he must get the attention of the parties relevant to his message, and for a busy frequency he may have to get permission from a central authority to speak. This, in addition to the end of the conversation, results in an average of about ten seconds of overhead for each
conversation (see appendix B.) Almost any information can be communicated on an open mic radio, but if the signal is not scrambled, it cannot be used for information that must stay within the agency for reasons of public relations, customer or employee privacy, or security. The greater the amount of information transmitted, the greater amount of capacity, or time, is used (see appendix B.) Radio frequencies are vulnerable in a number of ways. Something as simple as one employee sitting on his radio's "talk" button can make a frequency virtually useless. Although radios are a very old and well-understood technology that can be built reliably, parts of individual radios still break in the field. If a repeater tower loses power or is knocked down in a storm, it can be difficult for people in one area to be heard by those outside it and vice-versa, although if a system is built with some redundancy the problem would be minor. Interference can also be a problem in severe weather. A radio frequency can be interfered with by those with ill intent by sabotage of the repeaters or transmission of static over the frequency. Agencies can record channels for quality assurance and legal liability purposes.
3.2 Digitally Managed/ Trunked Radio Channels
This category refers to any kind of communication that is voice communication over radio waves but is not open mic. A central computer or special digital protocol between radios dynamically assigns the ability to speak and listen to certain frequencies according
to the needs requested by the users. This means that the frequencies can be used for specific one-to-one conversations or conversations with groups of people. Trunked radio is relatively new, and different standards have different characteristics. Some increase the conversations that can occur per frequency, some do not. Some carry data, some do not. Some are secure and safe for confidential information, some are not. Time to set up a conversation can vary greatly, from an average time of 105 seconds from a bus' request to talk to the start of conversation at CTA (assuming immediate controller response) to an average time of 0.5 seconds with TErrestrial Trunked RAdio (TETRA,) which is being adopted by a number of European public service agencies. The technology used and the number of frequencies available both have an impact on conversation setup speed.
Digitally managed radio frequencies can offer the considerable advantage that a user can address a message to an arbitrary group of people determined on the fly, rather than a fixed group of people as with an open mic channel. If an agency is too large to contain all of its communications on one channel, this avoids the inefficiency of having to send some messages on both channels to reach everyone, and having to hunt through several channels to find a specific person. Also, by assigning different open mic frequencies to different regions or aspects of service, the demand on some of those channels can exceed capacity, while others go underutilized. This can happen consistently, as it is rarely possible to divide the frequencies between functions such that each will have an equal amount of demand, and it can happen sporadically, as an unusually large number of disruptions occur at once in a given aspect of service. By assigning frequencies to conversations dynamically, trunked radio makes the only constraints to establishing communication the number of frequencies available and the availability of radio users.
If a radio system is managed by a central computer, as is common, a failure in the
computer can lead to a failure in the communication system. Depending on design and the nature of the failure, the radios may become entirely inoperative, or could revert to a fixed-frequency system. A digital radio system is less vulnerable to jamming or
interference, as interference with one frequency reduces the capacity shared by everyone using the digital system, rather than eliminating the capacity of everyone using the given frequency. In other ways, such as with the use of repeaters, trunked radio is like open mic radio.
3.3 Digital Messaging
The transmission of digital messages can occur either over wires or over a dedicated radio frequency. Transmission over wires is most often done with a "broadcast" protocol, such as Ethernet, which is decentralized. Due to the higher lag time of radio, communication over the air is more often through "polling," in which all messages go through a central computer. Digital messaging has several advantages not found in voice communication, and also its own drawbacks.
Digital messages can go from anyone with a digital message unit to anyone with a digital message unit, including a number of recipients simultaneously. A computer program performing simple service management tasks automatically could be the sender of the message, the recipient, or both. A message might also contain some information from a person and some from a computer, as when a bus driver sends a breakdown report and the on-board computer includes the bus' location in the message. The capacity of a digital messaging frequency allows for many more messages to be sent during an hour over one frequency than would be possible with voice. Messages can be automatically
queued for the recipient, allowing them to finish the task they are working on before reading the message, and allowing multiple senders to send messages to the same recipient simultaneously.
The drawbacks of digital messaging include the cost, the limitations on what messages can be sent, the speed and accuracy of sending a message, and its inability to support a conversation. A digital messaging system can only send the messages that it was
designed for. This limits the amount of detail that can be given about a situation. If a bus operator can only send a message saying he has a mechanical defect, voice
communication is necessary for the respondent to determine the severity of the defect and the most appropriate response. The more messages are made available to send, the more complicated the system, and the greater the chance of operator error. More messages available for sending also mean that it takes longer to enter the message to be sent. If a bus operator wishes to report that he is behind schedule, it may only take him ten seconds
to send the message using an open mic, and he may be able to do it when the bus is in motion. If it takes him one minute to enter the report into a computer, and he must pull
over to do so safely, he is now an additional minute late. Dispatchers and mobile
supervisors may have access to systems with keyboards, allowing them to send whatever text message they wish, but this is unwieldy for street supervisors and bus operators, who must usually choose a limited number of messages from a menu. The limitation on what data can be sent also limits the possibility of collaborative problem solving over the
communications channel, which is more difficult without the freedom to explain whatever details are thought relevant and the nuances of voice communication.
Digital messaging handles excess demand more gracefully than open mic or trunked radio. Messages may be relayed more slowly, but it would take a prolonged and
exceedingly high demand to delay messages more than several seconds. Communication over wires is dependant on the condition and security of the wires, while communication over the air is dependant on all the factors found in any radio system (see section 3.1) and the operation of one central computer. Digital communication is more susceptible to repeater tower failure than voice communication. If a repeater tower is disabled, people on voice radio can often be picked up through another tower, and need only to shout and repeat themselves to be heard over the static. Data units cannot always compensate in the same way. One cannot eavesdrop on data messages without equipment and inside
knowledge, so they are appropriate for confidential communication. Not only can agencies record digital messages for quality assurance and legal liability purposes, but they can also use the stored information to study service issues - searching the data automatically to find out how many delay reports were sent during a particular time of day, for example. (For an example of this application, see section 6.1.2.)
3.4 Direct Contact
Direct contact refers to people in the same place communicating with each other without any kind of technology. It goes without saying that anything can be said, nothing is recorded, the only capacity issue is the limit of what one person can do in a given period of time, and personal contact is not susceptible to malfunction or sabotage.
The constraining aspect of direct contact is that it can only occur between people who are in the same place, while transit agencies are most concerned with moving objects. This means that messages between a bus and a point supervisor cannot be given by direct
contact until the bus reaches the point supervisor, at which point the bus must hold in that place until the conversation is finished. Messages between a bus and a mobile supervisor can only occur if the mobile supervisor seeks out the bus, which depending on the
situation may mean that some other method of communication was necessary to initiate the process.
This constraint and the awareness of bus locations and conditions in the supervisor's line of sight are the principle factors to consider when deciding where along a bus route a point supervisor can do the most good. Placement of street supervision is an involved topic, of too much depth to explore fully here. Broadly, supervisors at terminals are better equipped to reschedule the street and manage route-wide issues, while supervisors along the route are better equipped to manage headways and make schedule adjustments to individual buses. See chapter four for more information on these problems and recovery techniques.
3.5 Cellular Phones
Cellular phones allow their users to communicate with any other individual with a phone. It takes on the order of thirty seconds to establish communication with another individual, and longer to establish communication between three people. They are normally used for communication between two people, as communication between three is usually
unwieldy.
Cellular phones make bandwidth an issue of the supplier, rather than the agency. This can be positive, when a major disruption causes an agency to need much more capacity than it would ordinarily budget for, or when an issue would benefit from a prolonged