HAL Id: hal-02108817
https://hal.archives-ouvertes.fr/hal-02108817
Submitted on 24 Apr 2019
HAL is a multi-disciplinary open access
archive for the deposit and dissemination of
sci-entific research documents, whether they are
pub-lished or not. The documents may come from
teaching and research institutions in France or
abroad, or from public or private research centers.
L’archive ouverte pluridisciplinaire HAL, est
destinée au dépôt et à la diffusion de documents
scientifiques de niveau recherche, publiés ou non,
émanant des établissements d’enseignement et de
recherche français ou étrangers, des laboratoires
publics ou privés.
Emission (VESTIGE) II. Constraining the quenching
time in the stripped galaxy NGC 4330
M. Fossati, J. Mendel, A. Boselli, J. Cuillandre, B. Vollmer, Samuel Boissier,
G. Consolandi, L. Ferrarese, S. Gwyn, P. Amram, et al.
To cite this version:
M. Fossati, J. Mendel, A. Boselli, J. Cuillandre, B. Vollmer, et al.. A Virgo Environmental Survey
Tracing Ionised Gas Emission (VESTIGE) II. Constraining the quenching time in the stripped galaxy
NGC 4330. Astronomy and Astrophysics - A&A, EDP Sciences, 2018, 614, pp.A57.
�10.1051/0004-6361/201732373�. �hal-02108817�
February 14, 2018
A Virgo Environmental Survey Tracing Ionised Gas Emission
(VESTIGE).
II. Constraining the quenching time in the stripped galaxy NGC 4330
M. Fossati
1, 2, J.T. Mendel
1, A. Boselli
3,?, J.C. Cuillandre
4, B. Vollmer
5, S. Boissier
3, G. Consolandi
6, L. Ferrarese
7, S.
Gwyn
7, P. Amram
3, M. Boquien
8, V. Buat
3, D. Burgarella
3, L. Cortese
9, P. Côté
7, S. Côté
7, P. Durrell
10, M.
Fumagalli
11, G. Gavazzi
12, J. Gomez-Lopez
3, G. Hensler
13, B. Koribalski
14, A. Longobardi
15, E.W. Peng
15, J.
Roediger
7, M. Sun
16, E. Toloba
171 Max-Planck-Institut für Extraterrestrische Physik, Giessenbachstrasse, 85748, Garching, Germany e-mail:
2 Universitäts-Sternwarte München, Scheinerstrasse 1, D-81679 München, Germany
3 Aix Marseille Université, CNRS, LAM, Laboratoire d’Astrophysique de Marseille, Marseille, France e-mail:
4 CEA/IRFU/SAP, Laboratoire AIM Paris-Saclay, CNRS/INSU, Université Paris Diderot, Observatoire de Paris, PSL Research
University, F-91191 Gif-sur-Yvette Cedex, France
5 Observatoire Astronomique de Strasbourg, UMR 7750, 11, rue de l’Université, 67000, Strasbourg, France 6 INAF Osservatorio Astronomico di Brera, Via Brera 28, 20121 Milano, Italy
7 NRC Herzberg Astronomy and Astrophysics, 5071 West Saanich Road, Victoria, BC, V9E 2E7, Canada
8 Unidad de Astronomía, Fac. de Ciencias Basicas, Universidad de Antofagasta, Avda. U. de Antofagasta 02800, Antofagasta, Chile 9 International Centre for Radio Astronomy Research, The University of Western Australia, 35 Stirling Highway, Crawley WA
6009, Australia
10 Department of Physics and Astronomy, Youngstown State University, Youngstown, OH 44555, USA
11 Institute for Computational Cosmology and Centre for Extragalactic Astronomy, Department of Physics, Durham University,
South Road, Durham DH1 3LE, UK
12 Universitá di Milano-Bicocca, Piazza della scienza 3, 20100, Milano, Italy
13 Department of Astrophysics, University of Vienna, Turkenschanzstrasse 17, 1180, Vienna, Austria
14 Australia Telescope National Facility, CSIRO Astronomy and Space Science, P.O. Box 76, Epping, NSW 1710 15 Department of Astronomy, Peking University, Beijing 100871, China
16 Department of Physics and Astronomy, University of Alabama in Huntsville, Huntsville, AL 35899, USA 17 Department of Physics, University of the Pacific, 3601 Pacific Avenue, Stockton, CA 95211, USA
ABSTRACT
The Virgo Environmental Survey Tracing Ionised Gas Emission (VESTIGE) is a blind narrow-band Hα+[NII] imaging survey carried out with MegaCam at the Canada-France-Hawaii Telescope. During pilot observations taken in the spring of 2016 we observed NGC 4330, an intermediate mass (M∗ ' 109.8M ) edge-on star forming spiral currently falling into the core of the Virgo cluster.
While previous Hα observations showed a clumpy complex of ionised gas knots outside the galaxy disc, new deep observations revealed a low surface brightness ∼ 10 kpc tail exhibiting a peculiar filamentary structure. The filaments are remarkably parallel to one another and clearly indicate the direction of motion of the galaxy in the Virgo potential. Motivated by the detection of these features which indicate ongoing gas stripping, we collected literature photometry in 15 bands from the far-UV to the far-IR and deep optical long-slit spectroscopy using the FORS2 instrument at the ESO Very Large Telescope. Using a newly developed Monte Carlo code that jointly fits spectroscopy and photometry, we reconstructed the star formation histories in apertures along the major axis of the galaxy. Our results have been validated against the output of CIGALE, a fitting code which has been previously used for similar studies. We found a clear outside-in gradient with radius of the time when the quenching event started: the outermost radii were stripped ∼ 500 Myr ago, while the stripping reached the inner 5 kpc from the centre in the last 100 Myr. Regions at even smaller radii are currently still forming stars fueled by the presence of HIand H2 gas. When compared to statistical studies of the
quenching timescales in the local Universe we find that ram pressure stripping of the cold gas is an effective mechanism to reduce the transformation times for galaxies falling into massive clusters. Future systematic studies of all the active galaxies observed by VESTIGE in the Virgo cluster will extend these results to a robust statistical framework.
Key words. Galaxies: clusters: general ; Galaxies: clusters: individual: Virgo; Galaxies: evolution; Galaxies: interactions; Galaxies: ISM
? Visiting Astronomer at NRC Herzberg Astronomy and
Astro-physics.
1. Introduction
It has long been known that galaxies are not uniformly dis-tributed in the Universe. Works by e.g. Oemler (1974), Dressler
(1980), and Balogh et al. (1997) showed that galaxies in high-density environments are preferentially red and form new stars at a lower rate compared to similar objects in less dense envi-ronments. The more recent advent of large-scale photometric and spectroscopic surveys have confirmed with large statistics that the most massive dark matter haloes (cluster of galaxies) are mainly composed of quiescent objects with an elliptical or lentic-ular shape. Conversely star forming disc-like systems are dom-inant in the field and in lower mass haloes (Balogh et al. 2004; Kauffmann et al. 2004; Baldry et al. 2006). Moreover, gas-rich galaxies are found in lower density environments than optically selected galaxies are (Koribalski et al. 2004; Meyer et al. 2004), suggesting a strong interplay between the gas cycle and the star formation activity of galaxies.
Different mechanisms have been proposed in the literature to explain this observational evidence (e.g. gravitational and hydro-dynamical interactions), as reviewed in Boselli & Gavazzi (2006, 2014). The role and the importance of each of these processes in shaping galaxy evolution, however, is still under debate. Many variables are indeed at play, including the mass of the perturbed galaxy, the mass and density of the perturbing region, and the epoch of the interaction.
Theoretical works and numerical simulations have shown that once galaxies fall into a more massive halo and start to or-bit in it as satellites, they lose the ability to accrete fresh gas from the cosmic web (see e.g. Larson et al. 1980; Dekel & Birn-boim 2006). This leads to a quenching of the star formation ac-tivity once the cold gas located on the disc is fully transformed into stars, which occurs on timescales of several Gyr. This phe-nomenon, variously called ‘starvation’, ‘strangulation’ (Larson et al. 1980), or ‘overconsumption’ (McGee et al. 2014), is sup-ported by a statistical analysis of a large sample of galaxies from the Sloan Digital Sky Survey (SDSS), which suggests a quench-ing timescale of ∼ 5–7 Gyr since their first accretion as satel-lites in group-like environments (Wetzel et al. 2013; Hirschmann et al. 2014; Fossati et al. 2017). These authors further broke the quenching event into two phases: a delay time (∼ 2 − 5 Gyr) dur-ing which the star formation activity of the satellite is unaffected. This phase is characterised by the replenishment of the molec-ular gas reservoir via gas cooling from a warmer phase (e.g. atomic). After this time, the star formation rate (SFR) rapidly fades due to the reduction of the molecular gas mass via star formation.
However, for satellite galaxies in massive clusters of galax-ies, several authors have found shorter (1 − 2 Gyr) quenching timescales (Boselli et al. 2016b; Oman & Hudson 2016). Al-though the different methods make the comparison to the de-layed+rapid quenching model non-trivial, it is generally found that both the delay and the fading phases get shorter once the effect of quenching in haloes different from the cluster environ-ment are taken into account (Oman & Hudson 2016). However, other authors have found that at least a fraction of the cluster satellite population is gradually and continuously quenched on timescales of ∼ 2 − 5 Gyr (Haines et al. 2015; Paccagnella et al. 2016).
These results point to ram pressure as a compelling pro-cess to explain the high passive fractions and shorter quench-ing timescales in cluster environments. Recent hydrodynamical simulations of individual galaxies show that ram pressure is an efficient gas stripping and quenching mechanism up to ∼ 1 virial radius of the cluster (Tonnesen & Bryan 2009). Furthermore, models indicate that the cold gas component of the interstellar medium (ISM) is stripped outside-in, forming truncated discs with bent shapes in the z-plane and long tails of stripped gas.
This phenomenon happens already in the very early phases of the stripping process, on timescales of 20 – 200 Myr (Roedi-ger & Hensler 2005). The recent observation of several late-type galaxies with long tails of gas without associated streams of old stars at large cluster-centric distances corroborate this scenario (e.g. Yagi et al. 2010; Scott et al. 2012; Fossati et al. 2012, 2016). These observations have shown that most of the gas, in particular that loosely bound to the potential of the galaxy in the outer disc, is stripped on very short timescales (∼ 100–200 Myr; Boselli et al. 2006). Detailed studies of individual objects in clusters are therefore fully complementary to statistical stud-ies for understanding the physics of the mechanisms operating in clusters of galaxies. However, only a few studies attempted a reconstruction of the age of the stellar populations in local ram pressure stripped galaxies (see e.g. Crowl & Kenney 2008; Pap-palardo et al. 2010; Merluzzi et al. 2016). More recently, Fritz et al. (2017) has presented an analysis of the star formation his-tories in a ram pressure stripped galaxy observed with the MUSE integral field unit from the GAs Stripping Phenomena (GASP) survey. This galaxy has a truncated ionised gas disc typical of stripped objects. However, their non-parametric fitting code has a limited age resolution (two age bins in the last 500 Myr), and is therefore not sensitive to recent and rapid quenching events. In summary, the variable quality of the datasets and of the analysis method has so far hampered a complete, spatially resolved view of how fast the quenching proceeds at different galactocentric radii.
In this work we present the analysis of the quenching timescales in NGC 4330, a spiral edge-on galaxy in the Virgo cluster. Deep Hα narrow-band (NB) observations have been re-cently taken for this galaxy as part of pilot observations for the Virgo Environmental Survey Tracing Ionized Gas Emission (VESTIGE; P.I. A. Boselli). VESTIGE is a large programme which has been allocated 50 nights of observing time at the Canada-France-Hawaii Telescope (CFHT) with the aim of cov-ering the central 104 deg2of the Virgo cluster (up to 1 r
vir) with
sensitive Hα and r-band observations. We refer the reader to Boselli et al. (2018, Paper I) for a full description of the sur-vey. These observations have revealed a low surface brightness, extended, one-sided tail of ionised gas being removed from the galaxy disc. This feature, combined with the truncated Hα, HI,
and CO morphologies compared to the extent of the stellar disc, unambiguously points to ram pressure stripping as the mecha-nism responsible for the quenching of the star formation activity in NGC 4330 (Chung et al. 2007; Abramson et al. 2011; Lee et al. 2017). That the quenching process is still ongoing, coupled with the edge-on morphology, made this galaxy an ideal candi-date for studies of the quenching timescale as a function of the galactocentric radius. The first attempt to reconstruct the radial truncation of the star formation history of NGC 4330 was pre-sented by Abramson et al. (2011). These authors used a combi-nation of UV and optical colours, coupled with stellar population models to derive an estimate of the quenching times out to 8 kpc from the galaxy centre. In this work, we extend their analysis by exploiting the excellent multiwavelength photometric coverage of the Virgo cluster and using high spatial resolution data from the far-UV (FUV) to the far-IR (FIR). Furthermore, we comple-mented this dataset with deep medium-resolution optical spec-troscopy to obtain the best constraints on the quenching times in the periphery of the disc (out to 10 kpc) where the star formation activity has ceased completely.
In this paper we use a novel spectrophotometric fitting method which uses Monte Carlo techniques to sample the pa-rameter space. This method is coupled with state-of-the-art
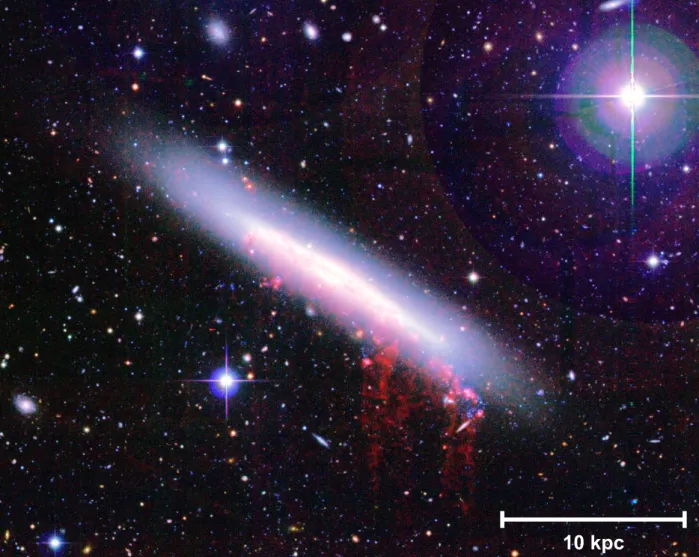
mod-10 kpc
Fig. 1. Pseudo-colour image of NGC 4330 obtained from CFHT NGVS broad-band and VESTIGE narrow-band images. The Hα net emission is shown as the red channel of the image. A faint tail of ionised gas trails downstream of the galaxy while it is travelling towards the NW. The image is oriented such that north is up and east is left. A physical scale of 10 kpc is shown by the white segment.
els for the growth and quenching of disc galaxies as a function of radius. We test our new code by comparing it with the results from CIGALE (Noll et al. 2009), a fitting code which has al-ready been used to characterise the quenching histories of galax-ies in cluster environments (Boselli et al. 2016b). In section 2, we present the target galaxy and the photometric and spectroscopic data we use in this paper, and in section 3 we describe the prop-erties of the Hα tail discovered by the VESTIGE observations. We introduce the codes and the models used to reconstruct the star formation histories in section 4, and we present our results in section 5. In section 6 we discuss those results in the context of a ram pressure stripping scenario in local galaxy clusters and we summarise our conclusions in section 7.
Similarly to other papers in this series, magnitudes are given in the AB system (Oke 1974) and we assume a flatΛCDM Uni-verse withΩM = 0.3, ΩΛ = 0.7, and H0 = 70 km s−1Mpc−1.
With the adopted cosmology and assuming a distance of 16.5 Mpc to the Virgo cluster (Gavazzi et al. 1999; Mei et al. 2007; Blakeslee et al. 2009), 1” on the sky corresponds to a physical scale of 80 pc. Where necessary, we adopt a Chabrier (2003) initial mass function.
2. NGC 4330
NGC 4330 (VCC 630) is a highly inclined (84 deg), intermedi-ate mass (M∗' 109.7M , Boselli et al. 2016b) Scd galaxy in the
Virgo cluster located at a projected distance of ' 600 kpc (0.4 × rvir) from M87. Spatially resolved radio observations made
with the Very Large Array in C+D configuration have revealed the presence of a long tail of HIgas (Chung et al. 2007) on the
trailing side of the interaction, pointing in an opposite direction with respect to M87. The tail also hosts some young star forming regions (visible as the blue knots in Figure 1) which were first noted in the optical, UV, and Hα+ [NII]1images by Abramson
et al. (2011), and later confirmed in deeper GALEX/FUV and optical NGVS images by Boissier et al. (2012). Similar features have also been found in other ram pressure stripped tails (Fu-magalli et al. 2011; Fossati et al. 2012; Fu(Fu-magalli et al. 2014), although the physical conditions leading to their presence or ab-sence in stripped tails are still poorly understood. Another pe-culiar morphological feature is represented by a truncated and asymmetric disc in the young stellar populations revealed by Hα and UV images, compared to the more extended and symmet-ric disc seen in older stellar populations (Abramson et al. 2011).
1 Hereafter, we refer to the net Hα+ [NII] image simply as Hα, unless
−10 −5 0 5 10
∆
δ
(kp
c)
CFHT Hα
GALEX FUV
−10 −5 0 5 10∆
δ
(kp
c)
CFHT u
∗CFHT r
−10 −5 0 5 10∆α (kpc)
−10 −5 0 5 10∆
δ
(kp
c)
IRAC 3.6µm
−10 −5 0 5 10∆α (kpc)
PACS 100µm
Fig. 2. Multifrequency images of NGC 4330 at their intrinsic resolution. From the top left to the bottom right: CFHT/VESTIGE Hα, GALEX FUV, CFHT/NGVS u∗, CFHT/VESTIGE r, Spitzer/IRAC 3.6 µm, and Herschel/PACS 100 µm. All the images are on the same scale and are
oriented such that north is up and east is left. The red contours are drawn from the r-band image at the 22nd, 23rd, and 25th mag/arcsec2and
clearly highlight the different amount of disc truncation at different wavelengths. The presence of a tail extending to the SW is clear in the FUV image.
Figure 2 presents images of NGC 4330 in six photometric bands from the FUV to the FIR. The details of the observations are de-scribed in Section 2.1 and 2.2. The red contours are drawn from the r-band image at the 22nd, 23rd, and 25th mag/arcsec2and
clearly highlight the different extension of the disc at different
wavelengths. It is interesting to note how the dust disc (as traced by the Herschel/PACS map) is truncated at the same radius as the youngest stars (traced by the Hα image), as first found by Cortese et al. (2010).
Recently Lee et al. (2017) presented high-resolution CO maps of NGC 4330 revealing an asymmetric CO morphology which closely coincides with the location of the Hα emission. However, the UV emission is more extended than the molecular gas distribution, which suggests a recent and rapid quenching of the star formation activity occurred during the stripping of all the gaseous components from the outer regions of NGC4330.
Vollmer et al. (2012) presented a ram pressure stripping model of NGC4330 tailored to reproduce the observed morphol-ogy and extension of different stellar populations. This model suggests that the stripping occurs almost face-on (the angle be-tween the galaxy’s disc and the wind direction is 75 deg) and the peak of the stripping force has not yet been reached. The best fit to the observations is obtained ∼ 100 Myr before the peak of stripping is reached. This explains the significant star forma-tion activity in the galaxy centre where the quenching has not yet been effective.
2.1. VESTIGE photometry
In order to detect low surface brightness features in the Hα emis-sion, we selected NGC4330 as one of the highest priority targets for VESTIGE pilot observations. The observations were carried out in April 2016 using MegaCam at the CFHT with the NB filter (MP9603) and the broad-band r filter (MP9602). The ob-serving strategy is described in detail in Boselli et al. (2016a) and in Paper I. In brief, we observed a sequence of seven offset pointings where the large dithers are ideal for minimising the re-flection of bright stars in the stacked images. The exposure times of individual NB and r-band frames were 660s and 66s respec-tively. Each sequence was repeated three times for total integra-tion times of 13860s and 4620s in the two filters, respectively. The observations were taken in excellent weather conditions un-der photometric skies and with a median seeing FWHM ' 0.62" and 0.65" in the NB and r-band filter, respectively.
The data have been reduced using the Elixir-LSB package (Ferrarese et al. 2012), a data reduction pipeline optimised to enhance the signal-to-noise ratio of extended low surface bright-ness features by removing the instrumental background and scat-tered light from the science frames. This is obtained by jointly reducing a sequence of concatenated science exposures, which we obtained using specifically designed dither patterns. The pho-tometric zero points were tied to Pan-STARRS photometry for both filters with a final photometric uncertainty of ∼ 2 − 3% (see Paper I for the colour transformations used). The image stacking and astrometric registration are performed using the MegaPipe procedures (Gwyn 2008).
The Hα image is obtained by subtracting the stellar contin-uum from the NB image, thus leaving only the nebular line con-tribution. The details and calibrations of this procedure will be described in a forthcoming paper (Fossati et al. in preparation). Here we briefly summarise the main steps. The continuum image is obtained by scaling the r-band image to take into account the difference in central wavelength of the two filters. Because the slope of the stellar continuum spectrum can be estimated from an optical colour we include a colour-term (g − r) in the trans-formation, which we calibrated extracting synthetic magnitudes from the spectra of 50,000 stars taken from SDSS. For each pixel we apply the equation
N Bcont= mr− 0.1713 × (mg− mr)+ 0.0717, (1)
where all the variables are expressed in AB magnitudes in the CFHT filters. To limit the surface brightness uncertainty due
to the subtraction of the images we apply a median 3x3 pixel smoothing in the N Bcont image for all the pixels which have a
signal-to-noise ratio below 10. The native spatial resolution is kept in the other pixels. Lastly, we subtract the N Bcont image
from the NB image and we multiply the pixel monochromatic flux densities by the filter width (106 Å) in order to obtain the values of the line flux per pixel. Although in principle the r-band flux includes the line emission, this is dominant only in regions with high line equivalent width (EW>500). Using a sample of SDSS spectra we derived an iterative method to correct for this effect. However, for this galaxy the Hα EW is relatively high only in the tail region where the emission line flux does not show any underlying continuum. There, the Hα EW is highly uncer-tain due to the faintness of the emission and the non-detection in the r-band filter. For this reason, and after testing that the derived Hα flux does not change if the correction is applied, we decided not to apply any correction.
2.2. Ancillary photometry
NGC4330 has been observed across the electromagnetic spec-trum in 20 bands from the FUV to the FIR. Deep FUV and near-UV (Nnear-UV) observations were taken with the Galaxy Evolution Explorer (GALEX, Martin et al. 2005) in 2007 (Programme 79, Cycle 1) with an exposure time of 17000s in both bands. The data were processed with the GALEX pipeline and were down-loaded from the database of the GALEX Ultraviolet Virgo Clus-ter Survey (GUViCS, Boselli et al. 2011). The typical spatial resolution element is FWHM ∼ 5”.
Optical images in the u, g, i, z broad bands were taken at CFHT as part of the Next Generation Virgo Cluster Survey (NGVS, Ferrarese et al. 2012). The data were reduced with the Elixir-LSB pipeline and the photometric zero points were tied to SDSS photometry, as was done for the VESTIGE data. The typical FWHM is ∼ 0.55” in the i band and ∼ 0.8” in the other bands.
Near-infrared H-band observations were taken at the Calar Alto 2.2m telescope by Boselli et al. (2000) with a typical FWHM of ∼ 2”. We re-calibrated the images by tying the flux counts to 2MASS photometry converted to AB magnitudes.
Deep Spitzer (Werner et al. 2004) images were taken with the IRAC (Fazio et al. 2004) instrument at 3.6, 4.5, 5.8, 8.0 µm and with the MIPS (Rieke et al. 2004) instrument at 24 and 70 µm during the cryogenic mission (PI J.Kenney, Programme 30945). The data were downloaded from the Spitzer Heritage Archive. Because multiple observations were available, we resampled and combined them onto a common grid using the Swarp software (Bertin et al. 2002). The mean FWHM of IRAC observations ranges from 1.6” to 2.0” from channel 1 to 4, while MIPS 24 µm images have an image quality of ∼ 6”. We do not use MIPS 70 µm images in our analysis because of their poor spatial resolu-tion (FWHM ∼ 18”).
Far-infrared observations of NGC4330 were carried out by the Herschel Virgo Cluster Survey (HeViCS Davies et al. 2010), a programme that covered ∼ 60 deg2of the Virgo cluster using the PACS (Poglitsch et al. 2010) instrument at 100 and 160 µm, and the SPIRE (Griffin et al. 2010) instrument at 250, 350, and 500 µm. These data were integrated into the Herschel Reference Survey (HRS, Boselli et al. 2010), and the data reduction was carried out as described in Ciesla et al. (2012) and Cortese et al. (2014). The FWHM of PACS observations is 7” and ∼ 12” at 100 and 160 µm, respectively, while the FWHM of SPIRE ob-servations is ∼ 18”, ∼ 25”, and ∼ 36” at 250, 350, and 500 µm,
respectively. Because of the poorer spatial resolution of PACS 160 µm and of the three SPIRE bands, we do not use these data in this work. In conclusion, 15 photometric bands contribute to our dataset, each selected for excellent depth and image quality. 2.3. Long-slit spectroscopy
In order to derive reliable quenching times in the low sur-face brightness outskirts of NGC4330, it is essential to cou-ple photometry with optical spectroscopy covering from the Balmer break to the Hα line. The edge-on morphology of NGC4330 makes it ideal for long-slit spectroscopy observations. We obtained director discretionary time observations under pro-gramme 298.B-5018A (PI A. Boselli) with the FOcal Reducer and low dispersion Spectrograph (FORS2; Appenzeller et al. 1998) mounted on UT1 of the ESO Very Large Telescope.
NGC4330 was observed in long-slit spectroscopy (LSS) mode on 26-27 January 2017. Observations were conducted un-der clear skies and in good seeing conditions (FWHM= 0.7”). The slit was aligned along the photometric major axis (Figure 5, red rectangle). With a length of 6.80, the FORS2 slit is ideal
for covering the full extent of the galaxy. We used a slit aper-ture of 1.3” to optimise the covered area without compromis-ing the spectral resolution. We obtained six exposures of 900s each using the 600B+22 grism which covers the wavelength range 3300 – 6210 Å, and three exposures of 900s each us-ing the 600RI+19 grism coverus-ing the wavelength range 5120 – 8450 Å. Both grisms have a resolution at the central wave-length R ∼ 1000. The longer exposure time in the blue grism arises from our need to obtain a good signal-to-noise ratio at λ < 4500Å despite the use of the red-optimised MIT detector mosaic, which is the only one available for Service Mode obser-vations.
The raw frames were reduced with the ESO/FORS2 pipeline (v5.5.1), which includes bias subtraction, spectroscopic flat fielding, and flux and wavelength calibration. Flux calibration curves were derived from twilight observations of the spec-trophotomeric standards Feige66 and GD108 in both grisms. To reduce the flux calibration uncertainty which can arise from a variety of sources (e.g. sub-optimal centring of the star in the 5” slit aperture, differential sky extinction between standard and science observations), we averaged the response curves obtained from each standard star. Because the FORS2 pipeline is not opti-mised for very extended objects we did not use it to subtract the sky background. Instead we carefully selected two regions on both sides of the slit, at 16 kpc from the galaxy centre where the galaxy flux is negligible (from the inspection of the deep NGVS gand i images). We used the IRAF Background task to subtract a sky spectrum from each spatial element in the 2D spectrum. Lastly, we resampled each 2D spectrum to a common grid (in pixels of 1.25Å and 0.25 arcsec) and we combined the single exposures from both grisms using median statistics to optimally suppress cosmic rays. We describe in Section 4.1 how 1D spectra are extracted along the slit.
3. The H
α
tailPrevious shallow Hα observations (Abramson et al. 2011) re-vealed a bent and strongly truncated Hα disc with high sur-face brightness knots extending in the south-west direction and suggestive of an ionised gas tail. The depth of our VES-TIGE imaging observations revealed such a tail extending up to 10 kpc (projected distance) from the galaxy disc. This
fea-ture is faint, and has a typical surface brightness of (3 − 5) × 10−18erg cm−2s−1arcsec−2. We highlight the low surface
bright-ness Hα features in Figure 3 (left panel).
The HIcontours shown in Figure 3 suggest that the Hα has a
similar extension to that of the HItail (which possibly extends
further to the S and W). However, at the ∼ 2 kpc resolution of HIobservations we conservatively note that the extension of
the tails in these two gas phases is strikingly similar. The right panel of Figure 3 shows the FUV emission from young stars with superimposed Hα contours. As already noted in Figure 2, the Hα disc is more truncated along the galaxy major axis than the FUV disc, a feature generally interpreted as an indication of re-cent quenching of the star formation activity (Boselli et al. 2006; Abramson et al. 2011). Moreover, we note that even where we find extraplanar FUV emission (in the HItail region) this is more
concentrated in the N direction than the ionised gas which ex-tends downstream towards the south. The tail hosts recent mas-sive star formation from which ionised gas is stripped further south.
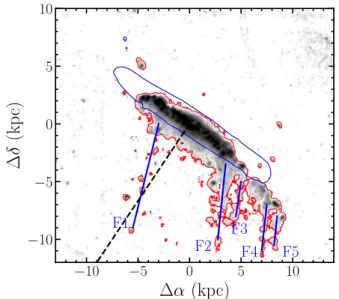
To quantify the amount of stripped ionised gas we divide the galaxy in two regions. The one associated with the stellar disc is defined as being inside the blue contour shown in Figure 4, and it is drawn from the r-band image at the 23rd mag/arcsec2.
This choice, although arbitrary, corresponds to the high surface brightness Hα emission and covers the galaxy disc without ex-tending to the faint stellar halo visible in Figure 1. The Hα flux outside this region is though to come from the stripped gas. Inside the disc we measure f (Hα+ [NII])disc = (2.7 ± 0.1) ×
10−13erg s−1, while in the tail we measure f (Hα+ [NII]) tail =
(0.53 ± 0.21) × 10−13erg s−1. The flux in the tail accounts for 16%
of the total flux, and is dominated by a few bright star forming knots.
The Hα tail is clearly more prominent in the direction of the HItail; we quantify this asymmetry by separately computing the
Hα+ [NII] flux to the E and the W of the black dashed line in Figure 4. We find that the flux on the eastern side of the tail is 1/5 of the flux on the other side. Using numerical simulations, Vollmer et al. (2012) interpreted this asymmetry as evidence that the galaxy is not travelling face-on through the wind; a small deviation (∼ 15 deg) from a face-on wind can cause the observed Hα spatial distribution.
It is interesting to note that the tail morphology, while com-pact immediately downstream of the inner regions of the galaxy, is made of several filamentary structures further south. We show five clear filaments in Figure 4 which are highlighted with blue segments and are labelled F1 to F5 from E to W. The position angles (PA) of these filaments, measured anticlockwise from N through E, are 165, 174, 171, 173, 173 deg respectively from F1 to F5. The direction of the filaments is probably the best indica-tor of the current direction of the galaxy through the ICM and the average PA= 171 deg indicates that the galaxy is travelling al-most perfectly towards the north in the Virgo potential. At larger distances downstream of the wind, the filaments appear to shred into gaseous blobs which might be a signature of a rapid mixture of the ionised gas with the hot ICM. The direction of motion of NGC 4330 within the hot ICM, as derived from the PA of the Hα filaments, is in good agreement with other determinations from either the numerical simulations of Vollmer et al. (2012) or the estimate from the radio deficit region of Murphy et al. (2009).
Fumagalli et al. (2014), Fossati et al. (2016), and Consolandi et al. (2017) presented ram pressure stripped Hα tails extend-ing tens of kpc from the galaxy disc. Integral field spectro-scopic observations revealed that the ionisation of those tails cannot be explained solely by photoionisation. The line ratios
−10 −5 0 5 10
∆α (kpc)
−10 −5 0 5 10∆
δ
(kp
c)
CFHT Hα
−10 −5 0 5 10∆α (kpc)
GALEX FUV
Fig. 3. Left panel: CFHT/VESTIGE Hα image of NGC4330 smoothed at ∼ 2.5” resolution. The colour cuts are selected to highlight the low surface brightness features. The red contour is at 3 × 10⁻¹⁸erg cm−2s−1arcsec−2. The blue contours are from HIobservations obtained with the
Very Large Array in C+D configuration, with a beam size (shown in the lower left corner) of ∼ 2 kpc (Chung et al. 2009). The contour levels are at Σ(HI)= 2, 16, 128, 256 ×1019cm−2. Right panel: GALEX FUV image of NGC4330 with Hα contours at 3, 15, 125 × 10−18erg cm−2s−1arcsec−2.
The Hα disc is truncated to a smaller radius compared to the FUV emission, while the Hα extraplanar emission is more extended to the S.
−10 −5 0 5 10
∆α (kpc)
−10 −5 0 5 10∆
δ
(kp
c)
F1 F2 F3 F4 F5Fig. 4. CFHT/VESTIGE Hα image of NGC4330 shown in Figure 3. The blue contour is drawn from the r-band image at the 23rd mag/arcsec2
and identifies the region of the galaxy disc. In the text we refer to the Hα flux inside this region as the disc flux, and we refer to the Hα flux outside this region as the stripped flux in the tail. The black dashed line marks the separation between the upturn region (E of the centre) and the HItail region (W of the centre). Five filaments of stripped gas are highlighted with blue segments and labelled F1 to F5 from east to west.
are indeed LINER-like, which indicates turbulence, magneto-hydrodynamic waves, and thermal conduction with the hot ICM as possible ionisation mechanisms. In contrast, the tail of NGC 4330 is shorter, more filamentary, and clumpy. These features resemble the magneto-hydrodynamic simulations pre-sented by Ruszkowski et al. (2014). These authors find that the stripped filaments can be strongly supported by magnetic
pres-sure and, if this is the case, the magnetic fields vectors tend to be aligned with the filaments. Deep spectroscopic observations of the stripped gas revealed by VESTIGE should be obtained to clarify whether this peculiar morphology is an indication of a different ionisation source, possibly involving strong magnetic fields.
4. Stellar population fitting
In this section we describe a novel method for accurately constructing the quenching history of NGC4330 in various re-gions along the major axis by means of stellar population fitting. We make use of two independently developed codes. The first performs a joint fitting of spectra and photometry using Monte Carlo techniques to optimally explore the parameter space and the second code fits only the photometric data points plus the in-tegrated flux in the Hα line, as first introduced in Boselli et al. (2016b).
4.1. Aperture photometry
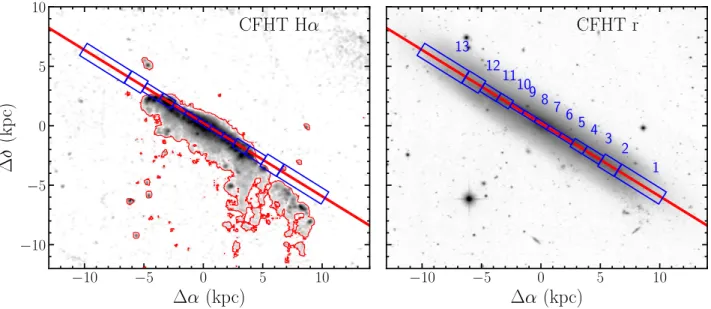
We divided the emission from NGC4330 into 13 apertures along the major axis, as shown in Figure 5 (blue rectangles). The re-gion IDs increase from right to left. The distance from the cen-tre and the width of each region along the major axis are given in Table 1. In the inner parts of the galaxy there is a signifi-cant structure which is clearly visible in most of the bands. This leads to spatial variation in colour due to the patchy dust ex-tinction. In order to derive a reconstruction of the stellar popu-lations which is not biased by these effects we used apertures of 5” width along the minor axis. On the other hand, while moving towards the outskirts of the galaxy we witness a smoother struc-ture perpendicular to the major axis (because the gas and dust are almost completely stripped). In these regions we increased the aperture widths to 10” and 15” to preserve a high signal-to-noise ratio with decreasing stellar surface brightness. Since we
−10 −5 0 5 10
∆α (kpc)
−10 −5 0 5 10∆
δ
(kp
c)
CFHT Hα
−10 −5 0 5 10∆α (kpc)
CFHT r
5 6 7 8 9 3 4 10 11 1 2 12 13Fig. 5. Left panel: CFHT/VESTIGE Hα image of NGC4330 smoothed at ∼ 2.5” resolution. The red contour is at 3 × 10⁻¹⁸erg cm−2s−1arcsec−2.
Right panel: CFHT/VESTIGE r-band image of NGC4330. In both panels we highlight the position and the extension of the VLT/FORS2 long slit in red, and the regions in which we performed the aperture photometry in blue. In the right panel we also show their ID, as defined in the text. The photometric regions have a width along the minor axis of 5” in the inner part of the galaxy in order to minimise the mismatch with the spectrum due to differential stellar populations or dust extinction. Going towards the outskirts of the galactic disc we increase the width to 10”, and 15” to preserve the signal-to-noise ratio with decreasing stellar surface brightness.
Region Rmaj(kpc) Lmaj(”) Lmin(”)
1 10.1 55 15 2 7.0 20 15 3 5.3 20 10 4 3.8 15 10 5 2.5 15 5 6 1.2 15 5 7 0.0 15 5 8 -1.2 15 5 9 -2.5 15 5 10 -3.8 15 10 11 -5.3 20 10 12 -7.0 20 15 13 -10.1 55 15
Table 1. Distance from the galaxy centre measured along the major axis (negative values are towards the east with respect to the photometric centre) and linear sizes for each region in which we extract aperture photometry and slit spectra.
are mostly interested in deriving stellar population parameters in the outer regions where the quenching of the star formation is complete, the larger apertures ensure that the photometry itself is only marginally affected by beam smearing even in the images with the poorer spatial resolution (FUV, PACS).
It should also be noted that, due to the high inclination of the galaxy, points perpendicular to the major axis which are at small projected distances from the major axis are physically lo-cated at a larger distance. Therefore, by choosing apertures of relatively small width, we ensure that the observed flux mostly comes from the semi-major axis distance chosen. At large radii
this problem becomes less severe; therefore, we can confidently use larger apertures while keeping the contamination from dif-ferent radii to the minimum.
Aperture photometry is obtained by summing the calibrated flux values in each pixel contributing to a given aperture minus the background value in the same aperture. To estimate the back-ground we randomly place each aperture in empty regions of the images and we take the sum of the counts. This procedure is repeated 1,000 times; we then take the median value as the best estimator for the background value. For the UV, optical, and near infrared bands, we corrected the measured fluxes for the Galactic attenuation. We assumed the Fitzpatrick (1999) Galactic attenu-ation curve, and a value of E(B − V) = 0.021 obtained from the dust map by Schlegel et al. (1998) with the recalibration of Schlafly & Finkbeiner (2011) at the position of NGC4330.
The uncertainty on the fluxes is obtained as the quadratic sum of the uncertainty on the background (rms of the bootstrap iterations) and the uncertainty on the flux counts. For photon-counting devices (all the bands except for PACS), the uncertainty on the flux counts is estimated assuming a Poissonian distribu-tion for the source photons; for PACS images we use the RMS maps distributed by the data reduction pipeline and we estimate the source uncertainty by computing the flux at fixed background level in 100 replications of the flux map, each randomly per-turbed with a Gaussian uncertainty taken from the RMS map. As a last step, the fluxes from each band are converted into mJy. We extract the spectra from the FORS2 reduced 2D spectral images by summing the flux in the spatial pixels contributing to each region along the slit direction.
4.2. Unperturbed and quenched star formation histories In order to reconstruct the quenching history of each radial bin of NGC4330 we need to model its unperturbed radial star forma-tion history (SFH). We use the multizone models for the
chemi-cal and spectrophotometric unperturbed disc evolution originally presented in Boissier & Prantzos (2000) and later updated in Muñoz-Mateos et al. (2011).
These models were originally calibrated in the Milky Way in Boissier & Prantzos (1999). They were later generalised to reproduce the properties of nearby spiral galaxies in Boissier & Prantzos (2000)). This generalisation was made in the simplest possible way, by introducing scaling relationships inspired by the analytical modes of Mo et al. (1998). As a result, the bary-onic mass scales as the rotational velocity V to the power 3, the scale-length as the product of the rotational velocity and the spin parameters (λ). The star formation law is fixed to that observed in Boissier et al. (2003) in the latest version of these models. The accretion history was chosen to reproduce observational trends (early formation of the dense part and of massive galaxies; late accretion for low-density regions and low-mass galaxies). These models have also been successfully used to interpret the radial light profiles of galaxies in dense environments in order to iden-tify the main quenching mechanism (see e.g. Boselli et al. 2006). The models have two free parameters: the spin parameter λ and rotational velocity Vcirc. The value of the former ranges
from ∼ 0.02 for compact spiral galaxies galaxies to ∼ 0.09 for low surface brightness objects (Boissier & Prantzos 2000). In this work we adopt λ = 0.05, consistently with previous works on intermediate mass Virgo galaxies (e.g. Boselli et al. 2006). The rotational velocity instead is 120 km s−1from HI
observa-tions (Chung et al. 2009). However, this galaxy shows a trun-cated HI disc; therefore, the measured maximum rotational
ve-locity might be lower than the real value. As a test we indepen-dently derive the rotational velocity from the baryonic Tully– Fisher relation presented by Lelli et al. (2016). Using a stellar mass of 109.8M
and the HImass-to-stellar mass scaling relation
from Gavazzi et al. (2013), we estimate a total baryonic mass Mb = 1010.02M , which in turn implies a maximum rotational
velocity of 123 km s−1, in good agreement with the measured value from HIdata.
The SFH model is axisymmetric around the disc rotation axis and is produced in discrete radial bins with roughly 1 kpc step. Therefore, we needed to project it to fit the high inclination of the disc of NGC 4330 and derive the SFH in each of the apertures defined in Section 4.1. We assume a width along the minor axis of 5” for each aperture. At large galactocentric radii, where the photometric apertures are larger, we verified that there is no clear structure in the flux distribution perpendicular to the major axis. Moreover, at those large radii, the variation in deprojected radius of each pixel contributing to the aperture is small (i.e. all the pixels are at large deprojected radii), which motivates our choice of a single aperture for the model extraction.
The model extraction is performed as follows. First, we in-terpolate the SFH at each discrete radius to obtain SFHs which run from 0 to 13.5 Gyr in 1 Myr steps. Then we define the galaxy as a round disc in pixels of 0.5 x 0.5 kpc, and we populate each bin with a SFH obtained by interpolating the radial bins derived above. Finally, we project the model galaxy with the inclination of NGC4330 and we sum the SFHs from each pixel contributing to each of the apertures in order to obtain a set of light-weighted SFHs.
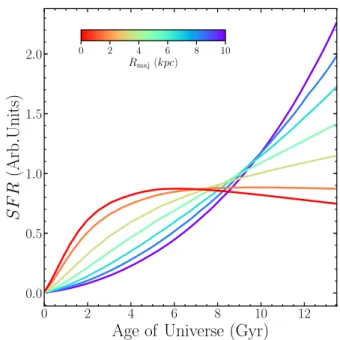
Figure 6 shows the unperturbed star formation histories for regions from 1 (blue) to 7 (red). Each SFH has been normalised to produce 1 M yr−1to highlight the variations in shape despite
the differences in star formation surface density. Moving from the galaxy nucleus to the outskirts, the SFH gradually moves to more recent ages. Within this model, the bulk of the mass in the nucleus formed 5 − 8 Gyr ago, while at recent times the growth
0 2 4 6 8 10 12
Age of Universe (Gyr)
0.0 0.5 1.0 1.5 2.0
S
F
R
(Arb
.Units)
0 2 4 6 8 10 Rmaj(kpc)Fig. 6. Unperturbed star formation histories for regions numbered from 1 (blue) to 7 (red) in Table 1. Each SFH has been normalised to produce 1 M yr−1to highlight the variations in shape despite the differences in
star formation surface density. The colour of each line corresponds to the distance in kpc of each region from the galaxy centre, as shown by the colour-bar.
is mainly taking place at large radii. This pattern is consistent with observations of galaxies of similar mass, most notably the Milky Way, as inferred from the reconstruction of star formation histories as a function of galactocentric radius from APOGEE spectroscopic maps (Martig et al. 2016).
Similarly to Boselli et al. (2016b), we further modify the unperturbed SFHs by introducing an exponential decline in the SFR to parametrise the quenching event. The choice of an expo-nential quenching pattern is motivated by the fact that while gas is stripped from a given region of the galaxy, the star formation activity should decline exponentially for a constant star forma-tion efficiency in order to satisfy the local Kennicutt–Schmidt re-lation (Schmidt 1959; Kennicutt 1998). Moreover, this function allows a great range of flexibility and it can model an almost in-stantaneous and complete quenching event, as well as a marginal and gradual suppression of the star formation activity. The final star formation histories are defined as
S FR(t)=(S FRunpert.(t) if t < t0− QAge
S FRunpert.(t0− QAge) × e(t0−QAge−t)/τQ if t ≥ t0− QAge
, (2) where S FRunpert.is the star formation history derived above, t0=
13.5 Gyr is the current epoch, QAgeis the look-back time for the
start of the quenching event, and τQis the exponential timescale
of the quenching.
4.3. Spectro-photometric fitting with MultiNest
One of the methods that we use to reconstruct the quench-ing histories in NGC4330 is to fit parametric models to the spectro-photometric data using MultiNest (Feroz & Hobson 2008; Feroz et al. 2009, 2013), an implementation of the nested sampling algorithm described by Skilling (2004). We refer to
10−1 100 101 102 103 λ [µm] 105 106 107 108 λ Lλ [L ] 1.5 2.0 2.5 3.0 3.5 fλ [10 − 16 erg s − 1cm − 2˚ A − 1] Region 2 4000 4500 5000 5500 6000 6500 λ [˚A] −0.1 0.0 0.1 0 100 200 300 400 500 600
Lookback Time [Myr] 0.0 0.2 0.4 0.6 0.8 1.0 1.2 S F R [Ar b. U nit ] Qfac= 0.97+0.01−0.01 140 160 180 200 QAge[Myr] 35 40 45 50 55 60 65 τQ [Myr]
Fig. 7. Results of the MC-SPF fitting for region 2. Upper panel: FORS2 spectrum (black) and best fit model (dark red). Regions where the spectrum is plotted in grey are not used in the fit. The fit residuals (Data - Model) are shown below the spectrum and the grey shaded area shows the 1σ uncertainties. Lower left panel: Photometric data points in black (1σ upper limits from non-detections are shown as error bars). The blue lines are the stellar emission with nebular lines from the young component (Age<10Myr), the red lines are from the old component (Age>10Myr), and the dark red lines are the total model including the dust emission. Different lines are obtained by randomly sampling the posterior distribution. Lower middle panel: Reconstructed SFH from the fitting procedure. Different lines are obtained from the posterior distribution. The grey dashed line shows the evolution of the unperturbed SFH. Lower right panel: Marginalised likelihood maps for the QAgeand τQfit parameters. The red lines
show the median value for each parameter, while the black contours show the 1, 2, and 3 σ confidence intervals.
this code hereafter as the Monte Carlo Spectro-Photometric Fit-ter (MC-SPF). We start by constructing a grid of stellar spectra using the quenched SFHs defined above coupled to Bruzual & Charlot (2003) high-resolution models. Stellar models are lin-early interpolated in QAge and τQon the fly, and scaled in total
luminosity as part of the fitting procedure.
We added nebular emission lines to the stellar template. To do so we first computed the number of Lyman continuum (λ < 912 Å) photons QH0 for a given stellar spectrum. We
then assumed that all the ionising radiation is absorbed by the gas, i.e. the escape fraction is zero and that the ionising pho-tons do not contribute to the heating of dust. However, we mod-elled the uncertainty in the conversion of QH0into emission line
flux by adding a nuisance parameter (Lyscale) in our MC-SPF
code. This parameter also takes into account differential aperture effects between the 1.3" spectral slit and the larger photomet-ric apertures. In summary, the Hβ luminosity can be written as LHβ= QH0× Lyscale× 4.55 × 10
−13(Osterbrock & Ferland 2006).
Finally, we converted the luminosity into observed Hβ line flux and we obtained the flux in all the other emission lines based on the calculations described by Byler et al. (2017), adopted from the Flexible Stellar Population Synthesis code (FSPS; Con-roy et al. 2009). We used their photoionisation calculations for log(Z/Z )= 0 and log U = −2.0, where Z and U are the
metal-licity and ionisation parameter of the gas respectively, and incor-porated the age of the HII regions as an additional free parameter in the fit. We verified that the final derived SFH parameters are
relatively insensitive to the choice of metallicity and ionisation parameter.
We assumed a double Calzetti et al. (2000) attenuation law to include the effects of dust attenuation on the stellar and nebular emission line spectrum. Stars older than 10 Myr and emission lines arising from them are attenuated by a free parameter of the fit (Aold), while younger stars are attenuated by Aold+Aextra,
where Aextra is a free parameter and is used to model the extra
extinction occurring within the regions of recent star formation. We coupled the stellar spectrum with dust emission models from the mid- to the far-infrared by means of an energy balance be-tween the stellar flux absorbed by the dust and re-emitted in the infrared. We used the models from Dale & Helou (2002) which add one free parameter in our fitting procedure.
We jointly fit the photometric data points and the FORS2 spectra at their native resolution. Multiplicative polynomials are used to remove large-scale shape differences between the models and the spectra. These differences arise from inaccuracies in the determination of the FORS2 response function, uneven illumi-nation across the slit, or imperfect models. Because the FORS2 response function drops below 4000 Å we include in the fit only wavelengths above this value. We also exclude from the fit re-gions which are significantly affected by bright skylines residu-als. The multidimensional likelihood space is sampled by using pyMultiNest (Buchner et al. 2014), a python wrapper for the MultiNest code.
4.4. CIGALE
We tested the SFH reconstruction of our new MC-SPF code against the results of the Code Investigating GALaxy Emission (CIGALE; Noll et al. 2009; Boquien et al. 2016; Ciesla et al. 2016, Boquien et al. in prep.). We made use of the set-up pre-sented in Boselli et al. (2016b) and applied to the HRS sample. In brief, CIGALE uses the same stellar models described above and coupled with the Draine et al. (2014) dust models via the en-ergy balance argument descried above. This code only fits pho-tometric data points; however, Boselli et al. (2016b) presented a procedure to include the Hα observed flux (from spectroscopy or NB imaging) in the fit, linking the observed (dust corrected) Hα luminosity to the number of Lyman continuum photons pro-duced in the stellar models. When this additional constraint is included, the fitting becomes sensitive to the presence (or ab-sence) of the youngest stellar population (age < 10 Myr), which in turn significantly improves the SFH reconstruction for re-cently quenched galaxies (Boselli et al. 2016b). These authors further constrained the fit by means of the strength of Balmer absorption lines obtained from long-slit spectroscopic observa-tions integrated in narrow bandpasses. In this work, we decided not to use the spectral data in the CIGALE fitting, and to con-strain the flux from the youngest stars using the dust corrected Hα luminosity from VESTIGE narrow-band observations, thus to quantify the relative improvement on the quenching age con-straints when a full spectral fitting procedure is performed.
5. Results
We fit the photometry and spectroscopy of all the regions as de-scribed in Section 4.3 in order to accurately quantify the radial quenching history. However, as is clear from Figure 5, for re-gions from 5 to 9 there is ongoing massive star formation ac-tivity. In these regions, the suppression of star formation due to the effects of ram pressure stripping is hard to quantify and the amount of quenching might only be marginal. Moreover, the regions closer to the photometric centre might not be correctly modelled by the SFH models, due to the possible presence of a pressure supported stellar component (bulge). For these reasons we limit our analysis to the outer regions.
5.1. Results from the MC-SPF fitting code
Figure 7 shows the results of the MC-SPF fitting for region 2 using stellar libraries at solar metallicity. In the upper panel the FORS2 spectrum is shown in black, while the best fit model is overplotted as the dark red line. The fit residuals (Data - Model) are shown below the spectrum. In the lower left panel we show the photometric data points in black (1σ upper limits from non-detections are shown as error bars) and the total model (stellar + dust emission) is shown in dark red. The agreement between model and data is very good both in the high-resolution spec-trum and in the photometry from the FUV to the FIR. The same quality of fits is achieved for the other regions we include in the analysis.
The lower middle panel shows the reconstructed SFH from the fitting procedure. We define the quenching factor as the amount of suppression that is needed to achieve the observed SFR today (t0) compared to that predicted by the unperturbed
model:
Qfac= 1 − (S FRpert.(t0)/S FRunpert.(t0)). (3)
For region 2, the star formation activity has been recently (∼ 175 Myr ago) truncated on a very short timescale. The quenching is complete Qfac ∼ 1 and rapid, although not instantaneous, with
the star formation rate being suppressed by more than 70% of its initial value in 50 Myr. Lastly, the lower right panel shows the marginalised likelihood map for the QAgeand τQfit parameters.
The red lines show the median value for each parameter, while the black contours show the 1, 2, and 3 σ confidence intervals. Despite the covariance between QAge and τQ, the SFH after the
onset of quenching is very well constrained thanks to the high-quality dataset available for NGC 4330.
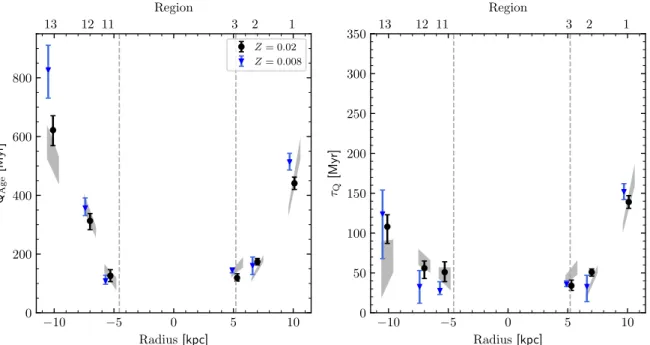
Figure 8 shows the values of QAgeand τQfrom the
marginal-isation of the MC-SPF posterior distribution as a function of galactocentric radius. The black points are from stellar libraries at solar metallicity (Z= 0.02), while the blue triangles are from stellar libraries at subsolar metallicity (Z = 0.008). The points belonging to the same region are shifted along the x-axis for clarity. The grey shaded areas show the range of the derived quenching ages for regions shifted by 1/3 of their length along the major axis. This allows us to test the robustness of the re-sults against the effects of beam smearing of the imaging data and uncertainties on the radial evolution of the model SFH. The vertical dashed lines show the truncation radius of the Hα emis-sion along the major axis; inside these lines there is ongoing star formation activity.
The extreme outskirts of the galaxy on the eastern side (the ‘upturn’ region in Vollmer et al. (2012)) was quenched ∼ 500 − 600 Myr ago. However, QAge/τQ ∼ 4 − 6 implying
that the quenching event was also relatively rapid leaving this region passively evolving for the last ∼ 200 − 300 Myr. Moving towards the centre of the galaxy, we find an outside-in gradient in the quenching age which drops to 100 Myr at the Hα truncation radius, again with a relatively fast quenching event. On the other side of the galaxy (the ‘tail’ region in Vollmer et al. 2012), the quenching of the star formation is more recent (∼ 100–150 Myr ago). In these regions the quenching event was also rapid with 85% of the star formation activity being suppressed in less than 2 × τQ ∼ 100 Myr. A notable exception appears at the largest
radii in the tail region. There we derive higher values of QAge,
in combination with longer exponential quenching timescales. The quenching event might then have started at the same time as on the other side of the galaxy, but then proceeded at a slower rate. In Section 5.2 we describe how this result is robustly de-rived using our fits to the photometry and the spectrum, while a short quenching time cannot be ruled out using photometric data alone.
Inside the truncation radius there is a significant amount of ongoing star formation. In these regions the quenching event might not have started yet or the amount of quenching of the star formation activity might be very small. Therefore, deriving a reliable epoch for the start of the quenching is a difficult or ill-posed question. While we obtain reliable fits for region 10 (on the eastern side of the disc), we find that the constraints on the quenching history parameters are poor for region 4. Moreover our results are very sensitive to the exact position of the aperture with a quenching age that ranges from 200 to 800 Myr when moving the region along the major axis by one-third of its size. This is likely caused by a mismatch between the various photo-metric bands and the emission detected in the FORS2 slit. The high spatial resolution of the CFHT u and r bands (middle panels of Figure 2) shows an inhomogeneous dust obscuration pattern as well as clumpy star formation. All these effects are not taken into account into our fitting procedure, which leads to uncertain
−10 −5 0 5 10 Radius [kpc] 0 200 400 600 800 QAge [Myr] 1 2 3 11 12 13 Region Z = 0.02 Z = 0.008 −10 −5 0 5 10 Radius [kpc] 0 50 100 150 200 250 300 350 τQ [Myr] 1 2 3 11 12 13 Region
Fig. 8. Left panel: Derived quenching age (QAge) as a function of galactocentric radius from the marginalisation of the MC-SPF posterior
dis-tribution. Black points are from stellar libraries at solar metallicity (Z = 0.02). Blue triangles are from stellar libraries at subsolar metallicity (Z = 0.008). The grey error bars show the range of the derived quenching ages for regions shifted by 1/3 of their length along the major axis. The points belonging to the same region are shifted along the x-axis for clarity. The vertical dashed lines show the truncation radius of the Hα emission along the major axis; inside those lines there is ongoing star formation activity. Right panel: same as the left panel, but for the exponential characteristic timescale of the quenching (τQ).
10−1 100 101 102 103 λ [µm] 105 106 107 108 λ Lλ [L ] 0 100 200 300 400 500 600
Lookback Time [Myr] 0.0 0.2 0.4 0.6 0.8 1.0 1.2 S F R [Ar b. U nit ] Qfac= 0.95+0.04−0.03 200 400 QAge[Myr] 0 50 100 150 200 τQ [Myr] Region 2 - CIGALE
Fig. 9. Results of the CIGALE fitting for region 2. The panels are the same as the lower panels of Figure 7, but the fits are obtained from the photometric data only plus a constraint on the number of ionising photons coming from the VESTIGE Hα imaging observations, as first introduced by Boselli et al. (2016b). The red solid lines in the left and middle panels show the CIGALE best fit model and the associated quenching SFH, respectively. The red lines in the right panel show the median value for each parameter, while the black contours show the 1, 2, and 3 σ confidence intervals. The red dot shows the location of the model with the highest likelihood in the QAge, τQplane.
fit parameters. Given the caveats affecting these regions, we do not include them in our results.
We also test the effects of stellar metallicity on the quench-ing history; it has long been known that disc galaxies exhibit on average negative metallicity gradients from the centre to the outskirts (Zaritsky et al. 1994; Rupke et al. 2010). This means that we could expect subsolar metallicity in the stripped regions of NGC4330. Using a stellar library with Z=0.008 we indeed obtain fits of very similar quality to those of the solar metal-licity models. In this case we derive values of QAge, which are
30% higher than those obtained with solar metallicity libraries. At fixed age, lower metallicity stellar populations indeed have a higher optical-UV flux, and an older quenching event is neces-sary to fit the observed photometry and spectroscopy. However, stellar metallicity is not a completely unconstrained parameter. We tested models with Z=0.004 and we obtain poorer fits. In
these cases, the shape of the models cannot be reconciled with FUV and NUV photometry by means of an older QAgeand the fit
increases the amount of dust extinction (which also reduces the slope of the UV spectrum), revealing tension with the MIPS and PACS photometric upper limits. We conclude that the metallic-ity of the outer regions of NGC4330 is between the solar value and half of it, and that this degeneracy does not have a signifi-cant impact on our results on the quenching of the star formation activity.
5.2. Results from the CIGALE fitting code
We now compare the results obtained with our new MC-SPT code with those of the CIGALE code, which has been ex-tensively tested and characterised in the context of recover-ing quenchrecover-ing histories by Boselli et al. (2016b). Because in
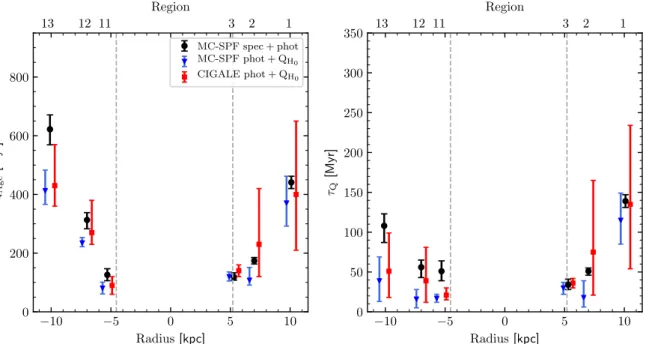
−10 −5 0 5 10 Radius [kpc] 0 200 400 600 800 QAge [Myr] 1 2 3 11 12 13 Region MC-SPF spec + phot MC-SPF phot + QH0 CIGALE phot + QH0 −10 −5 0 5 10 Radius [kpc] 0 50 100 150 200 250 300 350 τQ [Myr] 1 2 3 11 12 13 Region
Fig. 10. Left panel: Comparison of the quenching ages (QAge) as a function of galactocentric radius derived by using different input data into the
MC-SPF and CIGALE fitting codes. Black points are from MC-SPF joint fits to spectra and photometry using stellar libraries at solar metallicity (see also Figure 8). Blue triangles are from MC-SPF fits to the photometric data plus a constraint on the number of ionising photons coming from the VESTIGE Hα imaging observations. Red squares are from CIGALE fits and use the same input data as the blue points. The points belonging to the same region are shifted along the x-axis for clarity. The vertical dashed lines show the truncation radius of the Hα emission along the major axis; inside these lines there is ongoing star formation activity. Right panel: Same as the left panel, but for the exponential characteristic timescale of the quenching (τQ).
CIGALE we only use photometric data points (plus a constraint on the number of ionising photons coming from the VESTIGE Hα imaging observations), we also assess the reduction in the uncertainties on the derived parameters when the spectra are in-cluded in our MC-SPF code.
The CIGALE set-up assumes the Draine et al. (2014) dust models, which have more free parameters than the Dale & Helou (2002) models used in the MC-SPF set-up. With only three pho-tometric points sensitive to the shape of the dust spectrum (IRAC 8 µm, MIPS 24 µm, and PACS 100 µm), it is preferable to fit a simpler family of models, like those from Dale & Helou (2002). However, we are mostly interested in the amount of dust extinc-tion that affects the age sensitive UV and optical data, which we constrain from the luminosity of the dust-reprocessed photons. In this respect, the parameters of the dust models are only im-portant to the extent that they allow enough freedom to robustly assess the amount of dust extinction. We indeed find a very good (1 − 2σ) agreement between the values of AV obtained with the
two codes, and we are confident that the different dust models are not a source of bias for the optical-UV obscuration and therefore for our stellar population results.
Figure 9 shows the results of the CIGALE fitting for region 2. The three panels are the same as the lower panels of Figure 7. In the left panel, the red line is the best fit CIGALE model, with its associated SFH in the middle panel (red line). The other lines in the middle panel are obtained by sampling the posterior like-lihood space. The right panel shows the marginalised likelike-lihood map for the QAge and τQfit parameters. The red lines show the
median value for each parameter, while the red dot shows the lo-cation of the model with the highest likelihood. The median val-ues are remarkably close to those obtained using the MC-SPF code, which indicates that both codes converged to the same
quenching history. However, without the spectral information, the uncertainty on the derived parameters (QAgeand τQ) is much
higher, and the degeneracy between them is much stronger. The presence of multiple Balmer absorption lines in the spectrum in-deed gives us a better sensitivity to intermediate quenching ages (between 100 and 1000 Myr), which is not the case with Hα plus UV and optical broad-band data.
Figure 10 shows the values of QAge and τQand their
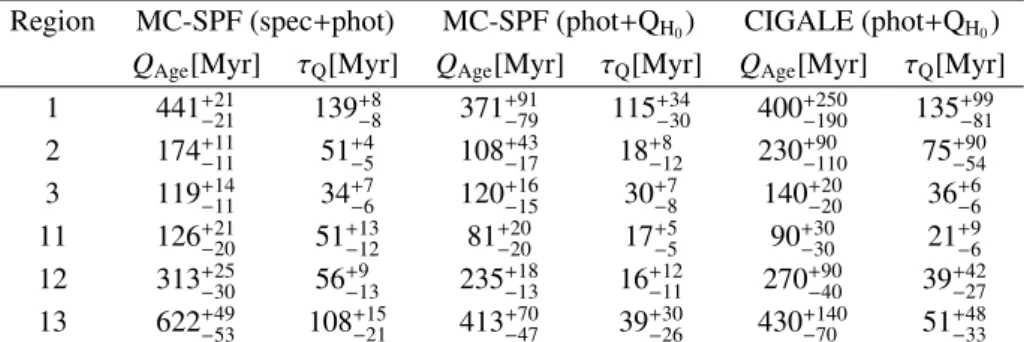
asso-ciated uncertainties as a function of galactocentric radius from three different combinations of fitting code and input data. The black points are the same as in Figure 8 and are obtained from the joint photometry and spectrum fits using the MC-SPF code. The red points are obtained from CIGALE fits to broad-band photometry plus a constraint on the number of ionising pho-tons coming from the VESTIGE Hα imaging observations as described in Boselli et al. (2016b). We recall that CIGALE com-putes the likelihood in a fixed grid that covers the parameter space. From these values we randomly sample the posterior to extract Monte Carlo-like samples weighted by the local likeli-hood. The marginalised distributions in each parameter are then taken from these samples as in the MC-SPF code. Lastly, the blue points are obtained from our MC-SPF code, but giving the same input of CIGALE (broad-band photometry and a constraint on QH0from the Hα imaging observations). Table 2 presents the
values of QAge and τQand their associated uncertainties for the
regions included in the analysis and with the various fitting meth-ods described in this section.
Despite the excellent photometric coverage of the electro-magnetic spectrum from the FUV to the FIR, it is immediately clear that both CIGALE and our MC-SPF code give weaker con-straints on the quenching time when using photometry alone, with a significant degeneracy between QAgeand τQ. This is more