HAL Id: hal-03000032
https://hal.archives-ouvertes.fr/hal-03000032
Submitted on 11 Nov 2020
HAL is a multi-disciplinary open access
archive for the deposit and dissemination of
sci-entific research documents, whether they are
pub-lished or not. The documents may come from
teaching and research institutions in France or
abroad, or from public or private research centers.
L’archive ouverte pluridisciplinaire HAL, est
destinée au dépôt et à la diffusion de documents
scientifiques de niveau recherche, publiés ou non,
émanant des établissements d’enseignement et de
recherche français ou étrangers, des laboratoires
publics ou privés.
A Virgo Environmental Survey Tracing Ionised Gas
Emission (VESTIGE)
A. Boselli, M. Fossati, J. C. Cuillandre, S. Boissier, M. Boquien, V. Buat, D.
Burgarella, G. Consolandi, L. Cortese, P. Côté, et al.
To cite this version:
A. Boselli, M. Fossati, J. C. Cuillandre, S. Boissier, M. Boquien, et al.. A Virgo Environmental Survey
Tracing Ionised Gas Emission (VESTIGE): III. Star formation in the stripped gas of NGC 4254.
As-tronomy and Astrophysics - A&A, EDP Sciences, 2018, 615, pp.A114. �10.1051/0004-6361/201732410�.
�hal-03000032�
Astronomy
&
Astrophysics
https://doi.org/10.1051/0004-6361/201732410© ESO 2018
A Virgo Environmental Survey Tracing Ionised
Gas Emission (VESTIGE)
III. Star formation in the stripped gas of NGC 4254
?
A. Boselli
1,??, M. Fossati
2,3, J. C. Cuillandre
4, S. Boissier
1, M. Boquien
5, V. Buat
1, D. Burgarella
1, G. Consolandi
6,7,
L. Cortese
8, P. Côté
9, S. Côté
9, P. Durrell
10, L. Ferrarese
9, M. Fumagalli
11, G. Gavazzi
6, S. Gwyn
9, G. Hensler
12,
B. Koribalski
13, J. Roediger
9, Y. Roehlly
14, D. Russeil
1, M. Sun
15, E. Toloba
16, B. Vollmer
17, and A. Zavagno
11Aix Marseille Univ, CNRS, CNES, LAM, France
e-mail: [email protected], [email protected], [email protected]
2Universitäts-Sternwarte München, Scheinerstrasse 1, 81679 München, Germany
3Max-Planck-Institut für Extraterrestrische Physik, Giessenbachstrasse, 85748 Garching, Germany
4CEA/IRFU/SAP, Laboratoire AIM Paris-Saclay, CNRS/INSU, Université Paris Diderot, Observatoire de Paris, PSL Research
University, 91191 Gif-sur-Yvette Cedex, France
5Universidad de Antofagasta, Unidad de Astronomía, Avenida Angamos 601, Antofagasta 1270300, Chile 6Universitá di Milano-Bicocca, piazza della scienza 3, 20100 Milano, Italy
7INAF - Osservatorio Astronomico di Brera, via Brera 28, 20159 Milano, Italy
8International Centre for Radio Astronomy Research, The University of Western Australia, 35 Stirling Highway, Crawley
WA 6009, Australia
9NRC Herzberg Astronomy and Astrophysics, 5071 West Saanich Road, Victoria BC V9E 2E7, Canada 10Department of Physiscs and Astronomy, Youngstown State University, Youngstown OH 44555, USA
11Institute for Computational Cosmology and Centre for Extragalactic Astronomy, Department of Physics, Durham University, South
Road, Durham DH1 3LE, UK
12Department of Astrophysics, University of Vienna, Türkenschanzstrasse 17, 1180 Vienna, Austria
13Australia Telescope National Facility, CSIRO Astronomy and Space Science, PO Box 76, Epping NSW 1710, Australia 14Astronomy Centre, Department of Physics and Astronomy, University of Sussex, Falmer, Brighton BN1 9QH, UK 15Physics Department, University of Alabama in Huntsville, Huntsville AL 35899, USA
16Department of Physiscs, University of the Pacific, 3601 Pacific Avenue, Stockton CA 95211, USA 17Observatoire Astronomique de Strasbourg, UMR 7750, 11 rue de l’Université, 67000 Strasbourg, France
Received 4 December 2017 / Accepted 7 March 2018
ABSTRACT
During pilot observations of the Virgo Environmental Survey Tracing Galaxy Evolution (VESTIGE), a blind narrow-band Hα + [NII] imaging survey of the Virgo cluster carried out with MegaCam at the CFHT, we have observed the spiral galaxy NGC 4254 (M99). Deep Hα + [NII] narrow-band and GALEX UV images reveal the presence of 60 compact (70–500 pc radius) star-forming regions up to '20 kpc outside the optical disc of the galaxy. These regions are located along a tail of HI gas stripped from the disc of the galaxy after a rapid gravitational encounter with another Virgo cluster member that simulations indicate occurred 280–750 Myr ago. We have combined the VESTIGE data with multifrequency data from the UV to the far-infrared to characterise the stellar populations of these regions and study the star formation process in an extreme environment such as the tails of stripped gas embedded in the hot intracluster medium. The colour, spectral energy distribution (SED), and linear size consistently indicate that these regions are coeval and have been formed after a single burst of star formation that occurred.100 Myr ago. These regions might become free floating objects within the cluster potential well, and be the local analogues of compact sources produced after the interaction of gas-rich systems that occurred during the early formation of clusters.
Key words. galaxies: individual: NGC 4254 – galaxies: clusters: general – galaxies: clusters: individual: Virgo – galaxies: evolution – galaxies: interactions – galaxies: ISM
?Based on observations obtained with MegaPrime/MegaCam, a joint
project of CFHT and CEA/DAPNIA, at the Canadian-French-Hawaii Telescope (CFHT) which is operated by the National Research Council (NRC) of Canada, the Institut National des Sciences de l’Univers of the Centre National de la Recherche Scientifique (CNRS) of France and the University of Hawaii.
??Visiting Astronomer at NRC Herzberg Astronomy and
Astro-physics, 5071 West Saanich Road, Victoria, BC V9E 2E7, Canada.
1. Introduction
The environment plays a fundamental role in shaping galaxy evolution. Since the work ofDressler(1980), it is clear that clus-ters of galaxies are dominated by early-type systems (ellipticals and lenticulars) which are relatively rare in the field (see also
Whitmore et al. 1993). It is also well established that late-type
galaxies in dense environments have a lower atomic gas con-tent than their isolated counterparts (Haynes & Giovanelli 1984; A114, page 1 of16
Cayatte et al. 1990;Solanes et al. 2001;Gavazzi et al. 2005) with several recent indications that this occurs also for the molecu-lar gas phase (Fumagalli et al. 2009;Boselli et al. 2014a) and the dust content (Cortese et al. 2010,2012a). The gas removal, which begins in the outer regions and progresses inwards, lead-ing to truncated discs (Cayatte et al. 1994;Boselli et al. 2006), induces a decrease of the star formation activity, as is systemat-ically observed in nearby clusters (e.g.Kennicutt 1983;Gavazzi et al. 1998;Gómez et al. 2003;Boselli et al. 2014b).
Since the discovery of these systematic differences between galaxies in rich environments and those in the field, observers, modelers and simulators have made great strides in identify-ing the dominant physical mechanism responsible for the gas removal and for the subsequent quenching of the star forma-tion activity, as reviewed inBoselli & Gavazzi(2006,2014). The detailed observations of local galaxies with strong signs of an ongoing perturbation (Gavazzi et al. 2001;Kenney et al. 2004,
2014;Boselli et al. 2006,2016a;Vollmer et al. 2006,2008a,b,
2009,2012;Sun et al. 2007;Scott et al. 2012), the analysis of local samples of cluster galaxies (Gavazzi et al. 1998,2010,2013;
Boselli et al. 2008a,b, 2014b, 2016b), as well as finely tuned models and simulations of representative objects (Roediger &
Hensler 2005; Roediger & Brüggen 2007, 2008; Tonnesen &
Bryan 2009) suggest that the dominant process in local clusters is the ram pressure (Gunn & Gott 1972) exerted by the dense intra-cluster medium on the interstellar medium of galaxies moving at high velocity within the cluster. On the other hand, the statistical analysis of large samples of galaxies extracted from the SDSS spanning a wide range of density, combined with hydrodynamic cosmological simulations, favour a less violent interaction able to remove only the hot gas halo and thus stop the the infall of fresh material, thus reducing the activity of star formation only once the cold gas on the galaxy discs has been fully transformed into stars (starvation –Larson et al. 1980). Other processes, such as galaxy harassment (Moore et al. 1998), might have signifi-cantly contributed during the accretion of galaxies in massive clusters via small groups (pre-processing, Dressler 2004) and may still be dominant under specific conditions.
So far, however, there have been no systematic efforts to study the fate of the stripped gas. There are two major reasons for this situation: 1) the difficulty in observing the gas once removed from the galactic disc, needed to provide stringent constraints on models and simulations; and 2) the difficulty in simulating the dynamical evolution of the gas properties within a complex and inhomogeneous cluster environment (density, turbulence, tem-perature) in its different phases (atomic, molecular, ionised, hot) and at different scales (from molecular clouds on pc scales to tails 50–100 kpc long). One of the first detections of stripped material in cluster late-type galaxies was the observations of ∼50 kpc-long radio continuum tails (synchrotron emission) in three galaxies at the periphery of A1367 (Gavazzi & Jaffe 1985,
1987;Gavazzi et al. 1995). Their cometary shape has been
inter-preted as clear evidence of an ongoing ram pressure stripping event. Deep narrow-band Hα observations of the same galaxies have highlighted long tails of ionised gas (Gavazzi et al. 2001), suggesting that the cold atomic hydrogen might change phase once in contact with the hot intracluster medium via, for exam-ple, thermal evaporation (Cowie & Songaila 1977). Indeed, the observations of tails of neutral atomic gas (HI) are still quite uncommon: only a few cases are known in nearby clusters (Virgo
– Chung et al. 2007; A1367 – Scott et al. 2012). The
situa-tion changed recently thanks to the advent of large panoramic detectors mounted on 4-m-class telescopes with narrow-band filters that allowed the detection of tails of ionised gas after
very deep exposures in several galaxies in Virgo (Yoshida et al.
2002; Kenney et al. 2008; Boselli et al. 2016a), Coma (Yagi
et al. 2010;Fossati et al. 2012), Norma (Sun et al. 2007;Zhang et al. 2013), and A1367 (Gavazzi et al. 2001;Boselli & Gavazzi
2014; Yagi et al. 2017), and a further observational constraint
came from X-ray observations, which allowed the detection of hot gas within these tails (Sun et al. 2006). Information is also provided by long-slit (Yoshida et al. 2012; Yagi et al. 2013) or IFU spectroscopic observations (Fumagalli et al. 2014; Fossati et al. 2016; Poggianti et al. 2017; Bellhouse et al. 2017; Fritz
et al. 2017;Consolandi et al. 2017), which are fundamental for
understanding the kinematics of the stripped gas and its chemical composition and physical state. Recently, also CO observations have been made possible for the detection of the molecular gas phase (Jáchym et al. 2013,2014,2017;Verdugo et al. 2015).
A surprising result of these recent studies is that only in a few cases does the stripped gas collapse to form stars outside the disc of the perturbed galaxy. This generally happens within compact HII regions dominated by young stellar populations (Hester et al. 2010; Fumagalli et al. 2011, 2014; Fossati et al. 2016;Consolandi et al. 2017). There are indeed several instances within the Virgo cluster where the stripped gas remains diffuse in its atomic neutral (Boissier et al. 2012) or ionised (Boselli et al.
2016a) phase and does not collapse to form new stars, while in
other objects a star formation event occurs (Hester et al. 2010;
Fumagalli et al. 2011;Arrigoni Battaia et al. 2012;Kenney et al. 2014). This observational evidence is in contrast with the results of models and simulations which systematically predict the for-mation of new stars outside the galaxy disc (Kapferer et al. 2009;
Tonnesen & Bryan 2010,2012), an indication that the physical prescriptions used in the models still need to be refined.
VESTIGE (A Virgo Environmental Survey Tracing Ionised Gas Emission; Boselli et al. 2018, Paper I) is a deep narrow-band Hα imaging survey of the Virgo cluster carried out with MegaCam at the CFHT. This survey is providing us with a unique opportunity to study the fate of the stripped gas in cluster galaxies, being the first complete narrow-band imaging survey of a nearby cluster up to its virial radius (covering an area of 104o2). Thanks to its unique sensitivity ( f (Hα) ∼ 4 ×
10−17erg s−1cm−2− 5σ detection limit for point sources and
Σ(Hα) ∼ 2 × 10⁻¹⁸erg s−1cm−2arcsec−2− 1σ detection limit at
3 arcsec resolution for extended sources) and subarcsecond image quality, VESTIGE will detect the diffuse ionised gas stripped from the perturbed galaxies, as well as compact HII
regions of luminosity L(Hα) ≥ 1036erg s−1. VESTIGE will also benefit from the large number of available multifrequency data for the Virgo cluster, from the X-ray to the radio, which are nec-essary for a coherent and complete analysis of the multiphase gas
(Boselli et al. 2018). The use of Hα data with respect to other
star formation tracers is crucial if we want to study the process of star formation on timescales of.10 Myr (Boselli et al. 2009;
Boquien et al. 2014). This is necessary whenever the perturbing
process is rapid (.500 Myr), as indeed expected within a rich cluster such as Virgo (Boselli et al. 2016b).
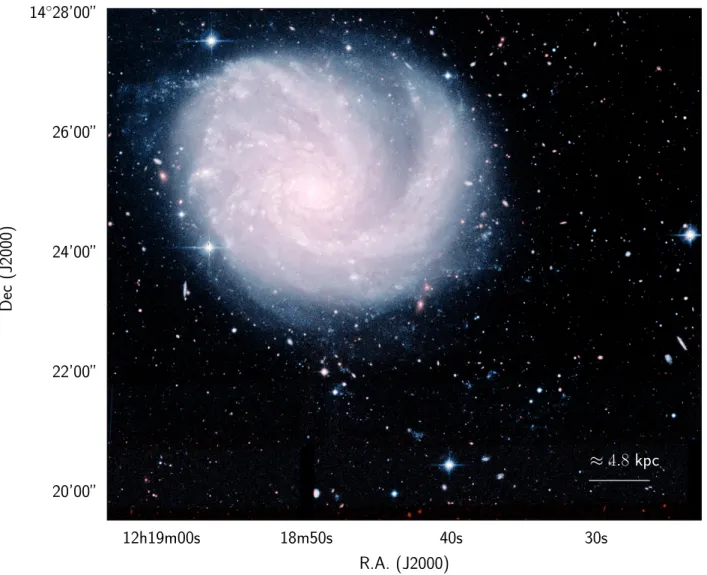
This paper is dedicated to the study of the spiral (SA(s)c) galaxy NGC 4254 (M99) located at the northern periphery of the cluster at '1.0 Mpc from M87 ('0.7 × Rvir; see Fig.1). The
presence of a tail of HI gas '250 kpc in length indicates that the galaxy has been gravitationally perturbed after a rapid encounter with another Virgo cluster member (Haynes et al. 2007). The interaction is thought to be responsible for the creation of a free-floating HI cloud of gas not associated to any stellar component: the so called dark galaxy Virgo HI21 (Minchin et al. 2005). Dedicated simulations suggest that this interaction occurred
≈ 4.8 kpc
12h19m00s
18m50s
40s
30s
14
◦28’00”
26’00”
24’00”
22’00”
20’00”
R.A. (J2000)
Dec
(J2000)
Fig. 1.Colour ugi RGB image of the galaxy NGC 4254 obtained using the NGVS data (Ferrarese et al. 2012). At the distance of the galaxy (16.5 Mpc), 1 arcmin = 4.8 kpc. The star-forming regions analysed in this work are the blue blobs in the south-west outside the disc of the galaxy. ∼280–750 Myr ago (Vollmer et al. 2005;Bekki et al. 2005;Duc
& Bournaud 2008). The same simulations indicate that, during
a rapid galaxy–galaxy encounter (galaxy harassment – Moore
et al. 1998), only the gaseous component is perturbed leaving the
stellar disc intact (Duc & Bournaud 2008). What happens to the stripped gas? Why is it still in its cold atomic phase? Being still cold, can it collapse and form new stars outside the galaxy disc and, if so, under what conditions? NGC 4254 is thus an ideal laboratory for studying the star formation process in extreme and unusual conditions, and another candidate to extend previ-ous studies to different environments (Boquien et al. 2007,2009,
2010,2011;Fumagalli et al. 2011;Arrigoni Battaia et al. 2012;
Jáchym et al. 2013, 2014, 2017; Kenney et al. 2014; Lisenfeld
et al. 2016).
In this paper, we search for and study the properties of extra-planar HII regions formed after the interaction of the galaxy within the hostile cluster environment. We do this using the unique set of multifrequency data sensitive to the youngest stel-lar populations available for this representative galaxy combined with SED fitting models. The narrow-band Hα observations and data reduction are described in Sect.2. The multifrequency dataset used in the analysis is described in Sect.3, while Sects.4
and5 describe the identification of the extraplanar HIIregions and the derivation of their physical parameters, respectively. A discussion is given in Sect. 6. Given its position within the
cluster, we assume the galaxy to be at a distance of 16.5 Mpc (Gavazzi et al. 1999;Mei et al. 2007;Blakeslee et al. 2009). All magnitudes are given in the AB system.
2. Observations and data reduction
The galaxy NGC 4254 was observed during the second run of pilot observations of the VESTIGE survey in spring 2016
(see Boselli et al. 2018 for details). Observations were
car-ried out with MegaCam at the CFHT using the new narrow-band filter MP9603 (λc= 6590 Å; ∆λ = 104 Å, T = 93%) which
includes observations at the redshift of the galaxy (vel= 2404 km s−1), the Hα line (λ= 6563 Å), and the two [NII] lines (λ= 6548, 6583 Å)1. The camera is composed of 40 CCDs with
a pixel scale of 0.187 arcsec pixel−1. The galaxy was observed
using the pointing-macro QSO LDP-CCD7 especially designed for the Elixir-LSB data reduction pipeline. This macro is com-posed of seven different pointings overlapping over a region of 40 × 30 arcmin2. To secure the determination of the stellar
con-tinuum, the galaxy was also observed in the r-band filter. The integration time for each single pointing within the macro was of 66 s in the r-band and 660 s in the narrow-band filter. The macro
1 Hereafter we refer to the Hα+ [NII] band simply as Hα, unless
was run two times, thus the total integration time in the central 40 × 30 arcmin2of the combined image is of 924 s in r-band and 9240 s in narrow-band.
Data reduction was completed using the standard proce-dures adopted for the VESTIGE data (extensively described in Paper I). The MegaCam images were reduced using Elixir-LSB, a data reduction pipeline optimised to detect the diffuse emis-sion of extended low-surface-brightness features associated with the perturbed galaxies by removing any contribution of scattered light in the different science frames. This procedure, tuned to detect low-surface-brightness features, is perfectly adapted for the narrow-band frames whenever the images are background dominated, as is the case for those obtained in this work (see
Boselli et al. 2016a). The photometric calibration of the r-band
filter was derived using the standard MegaCam calibration pro-cedures (Gwyn 2008). Those in the narrow-band filter were derived as described in Fossati et al. (in prep.). The typical uncer-tainty is 0.01 mag in both bands. The single images were stacked and an astrometric correction was applied using the MegaPipe pipeline (Gwyn 2008). As for the VESTIGE survey, the sen-sitivity is of f (Hα) ∼ 4 × 10⁻¹⁷erg s−1 cm−2 for point sources
(5σ) andΣ(Hα) ∼ 2 × 10⁻¹⁸erg s−1cm−2arcsec−2 for extended sources (1σ detection limit at ∼3 arcsec resolution), while the depth in the r-band is 24.5 AB mag (5σ) for point sources and 25.8 AB mag arcsec−2(1σ) for extended sources. The mean image quality is of 0.60 arcsec in the r-band and 0.56 arcsec in the narrow-band filter.
3. Multifrequency data
The Virgo cluster region has been the target of several multifre-quency blind surveys. These data are crucial for the identification of the stellar population dominating any extraplanar star-forming region.
3.1. GALEX
Two very deep GALEX exposures are available for the galaxy NGC 4254 in the FUV (λc= 1539 Å, ∆λ = 442 Å; integration
time 18 131 s) and NUV (λc= 2316 Å. ∆λ = 1060 Å; integration
time 27 726 s) bands (Boselli et al. 2011). For these expo-sure times, the limiting magnitude for point sources is FUV ∼ 25.3 AB mag and NUV ∼ 24.9 AB mag (Voyer et al. 2014), while for extended sources is ∼29.7 mag arcsec−2 in both bands. The
GALEX images have a pixel size of 1.5 arcsec, and an angu-lar resolution of 4.0 arcsec FWHM in the FUV and 5.6 arcsec in the NUV. The photometric accuracy of the instrument is of 0.05 AB mag in FUV and 0.03 in NUV, while the astrometric accuracy is of 0.5 arcsec in both bands (Morrissey et al. 2007). 3.2. Optical
Very deep optical images in the u, g, i, and z bands are avail-able from the NGVS survey taken with MegaCam at the CFHT
(Ferrarese et al. 2012). Their depth is ∼1 mag deeper than
the VESTIGE r-band images. The photometric and astrometric accuracy, and angular resolution of NGVS in these photomet-ric bands is comparable to that reached in the r- and in the narrow-band filters.
3.3. Near- and far-IR
NGC 4254 has been observed in the near- and far-infrared by Spitzerwith IRAC at 3.6, 4.5, 5.8, and 8.0 µm (Ciesla et al. 2014)
and MIPS at 24 and 70 µm (Bendo et al. 2012) during the SINGS survey (Kennicutt et al. 2003), and by Herschel with PACS at 100 and 160 µm (Cortese et al. 2014) and SPIRE at 250, 350, and 500 µm (Ciesla et al. 2012) as part of the HeViCS (Davies et al. 2010) and HRS (Boselli et al. 2010) surveys. Near-IR data are also available from the WISE survey (Wright et al. 2010). Given the compact nature of the extraplanar HII regions analysed in this work, and their weak emission, the following analysis will use only the four IRAC and MIPS 24 µm bands, where the angu-lar resolution and the sensitivity of the instruments allow the detection or the determination of stringent upper limits for the HII regions observed in the UV and optical bands. None of the sources has been detected at longer wavelengths.
3.4. HI and CO
The discovery of an ongoing perturbation of the disc of NGC 4254 due to a flyby encounter with another Virgo cluster member has been made possible by HI observations. VLA observations first revealed the presence of HI blobs located along a diffuse feature starting at the south-west edge of the stellar disc and extending ∼30 kpc to the north-west (Phookun et al. 1993). The galaxy has been observed in HI also at Effelsberg (Vollmer et al. 2005), Parkes (Wong et al. 2006), and with the VLA (Chung
et al. 2009). More recent low-angular-resolution HI observations
taken with the Arecibo radio telescope during the ALFALFA
(Giovanelli et al. 2005) survey of the Virgo cluster indicate
that this tail of HI gas is much more extended than previ-ously thought (∼250 kpc, to be compared to the isophotal radius of the galaxy which is 13 kpc) and links NGC 4254 to the tidal debris Virgo HI21 (Davies et al. 2004; Minchin et al.
2005; Bekki et al. 2005). The total mass of HI gas in this
tail is estimated at (4.8 ± 0.6) × 108M
and its column density
Σ(HI) ∼ 3 × 1018 cm−2 (Haynes et al. 2007), while the HI blobs
in the tail detected at the VLA have Σ(HI) ∼ 1019 cm −2 at
a resolution of '30 arcsec. The asymmetric distribution of the gas over the disc of the galaxy, with the presence of a low sur-face brightness tail in the northern part (Phookun et al. 1993), and the presence of a radio continuum extended tail (Kantharia et al. 2008), suggest that the galaxy is also suffering ram pressure stripping.
NGC 4254 has also been observed in12CO(2–1) during the HERACLES survey of nearby galaxies using the IRAM 30m radio telescope, with an angular resolution of 13 arcsec, a veloc-ity resolution of 2.6 km s−1, and a typical RMS of 20–25 mK (TMBscale;Leroy et al. 2009). Unfortunately, the final map
cov-ers only approximately one-third of the extraplanar HIIregions of NGC 4254, and does not detect any of them.
4. Extraplanar HIIregions
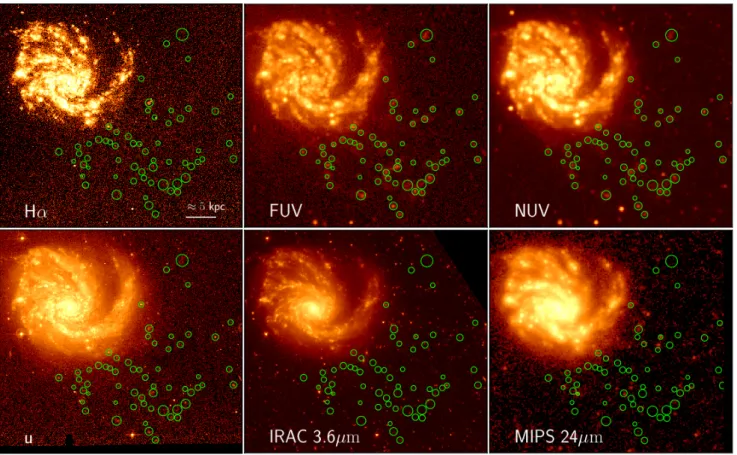
Figure2 shows the multifrequency images of NGC 4254. The FUV and NUV images indicate the presence of several blue com-pact objects in the south-west periphery of the galaxy extending up to ∼20 kpc outside the optical disc. These star forming com-plexes have already been noticed byThilker et al.(2007) who identified them as part of a standard extended UV disc. Among these we selected, in the FUV GALEX image, those located at the edge of the prominent south-west spiral arm or outside the stellar disc of NGC 4254, with a compact morphology, and avoiding extended diffuse structures. We then rejected those with typical morphologies of background galaxies as seen in the higher-quality optical images. We identify 60 of these compact regions as depicted in Fig.3. These objects are all detected in the
Fig. 2. Multifrequency images of the galaxy NGC 4254 (north is up, east is left). Upper panels, from left to right: continuum-subtracted Hα (VESTIGE), FUV (GALEX), NUV (GALEX); lower panels: u-band (NGVS), IRAC 3.6 µm (Spitzer), MIPS 24 µm (Spitzer). The extraplanar star-forming regions marked with green circles are evident in FUV image at the south-west of the galaxy. The linear size of each single image corresponds 40 × 35 kpc2at the distance of the galaxy.
NUV image, 30 of them also in the VESTIGE Hα continuum-subtracted image, while 34, 26, 24, 21, and 16 in the ugriz images, respectively. The VESTIGE and NGVS images indicate that these sources are very compact since they are only barely resolved in these subarcsecond resolution frames. Although this sample is not complete in any sense, we are confident that it is statistically representative of the extraplanar young stellar regions associated with NGC 4254.
The FUV GALEX image alone does not allow us to make robust conclusions on whether these blue compact regions are all associated to the galaxy or are foreground or background objects. However, their relative distribution with respect to NGC 4254 and to the HI tail of stripped gas detected either in the VLA (Chung et al. 2009) or in the ALFALFA HI data (Haynes et al. 2007), as shown in Fig. 4, strongly sug-gests that they are star forming regions formed within the stripped gas of the galaxy. It is surprising that these star form-ing regions are only present within .20 kpc of the edge of the stellar disc of the galaxy, while they are totally absent in the rest of the HI tail. We can estimate the contamination of background objects using the FUV GALEX number counts derived byXu et al. (2005). At the limiting magnitude of our detections (FUV ' 24 mag) the number of background sources is ∼1000 deg−2, thus ∼6–7 over the ∼60× 40 region outside
NGC 4254 analysed in this work (∼10%). We also measured the mean background source density down to a limiting magni-tude of FUV ≤ 24 mag and detected with a signal-to-noise ratio (S /N) > 5 within the whole GALEX FUV frame (0.5◦ radius)
once the bright Virgo galaxies (NGC 4254, NGC 4262, NGC 4298) were masked. This density is ∼2300 deg−2, thus the
expected contamination is ∼15 objects in the studied region. Since the background distribution slightly changes within the FUV frame, we also measured the density of FUV-emitting sources with properties similar to those analysed in this work in a corona centred on NGC 4254 of inner radius 210 arcsec and outer radius 400 arcsec, where all the studied regions are located. Considering as reference the density within this corona, the number of expected contaminants is approximately ten objects.
The coordinates of these regions are given in TableA.1. To study the stellar populations of these compact regions we extract their fluxes in the different photometric bands using the apertures shown in Fig.3. All these apertures have a radius rap& 4 arcsec
to encompass the total flux of the emitting region in the different photometric bands, including those that are diffraction limited (FUV, NUV, 24 µm Spitzer/MIPS; see TableA.12). At the same time they are sufficiently small (rap ≤ 10 arcsec, where rap is
the radius of the regions plotted in Figs.2 and3 encompass-ing all the FUV emission in the GALEX frame) to limit the contamination of background or local point sources. We notice, however, that despite the small size of the aperture, in some cases the high-resolution MegaCam images in Hα or in the broad bands reveal the presence of more than a single source unresolved by GALEX. None of these regions is detected at wavelengths longer than 24 µm. To obtain the most accurate esti-mate of the flux of each emitting region, or measure a stringent upper limit, the sky background is derived in the same apertures
2 An aperture correction has been applied to the only region detected
Fig. 3.FUV/NUV GALEX colour (left) and continuum-subtracted Hα (VESTIGE; right) magnified images of the extraplanar star-forming regions (marked with green circles) in the south-west quadrant of NGC 4254. The UV colour image shows that these regions have very blue colours, and are thus dominated by young stellar populations (.100 Myr). Half of them, however, are undetected in Hα, indicating that their typical age is 10 Myr. age . 100 Myr.
12h22m00s 20m00s 18m00s 15◦20’00” 00’00” 14◦40’00” 20’00” 00’00” R.A. (J2000) Dec (J2000) 2285 2260 2250 2220 2404 2270 2315 2240 2220 2220 12h19m00s 18m40s 20s 00s 14◦30’ 25’ 20’ R.A. (J2000)
Fig. 4.VLA HI contours at a column densityΣ(HI) = 1019cm−2(fromChung et al. 2009; red) and the Arecibo HI contours at a column density
Σ(HI) = 1−2 × 1019cm−2(fromHaynes et al. 2007; white) are superposed on the GALEX FUV/NUV colour image. The right panel is a magnified
view of the boxed region marked in the left panel with a dashed line. The typical velocity of the different HI structures detected at the VLA are given. The yellow and cyan ellipses at the lower left corner of the two images show the beam sizes at Arecibo (3.30
× 3.80
) and at the VLA (30.8600× 28.0700
).
randomly displaced around the region itself once the other sources, and the diffuse emission of the galaxy is masked. This procedure is repeated 1000 times, minimising any uncertainty on the sky background determination. As inFossati et al.(2018), the uncertainties on the fluxes are obtained as the quadratic sum of the uncertainties on the flux counts and the uncertainties on the background (rms of the bootstrap iterations). The uncertainties on the flux counts are derived assuming a Poissonian distribution
for the source photons. We assume those sources with S /N > 3 as being detected. For the undetected sources, we estimate an upper limit to the flux. Flux densities, corrected for Galactic extinction followingSchlafly & Finkbeiner(2011) (E(B − V) = 0.034) com-bined with the reddening law of Fitzpatrick(1999), with their uncertainty and 1σ upper limits, are listed in TableA.1. For con-sistency with the other photometric bands, the Hα flux is given as LyC (in units of µJy), the flux in the Lyman continuum pseudo
filter PSEUDOLyCderived as described inBoselli et al.(2016b): LyC [mJy]= 1.07 × 10 −37× L(Hα) [erg s−1] D2[Mpc] . (1) 5. Physical parameters 5.1. Hα luminosities
The narrow-band filter encompasses the Hα line at λ= 6563 Å and the two [NII] lines at λ= 6548 and λ = 6583 Å. To mea-sure the Hα luminosity of these extraplanar HIIregions shown in Fig. 3 we have first to remove the [NII] contribution. Since no spectroscopic data are available, we apply a mean standard correction. The typical [NII]λ6583/Hα ratio in extragalactic HII
region is [NII]λ6583/Hα. 0.3 (e.g.McCall et al. 1985;Kewley
et al. 2001; Sánchez et al. 2015), with a ratio decreasing
radi-ally from the nucleus to the outer disc (Kennicutt et al. 1989;
Ho et al. 1997). HII regions formed within the stripped gas
of some perturbed galaxies have been observed in nearby clus-ters. Spectroscopic observations of these peculiar regions give quite different estimates of the [NII]λ6583/Hα line ratio, rang-ing from 0.1 to 1 in the tails of two galaxies in the Coma cluster (Yoshida et al. 2012), to '0.4 in ESO 137-001 (Fossati
et al. 2016), and '0.2 in the perturbed galaxy JO206 recently
observed with MUSE by Poggianti et al. (2017). Given that the extraplanar HII regions of NGC 4254 have been formed after the collapse of the stripped gas which has been removed from the outer disc of the galaxy after a rapid encounter with another cluster member, we expect a low-metallicity environ-ment. Indeed, the mean metallicity of NGC 4254 is 12 + log O/H = 8.73 (Hughes et al. 2013), but the galaxy has a steep metal-licity gradient suggesting that the metalmetal-licity in the outer disc is 12 + log (O/H) ∼ 8.5 (Skillman et al. 1996). This metallicity also corresponds to that observed in the outer discs of spiral galaxies (12 + log (O/H) ∼ 8.45;Sánchez-Menguiano et al. 2016;Bresolin 2017). We thus assume for the correction [NII]λ6583/Hα = 0.2
(Pettini & Pagel 2004). We also assume a mean dust
attenu-ation of A(Hα) = 0.7, a value consistent with those observed in the extraplanar HIIregions of the same perturbed galaxies (0. A(Hα) . 1 mag –Fossati et al. 2016;Poggianti et al. 2017), in the outer discs of late-type galaxies (0 . A(Hα) . 2 mag –
Kennicutt et al. 1989;Sánchez et al. 2015), or in UV extended
discs (A(Hα) ' 0.7 mag –Bresolin et al. 2009,2012).
Figure5shows the distribution of the Hα luminosity of the detected and undetected extraplanar HIIregions of NGC 4254. Figure5also shows how the distribution would shift assuming different corrections for dust attenuation (A(Hα) = 0.0–1.5) or [NII] contamination ([NII]λ6583/Hα = 0.0–1.5). The luminosity of the HIIregions is in the range 1037. L(Hα) . 1039(erg s−1),
and corresponds thus to the typical luminosity of giant or super-giant Galactic or extragalactic HIIregions (Lee et al. 2011). 5.2. Colour analysis
The blue colours of the HIIregions seen in Figs.2and3 indi-cate that they are dominated by very young stellar populations. The fact that they are all detected in the two UV bands, while only a few are in the Hα and u-band, and most undetected at longer wavelengths, suggests that they have been formed by a single coeval, short-lived burst of star formation. To estimate their typical age we first compare their observed (Hα–FUV) and (FUV–NUV) age-sensitive colours to the typical synthetic colours of HIIregions derived assuming a star formation history
Fig. 5.Upper panel: Hα luminosity distribution of the extraplanar HII
regions of NGC 4254. The black shaded histogram indicates the Hα detected regions, the red histogram the distribution of the upper limits. The vertical dashed line shows the detection limit of VESTIGE, the ver-tical dotted line the median value for the Hα luminosity distribution of the detected sources. The error bars show how the median value of the distribution would shift assuming different corrections for dust atten-uation (A(Hα= 0.0−1.5) or [NII] contamination ([NII]λ6583/Hα = 0.0−0.5). Lower panel: distribution of the inferred stellar mass. The black open histogram shows the distribution of all the HIIregions.
defined as:
SFR(t)= t × e−τt M yr−1, (2)
the form of which is shown in Fig. 6 (upper panel). The τ e-folding time is set to 3 Myr, consistent with the typical age of giant (L(Hα) ' 1037erg s−1) HII regions in the Milky Way or in other nearby galaxies (Copetti et al. 1985;Tremblin
et al. 2014). This approach is similar to the one adopted by
Fumagalli et al.(2011) for dating the HIIregions of IC3418 and
Boquien et al.(2007) for the intergalactic star-forming regions
around NGC 5291. We then estimate the typical colour of the synthetic HIIregions assuming that the burst of star formation occurred at different epochs (Fig.6, lower panel). The synthetic colours are derived using the CIGALE SED fitting code (Noll
et al. 2009), assuming the Bruzual & Charlot (2003)
Fig. 6.Upper panel: delayed star formation history with an e-folding time of 3 Myr assumed to fit the observed SED of the extraplanar HII
regions of NGC 4254. Lower panel: typical age of their dominant stel-lar population is the age of the burst (80 Myr – red, 50 Myr – green, 20 Myr – blue).
IMF and an updated version of theDraine & Li(2007) physi-cal models of dust emission (seeBoselli et al. 2016bfor details). To use the Hα emission as a constraint in the fit, we convert the extinction-corrected Hα fluxes into numbers of ionising photons as inBoselli et al.(2016b). We assume an escape fraction of the ionising radiation equal to zero, and that the ionising radiation is not absorbed by dust before ionising the gas (e.g.Boselli et al. 2009). The models are determined assuming different values for the dust attenuation of the stellar continuum (E(B − V) = 0.0, 0.1, 0.2), as expected if their metallicity and dust content change from region to region. Geometrical effects on the stellar continuum related to the age of the stellar population are taken into account using theCalzetti et al.(2000) attenuation law. To combine the Hα line flux emission with the broad-band monochromatic flux FUV (in units of mag) in a colour index we define the Hα-FUV colour index as:
Hα − FUV= −2.5 × log(LyC) + 20 − FUV, (3)
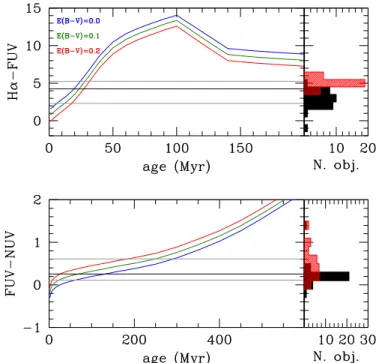
where LyC is the flux in the Lyman continuum pseudo filter PSEUDOLyC (in units of µJy) as defined in Eq. (1). Figure 7
shows how the Hα-FUV and FUV–NUV colour indices vary as a function of the age of the burst. Clearly the two colour
Fig. 7.Left panels: variations of the Hα–FUV (upper) and FUV–NUV (lower) age-sensitive colour indices as a function of time derived for the star formation history given in Eq. (1). Different colours are used for three different dust attenuations: E(B − V)= 0.0 (blue), 0.1 (green), and 0.2 (red). The black solid line shows the median of the observed colour distribution, the grey lines the 16% and the 84% quartiles of the distribution. Right panels: distribution of the two colour indices for the detected (black) and undetected (red – lower limit) HIIregions. indices are sensitive to the age of the HII regions, the Hα-FUV to ages .150 Myr, and the FUV–NUV to ages in the range 500. age . 1000 Myr. Only the former can be used on the present set of data: the FUV–NUV colour index, indeed, gradually increases from FUV–NUV ' 0 mag at age = 0 Myr to FUV–NUV ' 0.6 mag at age = 1000 Myr, an overly limited vari-ation compared to the observed distribution of the FUV–NUV colour index and its large uncertainty ('0.2 mag). Figure7 sug-gests that the age of the extraplanar HIIregions of NGC 4254 is .100 Myr. This is also the case for the HIIregions undetected in Hα (age& 10 Myr) and in the u-band (age . 200 Myr).
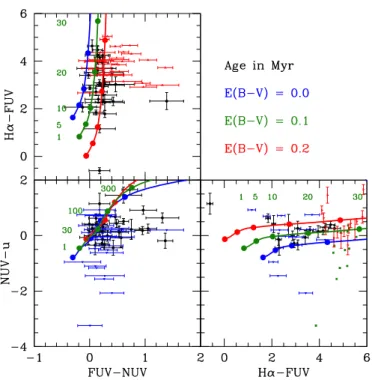
The observed colours of these HIIregions can also be com-pared to the evolutionary tracks derived by CIGALE in different photometric bands sensitive to young stellar populations, Hα, FUV, NUV, and u (Fig.8). Again, despite the large photomet-ric uncertainties on the data, or the large number of undetected sources in some of the photometric bands, the colours of the HIIregions are all consistent with very young ages (0–50 Myr). Figure8also shows the presence of several outliers with colours significantly different from those predicted by the evolutionary tracks. A clear example are those with FUV–NUV > 0.4 in the upper panel. The visual inspection of those detected in Hα on the high-resolution MegaCam images revealed the presence of mul-tiple sources unresolved in the GALEX frames. If these single HIIregions have different star formation histories, it is plausible that their UV colour in the unresolved GALEX images does not follow the proposed evolutionary tracks.
5.3. SED fitting
We estimate the age of each single HIIregion using the CIGALE SED fitting code assuming the same configuration as given
Fig. 8. Age-sensitive colour–colour diagrams. Upper left panel: Hα–FUV vs. FUV–NUV, lower left panel: NUV–u vs. FUV–NUV, lower right panel: NUV–u vs. Hα–FUV. Black filled dots are for regions detected in all bands, red filled triangles are lower limits in Hα-FUV, blue filled triangles upper limits in NUV–u, and green open squares regions undetected in Hα and in the u-band. The blue, green, and red filled dots and solid lines indicate the expected colours at different ages (in Myr) for the assumed star formation history for an E(B − V)= 0.0 (blue), 0.1 (green), and 0.2 (red), respectively.
above, that is, the star formation history given in Eq. (1), the
Bruzual & Charlot(2003) population synthesis models derived
for a Salpeter IMF, coupled with the Draine & Li(2007) dust models. We fit all (11) photometric bands from the FUV to the Spitzer/MIPS 24 µm with the exception of the r-band where the contamination of the emitting Hα line can be dominant combined with the Hα emission using the PSEUDOLyCpseudo
filter as inBoselli et al.(2016b), and treating upper limits as in
Sawicki(2012). Upper limits in the far-infrared bands are used
to constrain the dust attenuation in the star-forming regions. The grid of models is created using the parameters listed in Table1
(244 620 models).
The output of the fit (star formation rates, stellar masses, ages, and their uncertainties, self-consistently determined assuming the star formation history given in Eq. (1)) for each single HIIregion is given in Table2. To quantify how the ages of the regions depend on the assumed dust attenuation and [NII] contamination corrections on the Hα flux we compare in Fig. 9 two sets of values derived assuming in the first one [NII]λ6583/Hα = 0.1 and A(Hα) = 0.0, and in the second [NII]λ6583/Hα = 0.2 and A(Hα)= 0.7. We also test the relia-bility of the output parameters and their uncertainties given in Table2 by creating a photometric mock catalogue introducing into the observed data some extra noise, randomly distributed according to a Gaussian curve of standard deviation equal to the median error for each band, and re-fit the data using the same SED models (seeGiovannoli et al. 2011; Boquien et al. 2012;
Ciesla et al. 2014 for details). We follow this step twice, the
first time keeping the relatively uncertain [NII] contamination and Hα attenuation given in Sect. 5.1 ([NII]λ6583/Hα = 0.2,
Table 1. Input parameters for CIGALE.
Parameter Value Units
Pop. synth. mod. Bruzual & Charlot(2003) Dust model Draine & Li(2007)
IMF Salpeter
Metallicity 0.02
Age 1–301, step 2 Myr
Extinction law Calzetti
E(B−V) 0.0,0.1,0.2,0.3,0.4 mag UV bump amplitude 0, 1.5, 3 QPAH 0.47, 3.90, 7.32 Umin 0.1, 1.0, 5.0, 10.0 α 1.5, 2.0, 2.5 γ 0.01, 0.3, 1.0
Notes. Line 1: population synthesis model. Line 2: dust model. Line 3: IMF. Line 4: stellar metallicity. Line 5: age interval and sampling. Line 6: extinction law (Calzetti et al. 2000). Line 7: attenuation. Line 8: amplitude of the UV bump (Noll et al. 2009). Line 9: mass fraction of the dust composed of PAH particles containing <103atoms (Draine &
Li 2007). Line 10: diffuse interstellar radiation field (Draine & Li 2007). Line 11: power-law index of the interstellar radiation field (Draine & Li 2007). Line 12: fraction of the dust mass that is close to OB associa-tions and is exposed to a stellar radiation field with intensity U > Umin
(Draine & Li 2007).
A(Hα) = 0.7), and the second time assuming more extreme values ([NII]λ6583/Hα = 0.1, A(Hα) = 0.0); we compare the output of the fit in Fig.10. Figures9and10clearly show that, despite the number of parameters used to create the model SEDs, the large uncertainty on the photometric data and that on the corrections on the [NII] contamination and on the Hα attenuation, the stellar masses and the ages of the HII regions derived by the SED fitting code do not vary significantly. The mean age of the stellar population is systematically under-estimated whenever A(Hα) is overunder-estimated; the opposite is true when [NII]/Hα is overestimated. Star formation rates are instead very uncertain once they are below 10−4M yr−1. The
SED fitting analysis thus confirms the results obtained from the colour analysis done in the previous section, that is, that these HIIregions have been formed.100 Myr ago, with a few exceptions, some of which might be background galaxies. 5.4. Dynamical age
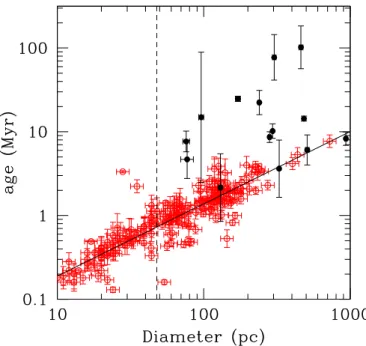
It has been shown that the size of the HII regions is tightly related to their dynamical age, defined as tdyn∼ rHII/∆V, where
rHIIis the radius of the HIIregion and∆V its expansion
veloc-ity (Ambrocio-Cruz et al. 2016). We do not have any dynamical data for these HIIregions, but thanks to the excellent quality of the Hα image we can measure their angular size and compare their stellar age-size relation to the dynamical age-size relation determined in the LMC byAmbrocio-Cruz et al.(2016). Upon doing this we make the assumption that the dynamical evolu-tion of the extraplanar HIIregions of NGC 4254 is similar to that of typical disc HIIregions despite the conditions of the sur-rounding medium (gas density and temperature) probably being significantly different from those generally encountered in the interstellar medium of late-type galaxies (Tonnesen & Bryan 2012). For a fair comparison we need to measure the size of the HIIregions as consistently as possible withAmbrocio-Cruz et al.(2016).
We measure the size of the few point-like, symmetric HII
Table 2. Parameters derived from the SED fitting.
Region log Mstar log S FR Age Diameter
M M yr−1 Myr pc 1 3.91 ± 0.02 −2.09 ± 0.03 1.02 ± 0.21 – 2 3.94 ± 0.43 −3.23 ± 0.24 8.31 ± 2.94 – 3 4.53 ± 0.06 −3.30 ± 0.06 14.36 ± 0.99 483.0 ± 4.6 4 3.62 ± 0.36 −3.28 ± 0.14 6.07 ± 2.51 508.7 ± 14.9 5 3.62 ± 0.23 −2.79 ± 0.23 3.63 ± 2.86 327.1 ± 3.2 6 3.13 ± 0.23 −3.06 ± 0.16 2.16 ± 2.01 129.9 ± 3.4 7 5.13 ± 0.14 −3.95 ± 0.14 24.74 ± 1.85 171.1 ± 6.5 8 3.62 ± 0.09 −3.49 ± 0.10 8.28 ± 1.52 934.1 ± 17.6 9 3.67 ± 0.15 −3.38 ± 0.17 7.67 ± 2.18 75.8 ± 4.0 10 4.72 ± 0.25 −3.93 ± 0.17 23.18 ± 10.75 – 11 4.81 ± 0.23 −3.80 ± 0.23 22.36 ± 7.44 239.6 ± 4.2 12 4.27 ± 0.19 −3.12 ± 0.05 10.19 ± 2.03 295.2 ± 2.0 13 3.74 ± 0.10 −3.60 ± 0.06 10.22 ± 1.25 – 14 2.70 ± 0.30 −3.69 ± 0.25 3.39 ± 2.50 – 15 3.40 ± 0.18 −3.77 ± 0.08 8.63 ± 1.44 – 16 5.29 ± 0.42 −4.51 ± 1.45 70.54 ± 47.12 – 17 4.99 ± 0.26 −4.43 ± 0.66 34.30 ± 14.07 – 18 4.42 ± 0.19 −4.03 ± 0.11 19.13 ± 2.66 – 19 4.37 ± 0.16 −2.33 ± 0.27 5.42 ± 2.40 – 20 5.82 ± 0.05 – 157.30 ± 38.21 – 21 5.49 ± 0.03 −3.43 ± 0.07 23.36 ± 1.17 – 22 3.93 ± 0.35 −3.66 ± 0.11 11.78 ± 2.82 – 23 4.72 ± 0.29 −3.33 ± 0.07 15.81 ± 2.06 – 24 5.29 ± 0.34 −5.71 ± 1.78 101.90 ± 59.92 460.9 ± 14.5 25 5.02 ± 0.37 −5.29 ± 1.47 77.34 ± 48.48 302.6 ± 8.3 26 4.94 ± 0.33 −5.47 ± 1.20 62.88 ± 35.02 – 27 3.85 ± 0.60 −3.82 ± 0.14 12.33 ± 6.20 – 28 3.61 ± 0.27 −3.09 ± 0.14 4.97 ± 1.55 – 29 5.68 ± 0.08 – 135.04 ± 23.71 – 30 4.81 ± 0.14 – 67.38 ± 19.17 – 31 5.56 ± 0.11 −4.55 ± 1.11 74.04 ± 23.45 – 32 5.58 ± 0.06 – 98.98 ± 14.48 – 33 5.74 ± 0.05 – 189.87 ± 21.04 – 34 6.01 ± 0.03 – 257.35 ± 20.25 – 35 5.19 ± 0.07 – 112.56 ± 39.00 – 36 4.91 ± 0.08 −5.88 ± 1.10 58.65 ± 24.05 – 37 4.37 ± 0.30 −5.02 ± 0.75 36.71 ± 17.70 – 38 3.87 ± 0.24 −4.73 ± 0.44 22.98 ± 7.76 – 39 3.95 ± 1.31 −3.75 ± 0.35 14.90 ± 26.69 96.1 ± 3.8 40 3.59 ± 0.44 −3.95 ± 0.14 11.20 ± 3.23 – 41 3.46 ± 0.55 −3.87 ± 0.17 9.16 ± 3.42 – 42 6.68 ± 0.02 – 295.63 ± 14.78 – 43 4.90 ± 0.11 – 82.68 ± 46.63 – 44 4.92 ± 0.21 – 79.51 ± 31.47 – 45 4.73 ± 0.32 −4.91 ± 0.81 42.22 ± 22.32 – 46 3.80 ± 0.32 −4.26 ± 0.18 16.58 ± 5.32 – 47 4.53 ± 0.31 −6.00 ± 1.36 68.15 ± 37.70 – 48 4.57 ± 0.35 −5.42 ± 1.10 57.26 ± 34.39 – 49 3.78 ± 0.19 −4.85 ± 0.37 22.48 ± 5.93 – 50 5.36 ± 0.07 −5.92 ± 1.52 66.41 ± 20.87 – 51 4.33 ± 0.18 −5.21 ± 0.75 34.70 ± 11.35 – 52 4.18 ± 0.20 −4.88 ± 0.47 27.28 ± 8.08 – 53 2.82 ± 0.20 −3.74 ± 0.31 4.68 ± 2.46 77.0 ± 7.7 54 5.29 ± 0.09 – 84.37 ± 35.80 – 55 4.43 ± 0.31 −5.27 ± 0.85 43.25 ± 22.36 – 56 3.50 ± 0.07 −3.65 ± 0.08 8.65 ± 1.28 281.6 ± 5.9 57 6.35 ± 0.02 – 283.92 ± 15.31 – 58 5.12 ± 0.51 −4.40 ± 0.41 79.20 ± 79.80 – 59 4.90 ± 0.10 – 86.99 ± 20.37 – 60 6.40 ± 0.02 – 294.89 ± 14.74 –
within the selected UV region. This last condition is required to avoid HII regions formed by distinct associations of newly formed stars, for which a measure of a diameter might be meaningless. This measurement is performed using the GALFIT code (Peng et al. 2002,2010) run on the narrow-band Hα image by assuming a Gaussian profile for the HIIregion and using an
Fig. 9. Relationship between the age determined assuming [NII]λ6583/Hα = 0.2 and A(Hα) = 0.7 (X-axis) and that assum-ing [NII]λ6583/Hα = 0.1 and A(Hα) = 0.0 (Y-axis). Filled dots indicates the HIIregions where the SED fitting gives reduced χ2
r < 6,
empty dots χ2
r ≥ 6. The black solid lines show the 1:1 relations.
empirical PSF image derived from 138 non-saturated stars in the narrow-band image of NGC 4254. We adopt as diameter of the HIIregion the diameter including 80% of the total flux. When σ is the width parameter of the GALFIT Gaussian model, the diameter including 80% of the total flux is Diameter = 1.3 × σ. The diameters of these HII regions are given in Table 2. We then compare the age-size relation of the extraplanar HII of NGC 4524 (where here the age is the one derived from SED fitting) to the dynamical age vs. size relation of HIIregions in the LMC in Fig.113. We also notice that none of these regions are outliers in Fig.8.
Despite a possible large uncertainty on the measure of the diameter of the HII regions due to the size close to the see-ing limit and to a possible blendsee-ing of multiple star clusters, Figure11shows that the age derived from the SED fitting analy-sis is larger than the dynamical age expected for HIIregions of similar size. This suggests that the ages derived from CIGALE are probably upper limits, as is indeed expected given the limits of the stellar population synthesis codes to derive ages younger than a few million years.
6. Discussion
6.1. Detection of the stripped material
The first result of the present analysis is a further confirma-tion that the detecconfirma-tion of the material stripped from a perturbed galaxy in rich environments requires multi-frequency observa-tions to trace the different gas, dust, and stellar components. There are, indeed, several examples where the stripped mate-rial is mainly cold HI gas not associated with any process
3 The diameters of the HIIregions in the LMC are isophotal. Given
the small size of the HIIregion on the image, and the unknown surface-brightness limit used inAmbrocio-Cruz et al. (2016), we decided to use the Diameter definition given above as a representative measure of the size of these extraplanar HIIregions. We caution that part of the systematic misalignment observed in Fig.11can be due to the different definition of the size used for the two sets of data.
Fig. 10. Relationship between the stellar mass (left panel), the star formation rate (centre panel), and the mean age of the stellar population (right panel) derived with CIGALE on the observed data (abscissa) and that derived on the mock catalogue as described in Sect.3(ordinate). Black filled dots are for Hα fluxes corrected for [NII] contamination and dust attenuation assuming [NII]λ6583/Hα = 0.2 and A(Hα) = 0.7 (see Sect.5.1), blue open circles assuming [NII]λ6583/Hα = 0.1 and A(Hα) = 0.0. The black solid lines show the 1:1 relations.
Fig. 11.Dynamical age vs. size relation derived for HIIregions in the LMC (red symbols,Ambrocio-Cruz et al. 2016) is compared to the age vs. size relation derived from SED fitting for the extraplanar HIIregions in NGC 4254 (black filled dots). The vertical dashed line indicates the limiting seeing of the r- and narrow-band images. The black solid line shows the best fit for HIIregions in the LMC: log(age) = 0.86(±0.03) × log(Diameter) −1.58(±0.06), R2= 0.88.
of star formation (Chung et al. 2007; Boissier et al. 2012;
Scott et al. 2012). This gas can also be in the cold molecular
phase whenever giant molecular clouds associated with star-forming regions are present (Verdugo et al. 2015;Jáchym et al. 2017), although this gas phase is not always detected (Jáchym
et al. 2013), or in warm H2(Sivanandam et al. 2014). Some of
the tails are also detected as diffuse structures in Hα (ionised
gas; Gavazzi et al. 2001; Yoshida et al. 2002; Cortese et al.
2006; Yagi et al. 2007, 2010, 2017; Sun et al. 2007; Kenney
et al. 2008;Fossati et al. 2012,2016;Zhang et al. 2013;Boselli & Gavazzi 2014; Fumagalli et al. 2014), in X-rays (Sun et al. 2006,2007,2010), or in radio continuum (Gavazzi & Jaffe 1985,
1987; Gavazzi et al. 1995). Others are detected mainly in UV
and optical bands because of the presence of compact stellar regions formed after the interaction, as observed in the wake
of IC 3418 in Virgo (Hester et al. 2010;Fumagalli et al. 2011;
Kenney et al. 2014) or the jellyfish galaxies ofPoggianti et al.
(2017).
In the case of NGC 4254, the stripped material has been detected in HI (Phookun et al. 1993;Haynes et al. 2007), while the compact HIIregions are clearly visible only in the GALEX UV bands, or in the deep Hα image, but only within.20 kpc of the edge of the galaxy disc, while they are totally absent in the outer HI tail. Due to their very young age, they are almost unde-tected in the deep NGVS optical bands. NGC 4254 would thus be absent in a selection of perturbed galaxies such as the one done in the optical B-band byPoggianti et al.(2017) (GASP survey). 6.2. Impact of a stochastic IMF on the dating of the HII
regions
The analysis indicates that the observed regions have Hα lumi-nosities of 1037 . L(Hα) . 1039 erg s−1, which is typical
of giant HII regions in the Milky Way or in nearby galax-ies, and ages . 100 Myr. Given their luminosity and stellar mass (Mstar & 104M ), these HII regions straddle the
bound-ary of mass at which stochastic sampling of the IMF starts to play a role (Fumagalli et al. 2011; da Silva et al. 2012;
Cerviño et al. 2013). At this luminosity, the HIIregions should include ∼1000 stars (Lee et al. 2011) and quite a few ionis-ing objects (Elmegreen 2000; Koda et al. 2012). Nevertheless, Mstar ' 104M is close to the limit where the undersampling
of the IMF starts to be important for the determination of the ionising stellar component using population synthesis models (Cerviño et al. 2003,2013;Cerviño & Luridiana 2004;da Silva
et al. 2012). If the IMF is undersampled, however, the observed
Hα luminosity at constant age is on average less than that pre-dicted by our fully sampled population synthesis models. Thus, the ages of the HIIregions may be on average overestimated for the smallest HII regions. This effect would not alter our main conclusion that the extraplanar HII regions of NGC 4254 are young (.100 Myr).
6.3. Star formation process within extraplanar HIIregions IFU observations of the stripped gas of cluster galaxies indicate that star formation only occurs when the velocity dispersion in the tail is sufficiently low (σ ∼ 25−50 km s−1;
Fumagalli et al. 2014; Fossati et al. 2016; Consolandi et al.
These velocities dispersions are comparable to those observed over the disc of the galaxy by Wilson et al. (2011). ALMA observations are necessary to detect the molecular gas in these compact regions and derive its typical column density and veloc-ity dispersion. Indeed, none of the few HIIregions mapped with HERA are detected in the 12CO(2–1) line (Leroy et al. 2009).
This is not surprising if the extraplanar star forming regions of NGC 4254 have been formed within GMCs having properties similar to those observed within the Milky Way or in nearby spiral galaxies, for example, masses in the range 5 × 10⁴ .
MGMC . 5 × 10⁶M , sizes 5 . RGMC . 30 pc, and thus gas
column densities Σ(H2) ' 170 M pc−2 and volume densities
50. n(H2). 500 cm−3(Solomon et al. 1987;Engargiola et al.
2003). At a distance of 16.5 Mpc the filling factor of these typ-ical GMCs is '10%, thus the total CO emission is sufficiently diluted not to be detected within a 13 arcsec beam. Furthermore, the CO emission should also be low because of the expected low metallicity of the gas.
At these column densities, the typical collapse time (free fall time) for a cloud with a spherically symmetric distribution of mass is:
tf f =
s 3π
32Gρ ' 5 Myr, (4)
where ρ is the mean density of the gas. This timescale can be compared with the time since the first interaction of the galaxy with a nearby companion, which dynamical simulations place between 280 Myr (Vollmer et al. 2005) and 750 Myr ago (Duc &
Bournaud 2008), and with the typical age of the stellar
popula-tions of the HIIregions (.100 Myr). The stripped gas must have
reached the typical column density of GMC in .40 Myr (see next section) to produce the observed extraplanar HIIregions. The densest regions detected at the VLA in the HI tail have column densities of Σ(HI) ' 1019 cm−2 (Fig. 4; Chung et al. 2009) and are unresolved at the ∼30 arcsec beam resolution. Assuming a filling factor of ∼10%, and a clumpy distribution, it is possible that the HI gas reaches column densities similar to those encountered in the outer discs of late-type galaxies produc-ing molecular clouds where star formation takes place. Indeed, star formation seems to follow the typical Schmidt–Kennicutt relation in tidal debries (Boquien et al. 2011). However, the phys-ical conditions of the stripped gas within a hot intergalactic medium (gravitational potential, pressure, temperature, turbu-lence) change significantly with respect to the typical ISM in galactic discs, and it is still unclear why in these outer regions the gas collapses to form giant HIIregions while at further dis-tances from the galaxy along the tail or in other similar objects within the same cluster it does not (e.g. NGC 4569;Boselli et al. 2016a). In particular, in these extraplanar HIIregions the lack of a dominant galactic potential well should reduce the hydrostatic pressure of the gas, and thus prevent the formation of molecular gas (Blitz & Rosolowsky 2006). However, turbulence and shock fronts produced by the gravitational perturbation or by the ram pressure that the galaxy is suffering while entering into the clus-ter can compress the gas and lead to H2formation (Tonnesen &
Bryan 2010,2012). In NGC 4254 the stripping of the gas seems
to occur mostly edge-on. Simulations suggest that in this geo-metrical configuration the gas, located in a thin disc before the interaction, is dispersed to a lesser extent than in a face-on strip-ping process, thus favouring the formation of molecular clouds (Roediger & Brüggen 2006).
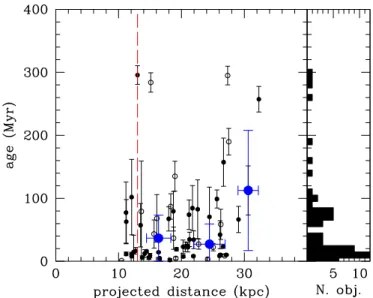
Figure12 shows the relation between the age of the stellar population of the different HIIregions and their projected dis-tance from the nucleus of the galaxy. There is no obvious trend between the two quantities, implying that there is no strong dif-ferential evolution of these regions after the perturbation. We recall, however, that all these regions are located within '35 kpc in projected distance from the galaxy nucleus, corresponding to '2 optical radii of the galaxy. This small distance range probably corresponds to a small dynamic range in stellar age which is dif-ficult to resolve with a simple SED fitting analysis, particularly with a sample characterised by a low detection rate at several wavelengths.
6.4. Fate of the stripped material
Considering the line-of-sight motion of NGC 4254 within the cluster we can estimate the time necessary to travel ∼30 kpc from the galaxy, the mean projected distance of the HIIregions. NGC 4254 is a member of the northern cloud of the Virgo cluster (Gavazzi et al. 1999) and has a relative velocity of ∼1400 km s−1 with respect to the cluster centre. Assuming that the galaxy is moving on the plane of the sky with the typical velocity dispersion of the cluster ('800 km s−1; Boselli et al. 2014b), it would have traveled ∼30 kpc in ∼40 Myr. In the same time the galaxy would have crossed ∼55 kpc along the line of sight. This rough estimate suggests that the furthest HIIregions are at RHII ∼60 kpc from the nucleus of the galaxy. At this distance
these HIIregions are still gravitationally bound to NGC 4254. Indeed, the truncation radius RT of the galaxy, which lies at a
projected distance of RM87∼ 1 Mpc from the core of the cluster
(M87) is (Binney & Tremaine 2008):
RT = RM87×
MNGC4254,DM
3 × MVirgo,DM
!1/3
, (5)
where MNGC4254,DMis the total (dark matter) mass of NGC 4254
and MVirgo,DM that of the Virgo cluster. Assuming MVirgo,DM =
4 × 10¹⁴M (McLaughlin 1999) and MNGC4254,DM= 1012M as
derived fromBehroozi et al. (2010) for a stellar mass of NGC 4254 of MNGC4254,star = 2.4 × 10¹⁰M , the truncation radius of
NGC 4254 is RT ' 95 kpc. These regions are within the
trunca-tion radius of the galaxy and might thus fall back on the disc. However, the HI observations ofPhookun et al.(1993) suggest that the HI clouds associated with these regions have a reces-sional velocity along the line of sight that is ∼200 km s−1lower than that of the galaxy (see Fig.4), corresponding to ∼340 km s−1
in three-dimensional space. This value is close to the escape velocity from a spherically symmetric solid body given by the relation: ve= s 2GMNGC4254,DM RHII , (6)
that for the furthest HIIregions (RHII∼ 60 kpc) is ∼390 km s−1.
Furthermore, the galaxy moving towards the cluster centre is undoubtedly undergoing a strong ram pressure event as clearly seen in the asymmetric distribution of the radio continuum emis-sion (Kantharia et al. 2008) and of the HI gas over its disc, with an extended tail in the northern direction (Phookun et al.
1993;Kantharia et al. 2008). This external pressure might have
favoured the formation of GMCs (Blitz & Rosolowsky 2006), although some clouds might have been stripped from the wester spiral arm during the interaction. Here, ram pressure is indeed
Fig. 12.Left panel: relationship between the age of the different HII
regions as derived from CIGALE (in Myr) and their projected distance from the nucleus of NGC 4254 (in kpc). Filled or empty dots indicate the HIIregions where the SED fitting gives reduced χ2
r < 6 or χ2r≥ 6,
respectively. Blue big filled dots indicate the median values within dif-ferent distance bins. The red long-dashed vertical line indicates the 23.5 mag arcsec−2i-band isophotal radius of the galaxy given inCortese
et al.(2012b). Right panel: age distribution of all the HIIregions.
made more efficient than elsewhere in the disc because of the combined effect of the edge-on motion of the galaxy within the cluster and its clockwise rotation. The HI gas blobs asso-ciated with the extraplanar HII regions are suffering the same ram pressure event affecting the galaxy, as indeed suggested by their lower recessional velocity with respect to NGC 4254 ('200 km s−1, see Fig. 4), preventing them from falling back
onto the stellar disc. Given these considerations, while keeping in mind the large uncertainties on all the rough calculations made above, it is possible that some of the extraplanar HIIregions will become free-floating objects within the cluster, as indeed indi-cated by the dynamical simulations ofDuc & Bournaud(2008). In that case, these compact stellar objects could contribute to the diffuse intracluster light of Virgo (Mihos et al. 2005,2009,
2017). Because of their compact nature and their single-age stellar populations, these regions could be the progenitors of globular clusters, diffuse star clusters (DSC), and ultra compact dwarf galaxies (UCD), mainly observed around the dominant massive elliptical galaxies in nearby clusters (Peng et al. 2006;
Liu et al. 2015, 2016). Their stellar masses (see Table 2 and
Fig. 5) are less than those of typical UCDs and globular clus-ters, but these latter objects have been formed several Gyr ago, when the typical gas content of galaxies was significantly larger than in similar objects in the local universe. It is thus plausible that high-speed fly-by encounters of gas-rich galaxies in form-ing clusters at high redshift might have produced more massive compact objects than those observed around NGC 4254, giv-ing birth to globular clusters, DSCs, and UCDs such as those observed in the local universe. The properties of the extraplanar HIIregions of NGC 4254 in terms of stellar mass are compa-rable to those observed in other Virgo cluster compact sources formed after a gravitational perturbation between galaxies (M 49 – VCC 1249;Arrigoni Battaia et al. 2012) or by ram pres-sure stripping (IC 3418 –Hester et al. 2010;Fumagalli et al. 2011;
Kenney et al. 2014). They are remarkably similars to those of
the ultra-compact high-velocity cloud AGC 226067, a possible
stripping remnant in the Virgo cluster, characterised by a sin-gle stellar population with an age of '7–50 Myr (Sand et al. 2017).
7. Conclusion
Very deep Hα images obtained during the VESTIGE survey of the Virgo cluster ( f (Hα) ∼ 4 × 10⁻¹⁷erg s−1cm−2 for point
sources at 5σ andΣ(Hα) ∼ 2 × 10⁻¹⁸erg s−1cm−2arcsec−2 for extended sources at 1σ), combined with UV GALEX and opti-cal NGVS data, reveal the presence of 60 compact (70–500 pc) star-forming regions outside the optical disc of the massive spi-ral galaxy NGC 4254 (M99). These regions are located along the tail of HI gas harassed from the galaxy after a gravitational interaction with another Virgo cluster member that simulations indicate occurred between 280 and 750 Myr ago (Vollmer et al. 2005;Duc & Bournaud 2008). The analysis of their stellar pop-ulations, as well as their physical sizes, consistently indicate that these regions are young (.100 Myr). These observations offer new observational constraints for models and simulations of star formation in the stripped gas of cluster galaxies. Con-sistent with other observations of perturbed galaxies, these data indicate that the process of star formation outside the disc of galaxies is very episodic, lasts for a few million years, and occurs only in compact regions. The velocity dispersion of the gas in these compact regions is expected to be sufficiently low to allow matter to collapse and form GMCs able to shield the gas from the external heating due to the hot intracluster medium. A com-plete multiphase modelling of the star formation process within these extreme regions requires more observational constraints on the different gas phases (HI, H2, X-rays), as well as
high-resolution spectroscopy for the determination of their kinematic and physical properties.
Acknowledgements.We thank the anonymous referee for useful comments on the manuscript. We are grateful to M. Haynes for providing us with the HI data of NGC 4254, to C. Spengler for the use of GALFIT, and to the whole CFHT team who assisted us in the preparation and in the execution of the observations and in the calibration and data reduction: Todd Burdullis, Daniel Devost, Bill Mahoney, Nadine Manset, Andreea Petric, Simon Prunet, Kanoa Withington. We acknowledge financial support from “Programme National de Cosmologie and Galaxies” (PNCG) funded by CNRS/INSU-IN2P3-INP, CEA and CNES, France, and from “Projet International de Coopération Scientifique” (PICS) with Canada funded by the CNRS, France. This research has made use of the NASA/IPAC Extragalactic Database (NED) which is operated by the Jet Propulsion Laboratory, California Institute of Technology, under contract with the National Aeronautics and Space Administration and of the GOLD-Mine database (http://goldmine.mib.infn.it/;Gavazzi et al. 2003). MB was supported by MINEDUC-UA projects, code ANT 1655 and ANT 1656. MS acknowledges support from the NSF grant 1714764 and the Chandra Award GO6-17111X. MF acknowledges support by the science and technology facilities council [grant number ST/P000541/1].
References
Ambrocio-Cruz, P., Le Coarer, E., Rosado, M., et al. 2016, MNRAS, 457, 2048
Arrigoni Battaia, F., Gavazzi, G., Fumagalli, M., et al. 2012,A&A, 543, A112
Behroozi, P. S., Conroy, C., & Wechsler, R. H. 2010,ApJ, 717, 379
Bekki, K., Koribalski, B. S., & Kilborn, V. A. 2005,MNRAS, 363, L21
Bellhouse, C., Jaffé, Y. L., Hau, G. K. T., et al. 2017,ApJ, 844, 49
Bendo, G. J., Galliano, F., & Madden, S. C. 2012,MNRAS, 423, 197
Binney, J., & Tremaine, S. 2008, inGalactic Dynamics, 2nd edn. (Princeton: Princeton University Press)
Blakeslee, J. P., Jordán, A., Mei, S., et al. 2009,ApJ, 694, 556
Blitz, L., & Rosolowsky, E. 2006,ApJ, 650, 933
Boissier, S., Boselli, A., Duc, P.-A., et al. 2012,A&A, 545, A142
Boquien, M., Duc, P.-A., Braine, J., et al. 2007,A&A, 467, 93


![Fig. 9. Relationship between the age determined assuming [NII]λ6583/Hα = 0.2 and A(Hα) = 0.7 (X-axis) and that assum-ing [NII]λ6583/Hα = 0.1 and A(Hα) = 0.0 (Y-axis)](https://thumb-eu.123doks.com/thumbv2/123doknet/14782899.597385/11.892.55.446.145.1033/fig-relationship-determined-assuming-nii-hα-hα-assum.webp)