HAL Id: hal-00303994
https://hal.archives-ouvertes.fr/hal-00303994
Submitted on 27 Feb 2008HAL is a multi-disciplinary open access
archive for the deposit and dissemination of sci-entific research documents, whether they are pub-lished or not. The documents may come from teaching and research institutions in France or abroad, or from public or private research centers.
L’archive ouverte pluridisciplinaire HAL, est destinée au dépôt et à la diffusion de documents scientifiques de niveau recherche, publiés ou non, émanant des établissements d’enseignement et de recherche français ou étrangers, des laboratoires publics ou privés.
Analysis of aircraft and satellite measurements from the
intercontinental chemical transport experiment
(INTEX-B) to quantify long-range transport of East
Asian Sulfur to Canada
A. van Donkelaar, R. V. Martin, W. R. Leaitch, A. M. Macdonald, T. W.
Walker, D. G. Streets, Q. Zang, E. Dunlea, J. L. Jimenez, J. E. Dibb, et al.
To cite this version:
A. van Donkelaar, R. V. Martin, W. R. Leaitch, A. M. Macdonald, T. W. Walker, et al.. Analysis of aircraft and satellite measurements from the intercontinental chemical transport experiment (INTEX-B) to quantify long-range transport of East Asian Sulfur to Canada. Atmospheric Chemistry and Physics Discussions, European Geosciences Union, 2008, 8 (1), pp.4017-4057. �hal-00303994�
ACPD
8, 4017–4057, 2008Long-range transport of East Asian sulfur
to Canada
A. van Donkelaar et al.
Title Page Abstract Introduction Conclusions References Tables Figures ◭ ◮ ◭ ◮ Back Close
Full Screen / Esc
Printer-friendly Version Interactive Discussion
Atmos. Chem. Phys. Discuss., 8, 4017–4057, 2008 www.atmos-chem-phys-discuss.net/8/4017/2008/ © Author(s) 2008. This work is distributed under the Creative Commons Attribution 3.0 License.
Atmospheric Chemistry and Physics Discussions
Analysis of aircraft and satellite
measurements from the intercontinental
chemical transport experiment (INTEX-B)
to quantify long-range transport of East
Asian Sulfur to Canada
A. van Donkelaar1, R. V. Martin1,2, W. R. Leaitch3, A. M. Macdonald3,
T. W. Walker1,4, D. G. Streets5, Q. Zhang5, E. J. Dunlea6, J. L. Jimenez6, J. E. Dibb7,
G. Huey8, R. Weber8, M. O. Andreae9
1
Dept. of Physics and Atmospheric Science, Dalhousie University, Halifax, Nova Scotia, Canada
2
Harvard-Smithsonian Center for Astrophysics, Cambridge, Massachusetts, USA
3
Science and Technology Branch, Environment Canada, Toronto, Ontario, Canada
4
Dept. of Physics, University of Toronto, Ontario, Canada
5
Decision and Information Sciences Division, Argonne National Lab., Aragonne, Illinois, USA
6
Department of Chemistry and Biochemistry, and Cooperative Institute for Research in the En-vironmental Sciences (CIRES), University of Colorado, Boulder, Colorado, USA
7
Climate Change Research Center/EOS, University of New Hampshire, USA
8
School of Earth and Atmospheric Sciences, Georgia Institute of Technology, Atlanta, Georgia, USA
9
ACPD
8, 4017–4057, 2008Long-range transport of East Asian sulfur
to Canada
A. van Donkelaar et al.
Title Page Abstract Introduction Conclusions References Tables Figures ◭ ◮ ◭ ◮ Back Close
Full Screen / Esc
Printer-friendly Version Interactive Discussion
Received: 11 December 2007 – Accepted: 22 January 2008 – Published: 27 February 2008 Correspondence to: A. van Donkelaar (aaron.van.donkelaar@dal.ca)
Published by Copernicus Publications on behalf of the European Geosciences Union.
ACPD
8, 4017–4057, 2008Long-range transport of East Asian sulfur
to Canada
A. van Donkelaar et al.
Title Page Abstract Introduction Conclusions References Tables Figures ◭ ◮ ◭ ◮ Back Close
Full Screen / Esc
Printer-friendly Version Interactive Discussion
Abstract
We interpret a suite of satellite, aircraft, and ground-based measurements over the North Pacific Ocean and western North America during April–May 2006 as part of the Intercontinental Chemical Transport Experiment Phase B (INTEX-B) campaign to understand the implications of long-range transport of East Asian emissions to North 5
America. The Canadian component of INTEX-B included 33 vertical profiles from a Cessna 207 aircraft equipped with an aerosol mass spectrometer. Long-range trans-port of organic aerosols was insignificant. Measured sulfate plumes in the free tropo-sphere over British Columbia exceeded 1 µg/m3. We update the global anthropogenic emission inventory in a chemical transport model (GEOS-Chem) and use it to interpret 10
the observations. Trends in Aerosol Optical Depth (AOD) retrieved from two satel-lite instruments (MISR and MODIS) for 2000–2006 are analyzed with GEOS-Chem to estimate an annual growth in Chinese sulfur emissions of 6.2% and 9.6%, respec-tively. Analysis of aircraft sulfate measurements from the NASA DC-8 over the central Pacific, the NSF C-130 over the east Pacific and the Cessna over British Columbia 15
indicates most Asian sulfate over the ocean is in the lower free troposphere (800– 600 hPa), with a decrease in pressure toward land due to orographic effects. We cal-culate that 63% of the measured sulfate at 600 hPa over British Columbia is due to East Asian sources. Simulation of INTEX-B and May 1985 aircraft measurements off the northwest coast of the United States reveals a 2.4–3.4 fold increase in the relative 20
contribution of East Asian sulfate to the total burden. Campaign-average simulations indicate anthropogenic East Asian sulfur emissions increase mean springtime sulfate in Western Canada at the surface by 0.14–0.19 µg/m3 (∼30%) and account for 40% of the overall regional sulfate burden between 1 and 5 km. Mean measured daily sur-face sulfate concentrations taken in the Vancouver area increase by 0.27 µg/m3 per 25
10% increase in the simulated fraction of Asian sulfate, suggesting current East Asian emissions degrade local air quality.
ACPD
8, 4017–4057, 2008Long-range transport of East Asian sulfur
to Canada
A. van Donkelaar et al.
Title Page Abstract Introduction Conclusions References Tables Figures ◭ ◮ ◭ ◮ Back Close
Full Screen / Esc
Printer-friendly Version Interactive Discussion
1 Introduction
The transport of Asian emissions to North America has been well documented (e.g. Parrish et al., 1992; Jaffe et al., 1999; Bertschi et al., 2004; Liang et al., 2004; Park et al., 2004). Andreae et al. (1988) measured sulfate (SO=4) concentrations off the northwest coast of the United States in May 1985, and attributed enhancements in the 5
free troposphere to Asian sources. Asian emissions of sulfur oxides (SOx≡SO2+SO=4)
are dominated by SO2and have grown substantially over the last two decades (Streets and Waldhoff, 2000). They increasingly impact North America, affecting both regional air quality (Park et al., 2004; Heald et al., 2006) and climate (Ming et al., 2007). Addi-tional analysis of in-situ and remote-sensed observations are needed to quantify this 10
long-range transport and its implications.
Sirois and Barrie (1999) analyzed aerosol composition between 1980 and 1995 to infer the presence of Eurasian SO=4 in the Canadian Arctic between those dates. During the Polar Sunrise Experiment in 1992 at Alert, Canada, concentrations of SOx were
well correlated with long-range transport of fine anthropogenic aerosol (Barrie et al., 15
1994). Asian pesticides have been observed in the Yukon Territory, Canada, as a result of transpacific flow (Bailey et al., 2000). The influence of long-range transport to Canada is not limited to remote regions, and is especially relevant in populated areas. Asian pesticides have also been transported to the Fraser Valley, British Columbia (Harner et al., 2005). Dust transport to western Canada has been observed from as 20
far as the Sahara Desert (McKendry et al., 2007) and Asian fine dust provides an estimated median 1.2 µg/m3 in surface air over the western United States in spring (Fairlie et al., 2007). Chinese dust has also been observed in British Columbia’s Lower Fraser Valley (McKendry et al., 2001) and can be linked to SO=4 transport through the uptake of sulfur dioxide (SO2) on dust (Jordan et al., 2003; Song et al., 2007).
25
Satellite observations offer a top-down constraint on emissions. Previous work in-cludes absolute emissions of nitrogen oxides (Leue et al., 2001; Martin et al., 2003a; Jaegl ´e et al., 2005; M ¨uller and Stavrakou, 2005), volatile organic compounds (Palmer
ACPD
8, 4017–4057, 2008Long-range transport of East Asian sulfur
to Canada
A. van Donkelaar et al.
Title Page Abstract Introduction Conclusions References Tables Figures ◭ ◮ ◭ ◮ Back Close
Full Screen / Esc
Printer-friendly Version Interactive Discussion
et al., 2003; Fu et al., 2007), and carbon monoxide (Arellano et al., 2004; Heald et al., 2004; P ´etron et al., 2004), as well as trends in nitrogen oxide (Richter et al., 2005; van der A et al., 2006; Zhang et al., 2007) emissions. The clearest signals in current SO2
retrievals are of volcanic activity (Khokar et al., 2005), although anthropogenic activity has also been detected (Eisinger and Burrows, 1998; Krotkov et al., 2006; Carn et 5
al., 2007). In some regions satellite-retrieved Aerosol Optical Depth (AOD) is closely related to SO2 emissions through production of SO=4 (Massie et al., 2004; Dubovik et
al., 2007).
Although direct emission of Asian aerosol may be readily scavenged near its source due to wet deposition, SO2emissions can still escape to the free troposphere prior to
10
SO=4 conversion and then transported across the Pacific Ocean (Brock et al., 2004). Elevated aerosol concentrations, attributed to East Asian combustion sources, have been observed reaching North America near the Canadian border at Cheeka Peak (Jaffe et al., 1999).
Springtime weather patterns generally produce the strongest seasonal outflow from 15
Asia (Jacob et al., 2003; Liu et al., 2005), and therefore a pronounced influence of Asian emissions upon the North American continent. During April and May 2006, the Intercontinental Chemical Transport Experiment, Phase B (INTEX-B) set out to assess this influence using a combination of aircraft and satellite measurements throughout the northeastern pacific (Singh et al.1). This NASA-driven initiative constituted the 20
second half of the INTEX project, and was designed to improve the understanding of gas and aerosol transformation and transport on transcontinental and intercontinental scales.
In this paper we investigate the long-range transport of East Asian SO=4 to Canada. Section 2 presents the aircraft component of the Canadian contribution to INTEX-B 25
and outlines the other instruments, platforms and the model used in this study. In
1
Singh, H. B., Brune, W. H., Crawford, J. H., et al.: An overview of the INTEX-B campaign: Transport and transformation of pollutants over the Pacific and the Gulf of Mexico, Atmos. Chem. Phys., in preparation, 2008.
ACPD
8, 4017–4057, 2008Long-range transport of East Asian sulfur
to Canada
A. van Donkelaar et al.
Title Page Abstract Introduction Conclusions References Tables Figures ◭ ◮ ◭ ◮ Back Close
Full Screen / Esc
Printer-friendly Version Interactive Discussion
Sect. 3, we estimate the recent growth in East Asian SOxemissions based upon remote sensing measurements. Section 4 combines data from a chemical transport model with in-situ measurements to characterize the Asian sulfur transport to Canada. A case study of an Asian plume is presented in Sect. 5, along with the implications for Canadian air quality. Conclusions are in Sect. 6.
5
2 INTEX-B platforms
Here we introduce the aircraft, surface and satellite measurements, and the model used for interpretation.
2.1 In-situ measurements
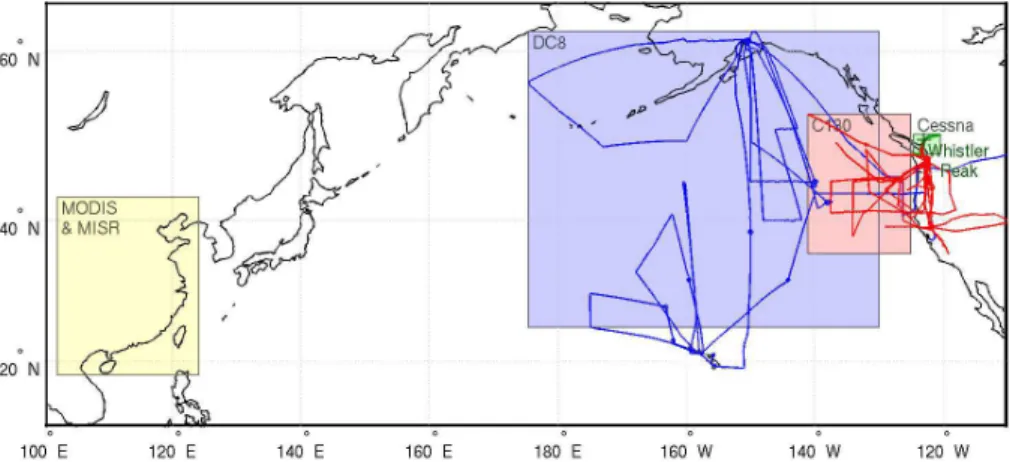
Figure 1 provides an overview of the measurement platforms and regions examined 10
throughout this manuscript. Several aircraft participated in INTEX-B, including the NASA DC-8, the NSF C-130 and a Canadian Cessna 207 described below. Through-out this manuscript, we limit the DC-8 and C-130 measurements to within the boxed regions of Fig. 1 to focus on long-range transport of Asian aerosol to Canada. The DC-8 aircraft utilized both a mist chamber (Cofer et al., 1985) and bulk aerosol fil-15
ters to characterize the SO=4 aerosol load, during 10 flights between 17 April 2006 and 15 May 2006. The size cutoff of the onboard mist chamber system is ∼1 µm (based on estimated particle transmission efficiency through the inlet and sampler) while that of the bulk aerosol filters has been empirically determined to be ∼4.5 µm (McNaughton et al., 2007). Mist chamber sampling periods are less than two minutes 20
and aerosol filters are not exposed longer than 10 to 20 min, depending upon alti-tude. Uncertainties in the reported SO=4 mixing ratios are ∼20% from the mist chamber and ∼25 pptv (∼110 ng/m3) from the filters. A chemical ionization mass spectrometer (CIMS) instrument (Huey et al., 2004; Kim et al., 2007) was also onboard the DC-8 and used for the measurement of SO2 with a sampling frequency of approximately
ACPD
8, 4017–4057, 2008Long-range transport of East Asian sulfur
to Canada
A. van Donkelaar et al.
Title Page Abstract Introduction Conclusions References Tables Figures ◭ ◮ ◭ ◮ Back Close
Full Screen / Esc
Printer-friendly Version Interactive Discussion
3 s. The C-130 platform included a high-resolution time-of-flight aerosol mass spec-trometer (HR-ToF-AMS) (DeCarlo et al., 2006; Canagaratna et al., 2007; Dunlea et al.2) with ∼12 s sampling frequency and a particle-into-liquid sampler (PILS) (We-ber et al., 2001; Peltier et al., 2007) of one minute sampling frequency during its 11 flights between 21 April 2006 and 15 May 2006. AMS particle transmission is approx-5
imately PM1in vacuum aerodynamic diameter (Jayne et al., 2000) with particle
trans-mission efficiency rapidly decreasing for aerosols larger than 0.7 µm (e.g. Rupakheti et al., 2005; Liu et al., 2007). PILS measurements were restricted to particles less than 1 µm (at 1 atm. pressure) aerodynamic diameter via a single-stage micro-orifice impactor (Model 100, MSP Corp.). AMS and PILS sulfate measurement uncertainties 10
are estimated at 25% and 10%, respectively.
Whistler Peak Station (50.1◦N, 122.9◦W, 2182 m) is operated by Environment
Canada and has provided continuous measurements of meteorological data, CO and O3 since its establishment in 2002 (Macdonald et al., 2006). Inorganic filter packs of SO=4, NO−
3 and Ca
+ are also routinely collected and analyzed. In addition to these
15
regular measurements, a HR-ToF-AMS (Sun et al.3) and a Micro-Orifice Uniform De-posit Impactor (MOUDI) were operated at the site for the duration of INTEX-B. The MOUDI was operated with three stages to isolate particles into three nominal size bins of <1 µm, 1–3 µm and >3 µm.
A Cessna 207 aircraft (Leaitch et al.4), supplied by Environment Canada during 20
INTEX-B, contained a suite of instruments designed to capture both gaseous and aerosol pollutants. Aerosol instrumentation included number concentrations of
ultra-2
Dunlea, E., DeCarlo, P. F., Kimmel, J. R., et al.: Evolution of Asian aerosols during transpa-cific transport in INTEX-B, Atmos. Chem. Phys., in preparation, 2008.
3
Sun, Y., Zhang, Q., Leaitch, R. W., et al.: Characterization of Submicron Aerosols at the Whistler Summit, BC Using a High-Resolutuin Time-of-Flight Aerosol Mass Spectrometer dur-ing INTEX-B, Atmos. Chem. Phys., in preparation, 2008.
4
Leaitch, W. R., Macdonald, A. M., Anlauf, K. G., et al.: Vertical Profiles at Whistler, B.C. during INTEX-B, in preparation, 2008.
ACPD
8, 4017–4057, 2008Long-range transport of East Asian sulfur
to Canada
A. van Donkelaar et al.
Title Page Abstract Introduction Conclusions References Tables Figures ◭ ◮ ◭ ◮ Back Close
Full Screen / Esc
Printer-friendly Version Interactive Discussion
fine aerosol (PMS7610), aerosol size distribution (FSSP300: <18 µm and PCASP: <2.5 µm) and aerosol composition by way of a quadrupole aerosol mass spectrometer (Q-AMS) (Rupakheti et al., 2005; Jimenez et al., 2003; Jayne et al., 2000). The Q-AMS detection limits are 40 ng/m3for SO=4 and nitrate and 600 ng/m3for organic aerosol for each one-minute average measurement. Walker et al.5 describe and interpret O3and 5
CO measurements on the Cessna.
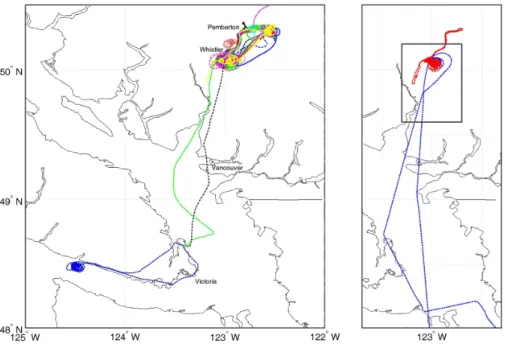
All Cessna 207 flights, shown in Fig. 2, originated outside Pemberton, B. C., 35 km north of Whistler, with the exception of one inter-comparison flight with the C-130, con-ducted on 9 May 2006 along the Canada-US border and related transit. Most Cessna flight tracks consisted of an ascent and descent near Whistler Peak Station before 10
returning to the takeoff site. Thirty-three flights occurred between 22 April 2006 and 17 May 2006, with most extending from the surface to approximately 5 km (550 hPa) altitude and those with valid Q-AMS data occurring mid-late morning to late afternoon. Q-AMS data from the 9 May inter-comparison and several other flights were lost due to radio frequency interference, resulting in a total twenty one flights with successful 15
Q-AMS measurements.
The right panel of Fig. 2 shows the flight paths for the 3 May inter-comparison flight between the Cessna and the C-130. The inter-comparison zone is outlined in grey. The Cessna descent was not completed within the comparison region until approximately 50 min after the C-130 had left the inter-comparison zone. To minimize the effect of 20
sampling time differences, we compare only measurements taken during the Cessna upward spiral against those from the C-130.
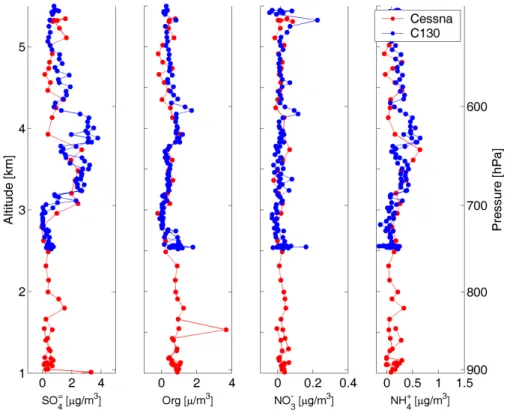
Figure 3 shows the speciated aerosol profiles from both aircraft during this intercom-parison. All measurements are converted to concentrations at standard temperature and pressure of 1013 hPa and 0◦C. Significant agreement is found between the AMS
25
measurements, with respective Root Mean Square Differences (RMSD) and mean bias of, 0.9 and 0.3 µg/m3for SO=4, 0.3 and 0.2 µg/m3for organics, 0.03 and 0.003 µg/m3for
5
Walker, T. W., Martin, R. V., van Donkelaar, A., et al.: Trans-Pacific transport of ozone and reactive nitrogen in spring, in preparatin, 2008.
ACPD
8, 4017–4057, 2008Long-range transport of East Asian sulfur
to Canada
A. van Donkelaar et al.
Title Page Abstract Introduction Conclusions References Tables Figures ◭ ◮ ◭ ◮ Back Close
Full Screen / Esc
Printer-friendly Version Interactive Discussion
nitrate, and 0.2 and −0.0007 µg/m3for ammonium. The largest disagreement is found in SO=4 at approximately 625 hPa, likely representative of a change in air mass, as indi-cated by significant and abnormal disagreement (∼30%) between the relative humidity measurements on the two aircraft. This particular pressure was sampled ∼35 minutes apart. Removal of points between 600 and 650 hPa, decreases the RMSD and bias 5
in SO=4 to 0.6 and −0.01 µg/m3respectively, leaving other species largely unchanged. This is considered good agreement for these sampling conditions.
A collection efficiency (CE) of 0.5 is used for the AMS on the C-130 and is based on many previous intercomparisons (Canagaratna et al., 2007, and references therein), with a correction for increased CE under high acidity conditions (Quinn et al., 2006) 10
and is discussed by Dunlea et al. (in preparation). The CE used with the Cessna AMS is discussed by Leaitch et al. (in preparation).
MOUDI Measurements of the SO=4 size distribution at Whistler Peak during INTEX-B indicate a mean ratio of total SO=4 aerosol to SO=4 below 1 µm in aerodynamic diameter of 1.4. We scale the Cessna SO=4 Q-AMS measurements by this correction factor, 15
which is further justified in section 4, to better represent total SO=4 mass. Airborne measurements off the west coast of Washington State and Oregon in May 1985 found that up to half of the non-seasalt SO=4 mass was above 1.5 µm (Andreae et al., 1988) suggesting either a larger scale factor or a change in the SO=4 size distribution. MOUDI measurements of the NO−
3 size distribution indicate that total NO −
3 aerosol is eight
20
times larger than submicron NO−
3. However, we do not apply a correction factor to
nitrate measurements due to concerns about such a larger scale factor.
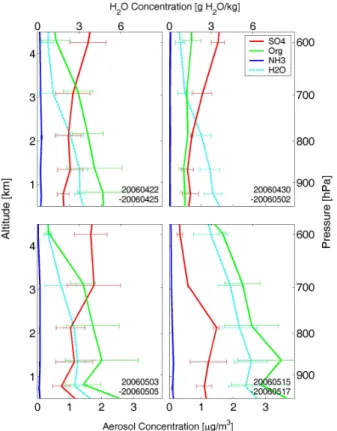
Figure 4 shows average vertical profiles of Cessna Q-AMS and water (H2O)
concen-tration data obtained during four separate enhancement periods. SO=4 concentrations of 1–2 µg/m3 dominate in the free troposphere and tend to increase with altitude, im-25
plying long-range transport. In contrast, organic concentrations typically decrease with altitude and dominate at the surface, implying a local source. These opposing trends suggest that the amount of organics transported with SO=4 is small and that long-range transport of organic aerosols is not a significant contributor to the organic concentration
ACPD
8, 4017–4057, 2008Long-range transport of East Asian sulfur
to Canada
A. van Donkelaar et al.
Title Page Abstract Introduction Conclusions References Tables Figures ◭ ◮ ◭ ◮ Back Close
Full Screen / Esc
Printer-friendly Version Interactive Discussion
in the region studied. Leaitch et al. (in preparation) find a high level of mass closure with Cessna Q-AMS measurements, suggesting that the relatively high Q-AMS de-tection limit for organics (0.4–0.6 µg/m3) has not impacted this conclusion. They also show that the occurrence of increased sulfate usually accompanies an increase in the number and mass concentrations of coarse particles. Dunlea et al. (2007) find that 5
SO=4 concentrations exceed those of organics for all Asian plume intercepts in the C-130, with older air masses being characterized by a larger SO=4/organics ratio than younger ones having undergone more rapid transport, presumably due to additional production of SO=4 during their extended transport time. The organic enhancement over 15 May–17 May is likely fuelled by an unusually high mixed layer depth, as indi-10
cated by the water concentration profile, and can be attributed to local sources. This period is further examined by Zhang et al. (in preparartion) and McKendry et al.6. The contribution of nitrate to particulate mass is relatively insignificant, in part reflecting AMS size restrictions. We focus on long-range transport of SO=4 for the remainder of the manuscript.
15
2.2 Model description
We use the GEOS-Chem chemical transport model v7-04-09 (Bey et al., 2001) (http:
//www-as.harvard.edu/chemistry/trop/geos/index.html) to interpret the aforementioned measurements. GEOS-Chem is driven by assimilated meteorological data from the Goddard Earth Observing System (GEOS-4) at the NASA Global Modeling Assimi-20
lation Office (GMAO), with 30 vertical levels and degraded to the model’s horizontal resolution of 2◦ latitude by 2.5◦longitude.
The aerosol simulation in GEOS-Chem includes the sulfate-nitrate-ammonium sys-tem (Park et al., 2004; Park et al., 2006), carbonaceous aerosols (Park et al., 2003; Liao et al., 2007), mineral dust (Fairlie et al., 2007) and sea-salt (Alexander et al., 25
6
McKendry, I. G., Macdonald, A. M., Leaitch, W. R., et al.: Trans-Pacific dust events ob-served at Whistler, British Columbia during INTEX-B, in preparation, 2008.
ACPD
8, 4017–4057, 2008Long-range transport of East Asian sulfur
to Canada
A. van Donkelaar et al.
Title Page Abstract Introduction Conclusions References Tables Figures ◭ ◮ ◭ ◮ Back Close
Full Screen / Esc
Printer-friendly Version Interactive Discussion
2005). The aerosol and oxidant simulations are coupled through formation of sulfate and nitrate (Park et al., 2004), heterogeneous chemistry (Jacob, 2000) and aerosol ef-fects on photolysis rates (Martin et al., 2003b). Wet and dry deposition are based upon Liu et al. (2001), including both washout and rainout. GEOS-Chem simulations capture both the timing and distribution of Asian dust outbreaks during TRACE-P and ACE-Asia 5
(Fairlie et al., 2007). It exhibits no significant bias in Asian SOx (SO2+SO=4) outflow
during spring 2001 as part of the TRACE-P campaign (Park et al., 2005), although modeled SO=4 concentrations were 50% high during ACE-Asia, which may suggest an error in SO2oxidation rates (Heald et al., 2005).
The global emission inventory in the standard GEOS-Chem model is based on GEIA 10
(Benkovitz et al., 1996) for the base year of 1985 with scale factors to 1998. We implement here the EDGAR 3.2FT2000 emission inventory based upon the year 2000 (Olivier et al., 2002) to provide a more current estimate of global emissions of NOx, SOx
and CO. The global inventory is replaced by regional inventories from NEI99 (http://
www.epa.gov/ttn/chief/net/1999inventory.html) over the United States for 1999, BRAVO 15
(Kuhns et al., 2005) over Mexico for 1999 and Streets et al. 2003; 2006) for 2000 (NOx and SOx) and 2001 (CO) for eastern Asia. EMEP emissions (http://www.emep.
int) of NOx and CO are used over Europe for up to 2000. We update the eastern
Asia emissions to 2006 from Streets et al. (in preparation) and implement EMEP SOx
emissions (Vestreng et al., 2007) over Europe for the year 2004. We increase ship 20
emissions by 4.1% per year (Corbett et al., 2007).
We scale all regional and global inventories from their respective base year to 2003, the last year of available statistics, unless its base year is after 2003. Our approach follows Bey et al. (2001) and Park et al. (2004). Emissions are scaled according to estimates provided by individual countries, where available. These countries/regions 25
include the United States, Canada, Japan and Europe. NOx emissions of remaining countries are scaled proportional to changes in total CO2 emissions. SOx emissions
are similarly scaled to solid fuel CO2 emissions and CO emissions to liquid fuel CO2
Anal-ACPD
8, 4017–4057, 2008Long-range transport of East Asian sulfur
to Canada
A. van Donkelaar et al.
Title Page Abstract Introduction Conclusions References Tables Figures ◭ ◮ ◭ ◮ Back Close
Full Screen / Esc
Printer-friendly Version Interactive Discussion
ysis Center (CDIAC).
In addition to annual scale factors, diurnal scale factors are also applied to NOx
emissions. Here, the intra-day variation of each grid cell is based upon the diurnal variation of each source type, as provided with the EDGAR inventory, and its relative contribution to total NOxemissions within that cell.
5
2.3 Satellite instrumentation
Aerosol Optical Depth (AOD), a measure of light extinction, has been retrieved since 2000 from the Moderate Resolution Imaging Spectroradiometer (MODIS) and Multi-angle Imaging Spectroradiometer (MISR), onboard the NASA satellite Terra. The MODIS retrieval of AOD is based on scene brightness over dark surfaces, using empir-10
ical relationships in the spectral variation in surface reflectivity (Kaufmann et al., 1997; Remer et al., 2005). We use the MODIS collection 5 dataset (Levy et al., 2007). The MISR algorithm uses observed differences in the spatial variation of backscattered ra-diation with changing viewing angle to self-consistently retrieve surface reflectivity and AOD (Martonchik et al., 2002; Kahn et al., 2005). Global coverage in the absence of 15
clouds is achieved daily from MODIS and in 6 to 9 days from MISR.
3 Estimate of sulfur emission growth from China
Significant increases in AOD retrieved from the Total Ozone Mapping Spectrometer (TOMS) over China between 1979–2000 and the Advanced Very High Resolution Radiometer (AVHRR) off the east coast of China between the periods 1988–1991 20
and 2002–2005 are attributed to increased aerosol sources (Massie et al., 2004; Mishchenko and Geogdzhayer, 2007). Here we investigate the recent trend using AOD from MODIS and MISR and assess its relationship with Chinese sulfur emis-sions growth. We first use GEOS-Chem, with East Asian emisemis-sions held at year 2000 levels, to investigate meteorologically induced changes to AOD.
ACPD
8, 4017–4057, 2008Long-range transport of East Asian sulfur
to Canada
A. van Donkelaar et al.
Title Page Abstract Introduction Conclusions References Tables Figures ◭ ◮ ◭ ◮ Back Close
Full Screen / Esc
Printer-friendly Version Interactive Discussion
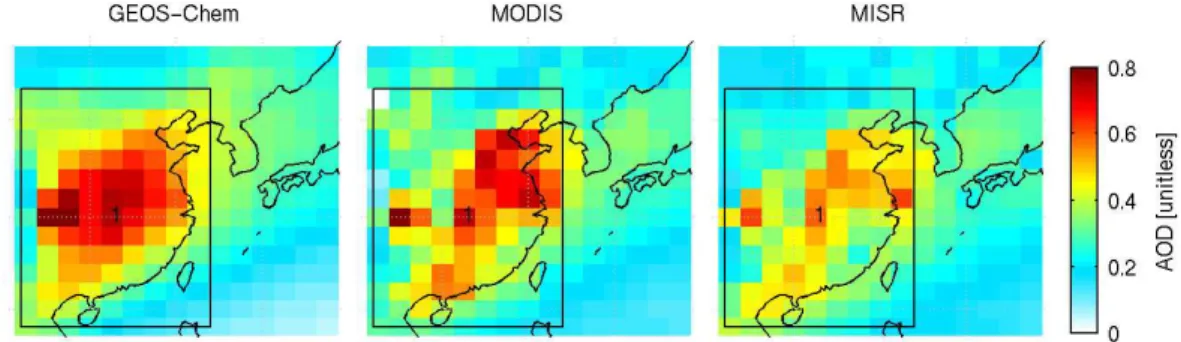
The top row of Fig. 5 shows mean AOD for 2000–2006 over East Asia from MODIS, MISR and GEOS-Chem. Pronounced enhancements of mean AOD in excess of 0.4 are apparent in all three datasets. MODIS AOD exceeds MISR AOD by 12% over the outlined Region 1, consistent with comparisons by Abdou et al. (2005). Simulated AOD exhibits a smoother distribution than both retrievals and exceeds MISR AOD 5
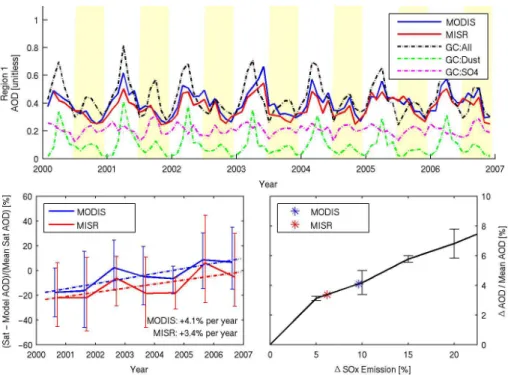
by 22%. The middle panel of Fig. 5 presents monthly average AOD within the Re-gion 1. All three datasets contain a distinct seasonal variation with a spring maximum and a fall minimum that reflects the seasonal variation in dust as noted by Prospero et al. (2002). Simulated AOD generally captures the retrieved monthly variation and magnitude as compared to both instruments (MODIS: r2=0.46, RMSD=0.09; MISR: 10
r2=0.36, RMSD=0.12), although the simulation tends to overestimate springtime AOD. Simulated AOD contributions from dust (green) and SO=4 (magenta) indicate that dust comprises the largest fraction of springtime AOD, whereas SO=4 dominates during other periods. We focus on the periods between July and December, as indicated by yellow bars, when non-sulfate aerosol species such as dust have smaller burdens.
15
The bottom left panel of Figure 5 shows the annual mean difference over July– December between simulated and retrieved AOD for Region 1, expressed as a per-centage of the mean retrieved AOD from each instrument over the six-year, low-dust period. We find a significant trend for both MODIS (+4.1%/year, r2=0.72) and MISR (+3.4%/year, r2=0.54). We associate this trend with increased SOx emissions, as
20
SO=4 dominates simulated AOD in this comparison, simulated SOxemissions are held
at 2000 levels and interannual changes in other aerosols are accounted for in the sim-ulation.
The quantitative relationship between AOD and SO2 emissions depends on a
num-ber of factors including SO2oxidation rates, dynamics and aerosol deposition (Dubovik
25
et al., 2007). We quantify the relationship by conducting sensitivity simulations with increased SOx emissions, and examining the change in simulated AOD. The
bot-tom right panel of Fig. 5 shows the calculated relationship between SOx emissions
ACPD
8, 4017–4057, 2008Long-range transport of East Asian sulfur
to Canada
A. van Donkelaar et al.
Title Page Abstract Introduction Conclusions References Tables Figures ◭ ◮ ◭ ◮ Back Close
Full Screen / Esc
Printer-friendly Version Interactive Discussion
nearly linear over this region during July to December. The annual trend in AOD for MISR and MODIS correspond to simulations with an annual growth in SOx
emis-sions of 6.2%/yr and 9.6%/yr, respectively. In agreement, a comparison of the two bottom-up SOx emission inventories for 2000 (Streets et al., 2003) and 2006 (http:
//www.cgrer.uiowa.edu/EMISSION DATA new/index 16.html) over Region 1 yields an 5
annual growth of 9.9%. Beyond actual emission growth, changes between the 2000 and 2006 inventories include the addition of local inventories not present in, and im-provement and corrections made to, the original 2000 inventory. These factors may account for the slight discrepancy between the growth estimates. We adopt the 2006 bottom-up inventory for our standard simulation, as it provides additional information 10
on the spatial distribution of these SOx emissions.
4 Campaign average analysis of transpacific transport
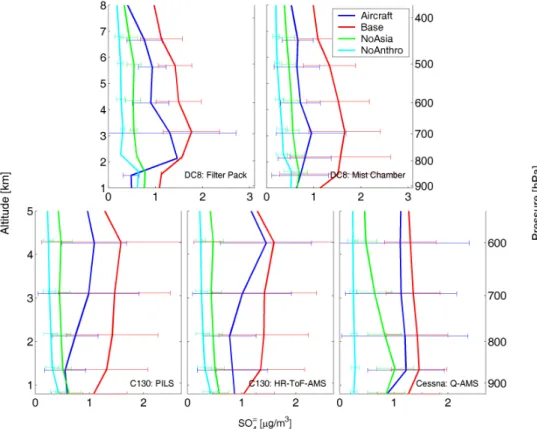
The top row of Fig. 6 shows campaign average SO=4 concentrations for the DC-8 over the domain in Fig. 1. Only filter pack and mist chamber measurements with corre-sponding CIMS SO2measurements have been included to allow subsequent SOx
com-15
parison. Both filter pack (4.5 µm cutoff) and mist chamber (1 µm cutoff) measurements show a maximum between 700–800 hPa. Heald et al. (2006) attribute the SO=4 max-imum in the lower free troposphere to preferential scavenging during transport either in the boundary layer or during lifting to the upper troposphere. Our standard simu-lation of total SO=4 captures the relative vertical profile for both the mist chamber and 20
filter pack measurements over the domain of the DC-8, but overestimates their magni-tude by a RMSD of 0.43 µg/m3(mean bias=49%) and 0.54 µg/m3(mean bias=81%), respectively. We attribute the bias versus the filter pack measurements to an underesti-mate in wet deposition. Comparison of the GEOS-4 rainfall rates used in GEOS-Chem with data from the Tropical Rainfall Measuring Mission (TRMM) (Bowman, 2005) re-25
veals a 40% underestimate in modeled rainfall rates over the North Pacific (25–45◦N,
120◦E–130◦W) during INTEX-B. An overestimate in the SO
ACPD
8, 4017–4057, 2008Long-range transport of East Asian sulfur
to Canada
A. van Donkelaar et al.
Title Page Abstract Introduction Conclusions References Tables Figures ◭ ◮ ◭ ◮ Back Close
Full Screen / Esc
Printer-friendly Version Interactive Discussion
play a role (Heald et al., 2005). Comparison of simulated SOx with the sum of CIMS SO2 measurements (converted to µg/m3) with mist chamber and filter pack SO=4 data between 500-900 hPa reduces the mean bias to 39% and 70% for the filter pack and mist chamber, respectively. However, the bias in SO=4 found here for the East Pacific is lower than found by Heald et al. (2005) for the West Pacific, suggesting a decrease 5
with air mass age as continued SO=4 production during transport decreases the ratio of SO2to SOx.
The campaign average filter pack measurements are 25% higher than the mist chamber measurements between 500–900 hPa, an altitude range inclusive of the C-130 and Cessna measurements. Over the altitude of the C-C-130 and Cessna mea-10
surements a higher bias is found between simulated values and the mist cham-ber (RMSD=0.75 µg/m3, mean bias=98%) versus the filter pack (RMSD=0.49µg/m3, mean bias=45%). This comparison provides additional evidence for scaling the AMS and PILS measurements to reflect total SO=4 mass.
The bottom panels of Fig. 6 show campaign average SO=4 measurements on the 15
C-130 and Cessna, sampled coincidently in time and space with simulated concen-trations. Campaign average SO=4 concentrations for the C-130 measurements gener-ally increase with altitude, reaching a maximum at 600 hPa. The C-130 HR-ToF-AMS measurements consistently exceed the PILS measurements. It is noteworthy that the two AMS measurements tend to agree, whereas the PILS and mist chamber measure-20
ments tend to show a separate agreement. These pairings represent current uncertain-ties in aerosol measurement technologies. During a blind intercomparison conducted 15 May 2006 during a period of DC-8 and C-130 formation flying, the DC-8 Mist Cham-ber and C-130 PILS sulfate were in close agreement (slope=1.00, 1σ=0.03 µg/m3, range 0.15 to 1.15 µg/m3, r2=0.95). The C-130 had considerable freedom to chase in-25
dividual events. Despite this, simulated total SO=4 between 500–900 hPa has an RMSD of 0.42 µg/m3 (mean bias=35%) versus C-130 HR-ToF-AMS measurements and an RMSD of 0.56 µg/m3(mean bias=62%) versus C-130 PILS measurements. The simu-lation exhibits the weak enhancement at 600 hPa, although fails to represent the lower
ACPD
8, 4017–4057, 2008Long-range transport of East Asian sulfur
to Canada
A. van Donkelaar et al.
Title Page Abstract Introduction Conclusions References Tables Figures ◭ ◮ ◭ ◮ Back Close
Full Screen / Esc
Printer-friendly Version Interactive Discussion
concentrations at lower altitudes.
The sampling strategy for the Cessna was to conduct frequent profiles over Whistler Peak. Such a sampling strategy facilitated comparison with simulated results, provided context for the measurements at Whistler summit, and accommodated the range and duration of the Cessna. Cessna measurements indicate a fairly uniform vertical pro-5
file, with a large standard deviation in the free troposphere that reflects an oscillation between clean conditions and plumes. The simulation agrees significantly with size-correction scaled measured SO=4 (RMSD=0.20 µg/m3, mean bias=20%). The largest model-Cessna bias is observed nearer to the surface, suggesting an overestimate in lo-cal emissions which dominate at this altitude. Variability of the Cessna measurements, 10
as represented by the mean standard deviation, exceed model variability by 86%, per-haps reflective of model resolution and thereby its suitability for large-scale events over small ones. While recognizing the potential influence of both measurement uncertainty and the limitation of applying a constant size-correction factor across both altitude and aircrafts, the eastward decrease in the bias between the three aircraft may indicate an 15
increasing SO=4/SOxratio in the measurements.
Figure 6 also shows simulation without anthropogenic East Asian and all anthro-pogenic sources for all three aircraft flight tracks. Anthroanthro-pogenic East Asian SO=4 dom-inates throughout the DC-8 profiles, comprising 60% of the simulated mass between 500–900 hPa, with the largest contribution in the lower free troposphere. Other anthro-20
pogenic SO=4 sources comprise an additional 17%. For the C-130 flight track, closer to North America, simulation results attribute 67% of SO=4 to be of Asian origin, with a peak at 600 hPa. For the Cessna profiles over Whistler, local sources dominate below 700 hPa, while higher altitude concentrations reflect Asian anthropogenic emissions. We calculate that 63% of the measured SO=4 at 600 hPa is from East Asia. Model 25
analysis indicates the influence of Asian sources at higher altitudes in both C-130 and Cessna versus the DC-8 measurements. This orographic effect is induced by rising air masses on approach to North American mountain ranges.
ACPD
8, 4017–4057, 2008Long-range transport of East Asian sulfur
to Canada
A. van Donkelaar et al.
Title Page Abstract Introduction Conclusions References Tables Figures ◭ ◮ ◭ ◮ Back Close
Full Screen / Esc
Printer-friendly Version Interactive Discussion
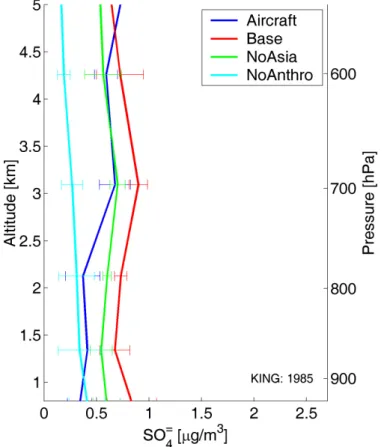
the mean non-seasalt sulfate profile observed by Andreae et al. (1988) during 4 flights in May 1985, covering a similar domain to the C-130 INTEX-B flights. Concentrations of 0.3–0.8 µg/m3 (adjusted to STP at 273 K, sum of coarse and fine fractions) were observed between 500–900 hPa. SO=4 concentrations increased with altitude below 5 km, from 0.3–0.6 µg/m3 in the marine boundary layer to 0.6–0.8 µg/m3 in the cloud 5
convection layer and free troposphere. The 1985 measurements thus showed lower concentrations, but a similar trend with increased altitude as was seen in the C-130 measurements. Mean measurements between 500–900 hPa are higher than the 1985 data by 60% from C-130 PILS and by 90% from HR-ToF-AMS. We further interpret these observations by conducting a GEOS-Chem simulation using 1985 GEIA emis-10
sions and meteorology and sampling along the 1985 flights tracks. The simulation reproduces the measurements with an RMSD of 0.25 µg/m3 (mean bias=21%) over 500–900 hPa. A sensitivity simulation without anthropogenic East Asian emissions re-veals that this source contributes 0.14 µg/m3 (20%) to the measured values in 1985, greatly reduced compared to the 67% along the C-130 flights in 2006. Comparison of 15
simulations along the 1985 and INTEX-B flight tracks indicate a 3.4 fold increase in the relative contribution of east Asian sulfate between 1985–2006. Simulation of complete temporal and spatial coverage within the C-130 area (April–May, 34–55 N, 123.75– 141.25 W, 500–900 hPa) indicates a 2.4 fold increase between these two time periods, while a simulation over the 1985 flight region (April–May, 45–49 N, 123.75–126.25 W, 20
500–900 hPa) experiences an increase of 2.8 fold, suggesting a substantial increase in the influence of East Asian emissions to the free troposphere over the western coast of North America.
5 Asian plume development and influence
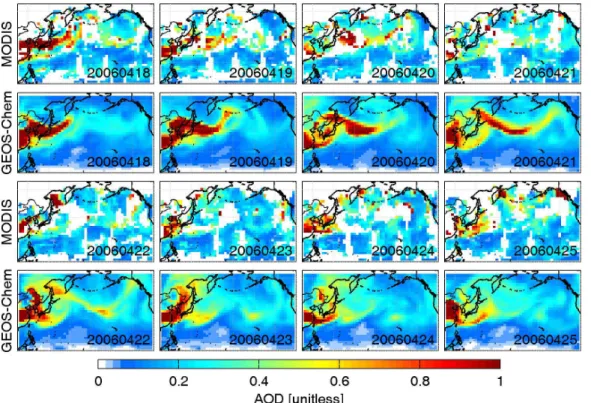
Figure 8 examines the development of an Asian plume from 18 April 2006 to 25
25 April 2006. MODIS AOD retrievals are used from both the Aqua (01:30 overpass) and Terra (10:30 overpass) satellites and plotted with simulation results from the same
ACPD
8, 4017–4057, 2008Long-range transport of East Asian sulfur
to Canada
A. van Donkelaar et al.
Title Page Abstract Introduction Conclusions References Tables Figures ◭ ◮ ◭ ◮ Back Close
Full Screen / Esc
Printer-friendly Version Interactive Discussion
period. The GEOS-Chem simulation successfully captures many of the trends associ-ated with the influx event. Both retrieval and simulation show this plume beginning from China on 18 April and stretching across the Pacific Ocean through 21 April, and finally aligning to the north while moving eastward over the North American coast. Many sim-ulated features, however, are spatially shifted after several days transport primarily due 5
to differences in the simulated and real meteorology. This is typical of simulations of all individual events, complicating individual flight comparisons.
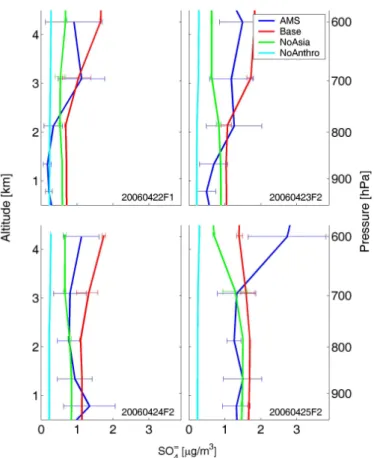
Figure 9 shows individual Cessna SO=4 profiles taken between 22 and 25 April with GEOS-Chem profiles during the same flights. The first three Cessna profiles show enhancements of 0.2–0.8 µg/m3 above 800 hPa relative to surface concentrations, in-10
dicative of a transported plume and in agreement with simulated enhancements of 0.6– 0.8 µg/m3. In the final profile, however, Cessna measurements show an enhancement of 1.6 µg/m3which the model fails to represent. Simulations can fail to produce accu-rate plumes (e.g. Dunlea et al., in preparation), but in this case the simulated plume has advanced beyond the Cessna’s flight path, where in fact the physical plume still 15
resides. During long range transport events, small errors in the meteorological fields used by chemical transport models can compound to create offsets in time and space, making average comparisons more robust.
Figure 10 shows simulated average conditions during April and May 2006. The top panel shows mean concentrations at 2 km, where DC-8 SO=4 enhancements were 20
observed. Simulated SO=4 enhancements occur along the entire western Pacific Cana-dian border, extending to the northwestern United States. A pronounced enhancement covers the eastern United States and Canada, related to major regional anthropogenic sources. The middle and bottom panels show vertical cross-sections of SO=4 and per-centage of SO=4 originating from East Asia, respectively, averaged between the blue 25
lines of the top panel. The highest overall magnitude (>1 µg/m3) is again simulated in eastern North America and is predominately from regional emissions. Nonetheless, a narrow band of Asian influence in excess of 40% prevails over the continent at 4.5 km, where overall concentrations are ∼0.3 µg/m3. Along coastal regions, the largest East
ACPD
8, 4017–4057, 2008Long-range transport of East Asian sulfur
to Canada
A. van Donkelaar et al.
Title Page Abstract Introduction Conclusions References Tables Figures ◭ ◮ ◭ ◮ Back Close
Full Screen / Esc
Printer-friendly Version Interactive Discussion
Asian influence is found between 1 and 5 km, where 40% of the overall SO=4 burden originated in Southeast Asia. We calculate that surface concentrations of SO=4 along the southern Pacific Canadian coast are increased by 0.14–0.19 µg/m3(∼30%) as a re-sult of Asian emissions in spring. Heald et al. (2006) found a 0.16 µg/m3enhancement in SO=4 over the northwest United States during periods of Asian influence.
5
We go on to explore the surface SO=4 measurements from the National Air Pollution Surveillance (NAPS) Network in the Vancouver area for evidence of Asian influence. Figure 11 shows surface SO=4 concentrations between April and May 2006 in the Van-couver area as a function of the modeled percent SO=4 originating in Asia. The two measurement sites in the Vancouver area, Abbotsford and Vancouver, reside in the 10
same model grid box. Black circles correspond to measurement averages, binned at intervals of 5% simulated East Asian influence. Individual measurements show sub-stantial scatter, but linear regression of the binned measurements show a significant correlation (r2=0.64). Binned measurements indicate that an additional 0.27 µg/m3 reaches the surface with each 10% increase in modeled Asian SO=4, corroborating that 15
current levels of Asian sulfur emissions are impacting surface SO=4 concentrations in Canada.
6 Conclusions
We interpret a suite of satellite (MODIS and MISR), aircraft (DC-8, C-130 and Cessna 207) and ground-based measurements (Whistler Peak, NAPS) over the North Pacific 20
Ocean and western North America in April-May 2006 as part of the INTEX-B campaign to understand the implications of long-range transport of Asian aerosol to Canada.
The Canadian component of INTEX-B included 33 flights from a Cessna 207 air-craft. We compare the Cessna quadrupole Aerodyne Mass Spectrometer (Q-AMS) measurements with a high resolution time of flight AMS (HR-ToF-AMS) onboard the 25
C-130 during an intercomparison flight, yielding an overall bias of −0.01 µg/m3 with appreciable scatter (RMSD=0.6 µg/m3) for sulfate (SO=4) and similar agreement for
ACPD
8, 4017–4057, 2008Long-range transport of East Asian sulfur
to Canada
A. van Donkelaar et al.
Title Page Abstract Introduction Conclusions References Tables Figures ◭ ◮ ◭ ◮ Back Close
Full Screen / Esc
Printer-friendly Version Interactive Discussion
organics (bias=0.2 µg/m3, RMSD=0.3 µg/m3). However, there was a small system-atic difference (<20%) between the C-130 HR-ToF-AMS sulfate and a co-located PILS measurement of SO=4 (Dunlea et al., in preparation). We use ground-based measure-ments (MOUDI) of the SO=4 size distribution at Whistler Peak to estimate that a correc-tion factor of 1.4 should be applied to Cessna Q-AMS SO=4 mass to compensate for 5
mass lost due to instrument size restrictions. Cessna profiles over Whistler, B. C. show SO=4 enhancements of 1–2 µg/m3 over 600–700 hPa, indicative of long-range trans-port, whereas organic enhancements are largest near the surface, suggesting a local emission source. We did not detect long-range transport of significant organic aerosol from the Cessna data.
10
We interpret these observations with a global chemical transport model, GEOS-Chem, to simulate the implications of anthropogenic activity. We develop updated scale factors, bringing global anthropogenic emissions from 1998 to at least the year 2003. We also implement a recent bottom-up inventory for East Asia for 2006 (http://www.cgrer.uiowa.edu/EMISSION DATA new/index 16.html).
15
Trends in retrieved Aerosol Optical Depth (AOD) from MISR and MODIS during low dust periods (July–Dec) over 2000–2006 are used to evaluate growth in SOxemissions
from the year 2000 (Streets et al., 2003) to the 2006 values. We find a trend in retrieved AOD of 3.4%/yr (MISR) and 4.1%/yr (MODIS) after accounting for interannual variabil-ity in transport and natural sources as represented by GEOS-Chem. GEOS-Chem 20
calculations of the change in AOD for a change in SOxemissions indicate a near-linear relationship with a ratio of 0.4 over East Asia. We estimate the average annual growth in East Asian SOxemissions to be between 6.2% for MISR and 9.6% for MODIS,
sup-porting the bottom-up estimate of an annual increase of 9.9% from 2000 (Streets et al., 2003) to 2006.
25
We use this simulation to understand the characteristics of East Asian outflow as measured by the INTEX-B aircraft. Over the Pacific Ocean, Asian outflow of SOx is strongest in the lower troposphere, with enhanced SO=4concentrations of 1–1.5 µg/m3 observed by the DC-8 between 700–800 hPa. The C-130 and Cessna aircraft SO=4
ACPD
8, 4017–4057, 2008Long-range transport of East Asian sulfur
to Canada
A. van Donkelaar et al.
Title Page Abstract Introduction Conclusions References Tables Figures ◭ ◮ ◭ ◮ Back Close
Full Screen / Esc
Printer-friendly Version Interactive Discussion
measurements of 1–1.5 µg/m3 over 600–800 hPa indicate that Asian plumes are of-ten elevated by orographic effects along coastal North America. The simulation gen-erally captures the campaign mean profile shape of DC-8, C-130 and Cessna mea-surements, but overestimate total SO=4 concentrations with RMSD of 0.20–0.56 µg/m3 (mean bias of 20–62%), likely due to biases in precipitation and SO2 oxidation.
Sim-5
ulations without Asian emissions reveal that long-range transport of SO=4 dominates campaign-mean aircraft measurements in the free troposphere.
We compare the INTEX-B measurements with aircraft measurements in May 1985 over a similar domain as the C-130. Measured free tropospheric SO=4 concentrations increase by 60–90% from 1985 to 2006. Simulations without East Asian emissions 10
indicate that their relative contribution to SO=4 concentrations during April and May, between 500–900 hPa and over the two aircraft domains, have increased by a factor of 2.4–3.4 since 1985 depending on the specific region.
Comparison of individual plumes with aircraft profiles and MODIS AOD reveals a general consistency, but offsets in time and space. Campaign-mean simulations show 15
that 40% of the SO=4 burden between 1 and 5 km over Whistler is of anthropogenic Asian origin. These emissions increase surface concentrations along the western Canadian coast by 0.14–0.19 µg/m3(∼30%) in spring. This effect is corroborated with surface measurements, where we find an increase of 0.27 µg/m3 with each 10% in-crease in simulated fraction of Asian SO=4 during INTEX-B.
20
A better understanding of SO2 oxidation and wet scavenging is still needed. Previ-ous work (Heald et al., 2006) and our analysis indicate an overestimate in the simu-lated SO2 oxidation rate. Development of size-resolved aerosol simulations and SO=4
instruments that sample larger particles with high time resolution would facilitate model-measurement comparison. Improved understanding of inter-instrument SO=4 measure-25
ments would be valuable.
Acknowledgements. We thank D. Parrish for his helpful suggestions. This work is supported
by the Natural Sciences and Engineering Research Council of Canada Special Research Op-portunity Program and Environment Canada. E. J. Dunlea and J. L. Jimenez were supported
ACPD
8, 4017–4057, 2008Long-range transport of East Asian sulfur
to Canada
A. van Donkelaar et al.
Title Page Abstract Introduction Conclusions References Tables Figures ◭ ◮ ◭ ◮ Back Close
Full Screen / Esc
Printer-friendly Version Interactive Discussion
by NASA grants NNG04GA67G and NNG06GB03G and NSF grants 0449815 and ATM-0513116. We thank the MODIS and MISR teams for their level 3 aerosol products and Envi-ronment Canada for their NAPS data.
References
Arellano, A. F., Kasibhatla Jr., P. S., Giglio, L., van der Werf, G. R., and Randerson, J. T.: Top-5
down estimates of global CO sources using MOPITT measurements, Geophys. Res. Lett., 31, L01104, doi:10.1029/2003GL018609, 2004.
Abdou, W. A., Diner, D. J., Martonchik, J. V., Bruegge, C. J., Kahn, R. A., Gaitley, B. J., and Crean, K. A.: Comparison of coincident Multiangle Imaging Spectroradiometer and Moderate Resolution Imaging Spectroradiometer aerosol optical depths over land and 10
ocean scenes containing Aerosol Robotic Network sites, J. Geophys. Res., 110, D10S07, doi:10.1029/2004JD004693, 2005.
Andreae, M. O., Berresheim, H., Andreae, T. W., Kritz, M. A., Bates, T. S., and Merrill, J. T.: Vertical distribution of dimethylsulfide, sulfur dioxide, aerosol ions, and radon over the northeast Pacific Ocean, J. Atmos. Chem., 6, 149–173, 1988.
15
Bailey, R., Barrie, L.A., Halsall, C. J., Fellin, P., and Muir, D. C. G.: Atmospheric organochlorine pesticides in the western Canadian Arctic: Evidence of transpacific transport, J. Geophys. Res., 105(D9), 11 805–11 811, 2000.
Barrie, L. A., Li, S.-M., Toom, D. L., Landsberger, S., and Sturges, W.: Lower tropospheric measurements of halogens, nitrates, and sulphur oxides during Polar Sunrise Experiment 20
1992, J. Geophys. Res., 99(D12), 25 453–25 467, 1994.
Benkovitz, C. M., Scholtz, M. T., Pacyna, J., Tarras ´on, L., Dignon, J., Voldner, E. C., Spiro, P. A., Logan, J. A., and Graedel, T. E.: Global gridded inventories of anthropogenic emissions of sulfur and nitrogen, J. Geophys. Res., 101(D22), 29 239–29 253, 1996.
Bertschi, I. T., Jaffe, D. A., Jaegl ´e, L., Price, H. U., and Dennison, J. B.: PHOBEA/ITCT 2002 25
airborne observations of transpacific transport of ozone, CO, volatile organic compounds, and aerosols to the northeast Pacific: Impacts of Asian anthropogenic and Siberian boreal fire emissions, J. Geophys. Res., 109, D23S12, doi:10.1029/2003JD004328, 2004.
Bey, I., Jacob, D. J., Yantosca, R. M., Logan, J. A., Field, B. D., Fiore, A. M., Li, Q., Liu, H. Y., Mickley, L. J., and Schultz, M. G.: Global modeling of tropospheric chemistry with assimilated 30
ACPD
8, 4017–4057, 2008Long-range transport of East Asian sulfur
to Canada
A. van Donkelaar et al.
Title Page Abstract Introduction Conclusions References Tables Figures ◭ ◮ ◭ ◮ Back Close
Full Screen / Esc
Printer-friendly Version Interactive Discussion
meteorology: Model description and evaluation, J. Geophys. Res., 106(D19), 23 073–23 095, 2001.
Bowman, K. P.: Comparison of TRMM precipitation retrievals with rain gauge data from ocean buoys, J. Climate, 18, 178–190, 2005.
Brock, C. A., Hudson, P. K., Lovejoy, E. R., Sullivan, A., Nowak, J. B., Huey, L G., Cooper, O. 5
R., Cziczo, D. J., de Gouw, J., Fehsenfeld, F. C., Holloway, J. S., H ¨ubler, G., Lafleur, B. G., Murphy, D. M., Neuman, J. A., Nicks Jr., D. K., Orsini, D. A., Parrish, D. D., Ryerson, T. B., Tanner, D. J., Warneke, C., Weber, R. J., and Wilson, J. C.: Particle characteristics follow-ing cloud-modified transport from Asia to North America, J. Geophys. Res., 109, D23S26, doi:10.1029/2003JD004198, 2004.
10
Canagaratna, M. R., Jayne, J. T., Jimenez, J. L., Allan, J. D., Alfarra, M. R., Zhang, Q., Onasch, T. B., Drewnick, F., Coe, H., Middlebrook, A., Delia, A., Williams, L. R., Trimborn, A. M., Northway, M. J., DeCarlo, P. F., Kolb, C. E., Davidovits, P., and Worsnop, D. R.: Chemical and microphysical characterization of ambient aerosols with the Aerodyne Aerosol Mass Spectrometer, Mass Spec. Rev., 26, 185–222, 2007.
15
Cofer, W. R., Collins, V. G., and Talbot, R. W.: Improved aqueous scrubber for collection of soluble atmospheric trace gases, Environ. Sci. Tech., 19, 557–560, 1985
Corbett, J. J., Wang, C., Winebrake, J. J., and Green, E.: Allocation and forecasting of global ship emissions, Clean Air Task Force Report, 2007.
DeCarlo, P. F., Kimmel, J. R., Trimborn, A., Northway, M. J., Jayne, J. T., Aiken, A. C., Gonin, 20
M., Fuhrer, K., Horvath, T., Docherty, K. S., Worsnop, D. R., and Jimenez, J. L.: Field-deployable, high-resolution, time-of-flight aerosol mass spectrometer, Analytical Chemistry, 78, 8281–8289, doi:10.1021/ac061249n, 2006.
Dubovik, O., Lapyonok, T., Kaufman, Y. J., Chin, M., Ginoux, P., and Sinyuk, A.: Retrieving global sources of aerosols from MODIS observations by inverting GOCART model, Atmos. 25
Chem. Phys. Discuss., 7, 3629–3718, 2007,
http://www.atmos-chem-phys-discuss.net/7/3629/2007/.
Eisinger, M. and Burrows, J. P.: Tropospheric sulfur dioxide observed by the ERS-2 GOME instrument, Geophys. Res. Let., 25(22), 4177–4180, 1998.
Fairlie, T. D., Jacob, D. J., and Park, R. J., The impact of transpacific transport of mineral dust 30
in the United States, Atmos. Environ., 41, 12 51–12 66, 2007.
Fu., T.-M., Jacob, D. J., Palmer, P. I., Chance, K., Wang, Y. X., Barletta, B., Blake, D. R., Stanton, J. C., and Pilling, M. J.: Space-based formaldehyde measurements as constraints on volatile
ACPD
8, 4017–4057, 2008Long-range transport of East Asian sulfur
to Canada
A. van Donkelaar et al.
Title Page Abstract Introduction Conclusions References Tables Figures ◭ ◮ ◭ ◮ Back Close
Full Screen / Esc
Printer-friendly Version Interactive Discussion
organic compound emissions in east and south Asia and implications for ozone, J. Geophys. Res., 112, D06312, doi:10.1029/2006JD007853, 2007.
Harner, T, Shoeib, M., Kozma, M., Gobas, F.A.P.C., and Li, S. M.: Hexachlorocyclohexanes and endosulfans in urban, rural and high altitude air samples in the Fraser Valley, British Columbia: Evidence for trans-Pacific transport, Env. Sci. Tech. 39, 724–731, 2005
5
Heald, C. L., Jacob, D. J., Jones, D. B., Palmer, P. I., Logan, J. A., Streets, D. G., Sachse, G. W., Gille, J. C., Hoffman, R. N., and Nehrkorn, T.: Comparative inverse analysis of satellite (MO-PITT) and aircraft (TRACE-P) observations to estimate Asian sources of carbon monoxide. J. Geophys. Res., 109, D23306, doi:10.1029/2004JD005185, 2004.
Heald, C. L., Jacob, D. J., Park, R. J., Russel, L. M., Huebert, B. J., Seinfeld, J. H., Liao, H., 10
and Weber, R.: A large organic aerosol source in the free troposphere missing from current models, Geophys. Res. Let., 32, L18809, doi:10.1029/2005GL023831, 2005.
Heald, C. L., Jacob, D. J., Park, R. J., Alexander, B., Fairlie, T. D., Yantosca, R. M., and Chu, D. A.: Transpacific transport of Asian anthropogenic aerosols and its impact on surface air quality in the United States, J. Geophys. Res., 111, D14310, doi: 10.1029/2005JD006847, 15
2006.
Huey, L. G., Tanner, D. J., Slusher, D. L., Dibb, J. E., Arimoto, R., Chen, G., Davis, D., Buhr, M. P., Nowak, J. B., Mauldin, R. L. III, Eisele, R. L., and Kosciuch, E.: CIMS measurements of HNO3and SO2at the South Pole during ISCAT 2000, Atmos. Environ., 38, 5411–5421, 2004.
20
Jacob, D. J.: Heterogeneous chemistry and tropospheric ozone, Atmos. Env., 34, 2131–2159, 2000.
Jacob, D. J., Crawford, J. H., Kleb, M. M., Connors, V. S., Bendura, R. J., Raper, J. L., Sachse, G. W., Gille, J. C., Emmons, L., and Heald, C. L.: Transport and Chemical Evolution over the Pacific (TRACE-P) aircraft mission: Design, execution, and first results, J. Geophys. Res., 25
108(D20), 9000, doi:10.1029/2002JD003276, 2003.
Jaffe, D., Anderson, T., Covert, D., Kotchenruther, R., Trost, B., Danielson, J., Simpson, W., Berntsen, T., Karlsdottir, S., Blake, D., Harris, J., Carmichael, G., and Uno, I.: Transport of Asian air pollution to North America, Geophys. Res. Let., 26(6), 711–714, 1999.
Jayne, J. T., Leard, D., Zhang, X., Daivovits, P., Smith, K. A., Kolb, C. E., and Worsnop, D. 30
R.: Development of an aerosol mass spectrometer for size and composition analysis of submicron particles, Aero. Sci. Tech., 33(1), 49–70, 2000.
ACPD
8, 4017–4057, 2008Long-range transport of East Asian sulfur
to Canada
A. van Donkelaar et al.
Title Page Abstract Introduction Conclusions References Tables Figures ◭ ◮ ◭ ◮ Back Close
Full Screen / Esc
Printer-friendly Version Interactive Discussion
using satellite observations: Relative roles of fossil fuel combustion, biomass burning and soil emissions, Faraday Discussions, 130, 407–423, doi:10.1039/b502128f, 2005.
Jimenez, J. L., Jayne, J. T., Shi, Q., Kolb, C. E., Worsnop, D. R., Yourshaw, I., Seinfeld, J. H., Flagan, R. C., Zhang, X., Smith, K. A., Morris, J. W., and Davidovits, P.: Ambient aerosol sampling using the Aerodyne Aerosol Mass Spectrometer, J. Geophys. Res., 108(D7), 8425, 5
doi:10.1029/2001JD001213, 2003.
Jordan, C. E., Dibb, J. E., Anderson, B. E., and Fuelberg, H. E.: Uptake of nitrate and sulfate on dust aerosols during TRACE-P, J. Geophys. Res., 108(D21), 8817, doi:10.1029/2002JD003101, 2003.
Kahn, R. A., Gaitley, B. J., Martonchik, J. V., Diner, D. J., and Crean, K. A.: Multiangle Imaging 10
Spectroradiometer (MISR) global aerosol optical depth validation based on 2 years of coin-cident Aerosol Robotic Network (AERONET) observations, J. Geophys. Res., 110, D10S04, doi: 10.1029/2004JD004706, 2005.
Kaufman, Y. J., Tanr ´e, D., Remer, L. A., Vermote, E. F., Chu, D. A., and Holben, B. N.: Oper-ational remote sensing of tropospheric aerosol over the land from EOS moderate resolution 15
imaging spectroradiometer, J. Geophys. Res., 102, 17 051–17 061, 1997.
Khokhar, M. F., Frankenberg, C., Van Roozendael, M., Beirle, S., K ¨uhl, S., Richter, A., Platt, U., and Wagner, R.: Satellite observations of atmospheric SO2 from volcanic eruptions during the time-period of 1996–2002, Adv. Sp. Res., 36, 879–887, 2005.
Kim, S., Huey, L. G., Stickel, R. E., Tanner, D. J., Crawford, J. H., Olson, J. R., Chen, G., Brune, 20
W. H., Ren, X., Lesher, R., Wooldridge, P. J., Bertram, T. H., Perring, A., Cohen, R. C., Lefer, B., Shetter, R. E., Avery, M., Diskin, G., and Sokolik, I.: Measurement of pernitric acid in the free troposphere, J. Geophys. Res., 112, D12S01, doi:10.1029/2006JD007676, 2007. Krotkov, N. A., Carn, S. A., Krueger, A. J., Bhartia, P. K., and Yang, K.: Band residual difference
algorithm for retrieval of SO/sub 2/ from the aura ozone monitoring instrument (OMI), IEEE 25
Trans. Geosci. Remote Sens., 44(5), 1259–1266, 2006.
Kuhns, H., Knipping, E. M., and Vukovich, J. M.: Development of a United States-Mexico emissions inventory for the Big Bend Regional Aerosol and Visibility Observational (BRAVO) study, J. Air and Waste Manage. Assoc., 55, 677–692, 2005.
Leue, C., Wenig, M., Wagner, T., Klimm, O., Platt, U., and Jahne, B.: Quantitative analysis of 30
NOx emissions from GOME satellite image sequences, J. Geophys. Res., 106(D6), 5493– 5505, 2001.
ACPD
8, 4017–4057, 2008Long-range transport of East Asian sulfur
to Canada
A. van Donkelaar et al.
Title Page Abstract Introduction Conclusions References Tables Figures ◭ ◮ ◭ ◮ Back Close
Full Screen / Esc
Printer-friendly Version Interactive Discussion
operational algorithm: Retrieval of aerosol properties over land from inversion of Moderate Resolution Imaging Spectroradiometer spectral reflectance, J. Geophys. Res., 112, D13211, doi:10.1029/2006JD007811, 2007.
Liang, Q., Jaegl ´e, L., Jaffe, D. A., Weiss-Penzias, P., Heckman, A., and Snow, J. A.: Long-range transport of Asian pollution to the northeast Pacific: Seasonal variations and transport 5
pathways of carbon monoxide, J. Geophys. Res., 109, D23S07, doi:1029.2003JD004402, 2004.
Liao, H., Henze, D. K., Seinfeld, J. H., Wu, S., and Mickley, L. J.: Biogenic secondary organic aerosol over the United States: Comparison of climatological simulations with observations, J. Geophys. Res., 112, D06201, doi:10.1029/2006JD007813, 2007.
10
Liu, H, Jacob, D. J., Bey, I., and Yantosca, R. M.: Constraints from210Pb and7Be on wet deposi-tion and transport in a global three-dimensional chemical tracer model driven by assimilated meteorological fields, J. Geophys. Res., 106(D11), 12 109–12 128, 2001.
Liu, J., Mauzerall, D. L., and Horowitz, L. W.: Analysis of seasonal and interannual variability in transpacific transport, J. Geophys. Res., 110, D04302, doi:10.1029/2004JD005207, 2005. 15
Liu, P. S. K., Deng, S., Smith, K. A., Williams, L. R., Jayne, J. T., Canagaratna, M. R., Moore, K., Onasch, T. B., Worsnop, D. R., and Deshler, T.: Transmission efficiency of an aerodynamic focusing lens system: Comparison of model calculations and laboratory measurements for the Aerodyne Aerosol Mass Spectrometer, Aero. Sci. Tech., 41, 721–733, 2007.
Macdonald, A.M., Anlauf, K. G., Leaitch, W. R., and Liu, P. S. K.: Multi-year chemistry of 20
particles and selected traces gases at the Whistler High Elevation Site, EOS Trans. AGU, 87(52), Fall Meet. Suppl., Abstract A53B-0719, 2006.
Martin, R. V., Jacob, D. J., Chance, K., Kurosu, T. P., Palmer, P. I., and Evans, M. J.: Global inventory of nitrogen oxide emissions constrained by space-based observations of NO2 columns, J. Geophys. Res., 108(D17), 4537, doi:10.1029/2003JD003453, 2003a.
25
Martin, R. V., Jacob, D. J., and Yantosca, R. M.: Global and regional decreases in tropo-spheric oxidants from photochemical effects of aerosols, J. Geophy. Res., 108(D3), 4097, doi:10.1029/2002JD002622, 2003b.
Martonchik, J. V., Diner, D. J., Crean, K. A., and Bull, M. A.: Regional aerosol retrieval results from MISR, IEEE Trans. Geosci. Remote Sens., 40(7), 1520–1531, 2002.
30
Massie, S. T., Torres, O., and Smith, S. J.: Total Ozone Mapping Spectrometer (TOMS) obser-vations of increases in Asian aerosol in winter from 1979 to 2000, J. Geophys. Res., 109, D18211, doi:10.1029/2004JD004620, 2004.
ACPD
8, 4017–4057, 2008Long-range transport of East Asian sulfur
to Canada
A. van Donkelaar et al.
Title Page Abstract Introduction Conclusions References Tables Figures ◭ ◮ ◭ ◮ Back Close
Full Screen / Esc
Printer-friendly Version Interactive Discussion
McKendry, I. G., Hacker, J. P., Stull, R., Sakiyama, S., Mignacca, D., and Reid, K.: Long-range transport of Asian dust to the Lower Fraser Valley, British Columbia, Canada, J. Geophys. Res., 106(D16), 18 361–18 370, 2001.
McKendry, I. G., Strawbridge, K. B., O’Neill, N. T., Macdonald, A. M., Liu, P. S. K., Leaitch, W. R., Anlauf, K. G., Jaegle, L., Fairlie, T. D., and Westphal, D. L.: Trans-Pacific transport 5
of Saharan dust to western North America: A case study, J. Geophys. Res., 112, D01103, doi:10.1029/2006JD007129, 2007.
McNaughton, C. S., Thornhill, L., Clarke, A. D., Howell, S. G., Pinkerton, M., Anderson, B., Winstead, E., Hudgins, C., Maring, H., Dibb, J. E., and Scheuer, E.: Results from the DC-8 inlet characterization experiment (DICE): Airborne versus surface sampling of mineral dust 10
and sea salt aerosols, Aero. Sci. Tech., 40, 136–159, 2007.
Ming, Y., Ramaswamy, V., Donner, L. J., Phillips, V. T. J., Klein, S. T., Ginoux, P. A., and Horowitz, L. W.: Modeling the interactions between aerosols and liquid water clouds with a self-consistent cloud scheme in a general circulation model, J. Atmos. Sci., 64(4), 1189– 1209, doi: 10.1175/JAS3874.1, 2007.
15
Mishchenko, M. L. and Geogdzhayer, I. V.: Satellite remote sensing reveals regional tropo-spheric aerosol trends, Opt. Ex., 15(12), 7423–7438, 2007.
M ¨uller, J.-F. and T. Stavrakou: Inversion of CO and NOx emissions using the adjoint of the IMAGES model, Atmos. Chem. Phys., 5, 1157–1186, 2005,
http://www.atmos-chem-phys.net/5/1157/2005/.
20
Olivier, J. G. J., Berdowski, J. J. M., Peters, J. A. H. W., Bakker, J., Visschedijk, A. J. H., and Bloos, J. P. J.: Applications of EDGAR. including a description of EDGAR 3.2: reference database with trend data for 1970-1995, RIVM, Bilthoven, RIVM report 773301 001/NRP report 410200 051, 2002
Palmer, P. I., Jacob, D. J., Fiore, A. M., Martin, R. V., Chance, K., and Kurosu, T. P.: Map-25
ping isoprene emissions over North America using formaldehyde column observations from space, J. Geophys. Res., 108(D6), 4180, doi:10.1029/2002JD002153, 2003.
Park, R. J., Jacob, D. J., Chin, M., and Martin, R. V.: Sources of carbonaceous aerosols over the United States and implications for natural visibility, J. Geophys. Res., 108(D12), 4355, doi:10.1029/2002JD003190, 2003.
30
Park, R. J., Jacob, D. J., Field, B. D., and Yantosca, R. M.: Natural and transboundary pollu-tion influences on sulphate-nitrate-ammonium aerosols in the United States: Implicapollu-tions for policy, J. Geophys. Res., 109, D15204, doi:10.1029/2003JD004473, 2004.