HAL Id: hal-00298707
https://hal.archives-ouvertes.fr/hal-00298707
Submitted on 14 Jun 2006HAL is a multi-disciplinary open access
archive for the deposit and dissemination of sci-entific research documents, whether they are pub-lished or not. The documents may come from teaching and research institutions in France or abroad, or from public or private research centers.
L’archive ouverte pluridisciplinaire HAL, est destinée au dépôt et à la diffusion de documents scientifiques de niveau recherche, publiés ou non, émanant des établissements d’enseignement et de recherche français ou étrangers, des laboratoires publics ou privés.
Comparison of three measurement methods of saturated
hydraulic condutivity
C. Fallico, E. Migliari, S. Troisi
To cite this version:
C. Fallico, E. Migliari, S. Troisi. Comparison of three measurement methods of saturated hydraulic condutivity. Hydrology and Earth System Sciences Discussions, European Geosciences Union, 2006, 3 (3), pp.987-1019. �hal-00298707�
HESSD
3, 987–1019, 2006 Measurement methods of saturated hydraulic condutivity C. Fallico et al. Title Page Abstract Introduction Conclusions References Tables Figures J I J I Back CloseFull Screen / Esc
Printer-friendly Version
Interactive Discussion
EGU Hydrol. Earth Syst. Sci. Discuss., 3, 987–1019, 2006
www.hydrol-earth-syst-sci-discuss.net/3/987/2006/ © Author(s) 2006. This work is licensed
under a Creative Commons License.
Hydrology and Earth System Sciences Discussions
Papers published in Hydrology and Earth System Sciences Discussions are under open-access review for the journal Hydrology and Earth System Sciences
Comparison of three measurement
methods of saturated hydraulic
condutivity
C. Fallico, E. Migliari, and S. Troisi
Department of Soil Conservation of University of Calabria, Italy
Received: 6 April 2006 – Accepted: 12 April 2006 – Published: 14 June 2006 Correspondence to: C. Fallico ([email protected])
HESSD
3, 987–1019, 2006 Measurement methods of saturated hydraulic condutivity C. Fallico et al. Title Page Abstract Introduction Conclusions References Tables Figures J I J I Back CloseFull Screen / Esc
Printer-friendly Version
Interactive Discussion
EGU
Abstract
After pointing out the importance of the saturated hydraulic conductivity (ks) mea-surements and the difficulties and uncertainties that are present, and after recall-ing salient aspects of three well-known measurement methods of this parameter (i.e. constant-head tension infiltrometer (TI) method, constant-head pressure
infiltrom-5
eter (PI) method and soil core (SC) estimates method), the results of an investigation on data which were obtained during a measurement campaign on an area of 800 m2, on a sandy loam hillslope, located in Southern Italy, were carried out again here. Three sets of values of ks, obtained with these measurement methods, were analyzed statis-tically, verifying that the log-normal distribution describes these better than the normal
10
one; moreover, the more significant statistical parameters of each set were compared (average value ¯k, amplitude A, coefficient of variation CV and standard deviation SD),
individualizing the more significant differences. The greatest value of hydraulic conduc-tivity ¯ks was found with method (PI), while the smallest with (SC) and the intermediate with (TI); these differences were translated into macroporosity and into the influence of
15
the single measurement method.
Moreover, referring to the possible factors affecting the results, the importance can be noted of the structure, the texture and the soil events, in terms of utilization, which can affect the measure of ksleading often to very different values even for similar soils, but with a different history, independently of the coincidence of the measurement points
20
and they can be determining to explain the differences affecting the results obtained in analogous investigations by other researchers.
Having confirmed that generalization is not possible, the need was emphasized to adopt the necessary devices relating to the specific measurement method, case by case, and to carefully explain the obtained results, in the light of the peculiarities and
25
the limits of each situation.
Finally, the results of similar statistical analysis carried out on a greater number of
HESSD
3, 987–1019, 2006 Measurement methods of saturated hydraulic condutivity C. Fallico et al. Title Page Abstract Introduction Conclusions References Tables Figures J I J I Back CloseFull Screen / Esc
Printer-friendly Version
Interactive Discussion
EGU some statistical considerations on the increasing of the measurements number.
1 Introduction
Water displacement capacity in the vadose zone is often characterized by the satu-rated hydraulic conductivity parameter ks, which represents a basic property of the soil in several contexts and practical problems of agronomy and engineering, such
5
as in watering-system projects, in the study of contaminant transport, in remediation projects, to valuate the soil sorption and the capacity to make the water flow in the subsoil and to the aquifers and generally in water management problems.
Usually the ks parameter is directly measured in the field or laboratory; there are several methods for ks measuring, but generally they provide differing and often
in-10
comparable values. The causes of this may be numerous, as will be better seen later, in part owing to the measurement technique (procedure of sample acquisition, extreme sensitivity to the given-soil volume dimension, flux geometry, etc.) and in part owing to the soil particularities (different physical and hydraulic characteristics, different struc-ture, texstruc-ture, etc.), as is well-known and documented in the literature (Reynolds et
15
al., 2000; Lee et al., 1985; Clemente et al., 1994; White et al., 1992; Bagarello and Provenza, 1996).
In spite of the methods, comparison results are generally uncertain and linked to the specific measurement conditions. Investigating the causes, the motivations of these differences and results obtained by different methods is interesting and an attempt is
20
made to provide useful suggestions to choose the more suitable method for the given soil case by case.
To this purpose, in this work the results of an analysis on ksvalues are reported, ob-tained during a set of data acquisition, by means of three of the more usual measure-ment methods: the tension disc infiltrometer method (TI), the pressure ring infiltrometer
25
(PI), and the soil core estimates method (SC) (Herman et al., 2003).
guar-HESSD
3, 987–1019, 2006 Measurement methods of saturated hydraulic condutivity C. Fallico et al. Title Page Abstract Introduction Conclusions References Tables Figures J I J I Back CloseFull Screen / Esc
Printer-friendly Version
Interactive Discussion
EGU antees rapidity and simplicity, or because it does not cause significant changes of the
near saturation soils (Reynolds and Elrick, 1991; Ankeny et al., 1991; Perroux and White, 1988).
The apparatus of the measurement device and the relative procedure are also de-scribed carefully in a lot of studies such as these above cited: it consists of a
reservoir-5
tower with a graduated scale on its wall. This reservoir is connected with a smaller tower, named “bubble tower”, which acts as a Mariotte bottle and is used for fixing a negative head, in such a manner as to cause an infiltration velocity into the soil slightly less than that of water spilled freely on it.
Moreover, the reservoir is connected to a disc, which has a permeable membrane
10
at the bottom through which the water goes out of the measurement device. It is advisable that the disc is not attached directly to the reservoir bottom, but connected to it by means of a gummed tube, in such a way as to avoid instability of the apparatus during the measurement, which otherwise might cause a movement of the same disc and a greater compactness of the soil, with consequent change of the macropores
15
owing to the greater weight of the reservoir water column (Elrick and Reynolds, 1992). Moreover, the disc does not touch the soil directly, but it is inter-situated on the con-tact layer, usually made of white silty sand, useful for a good hydraulic connection. This layer may sometimes cause flow impediment phenomena, especially in soils with high infiltration discharges; to avoid this impediment, the layer must have a non-excessive
20
thickness and a hydraulic conductivity greater than that of the soil below. Also the elastic membrane on the base of the disc can affect the outgoing water flow from the measurement devices.
The classical theory forecasts the use of equations which provide the infiltration rate, in steady state flow, one for each of the two or more constant heads taken in account
25
for every measurement (Wooding, 1968; Logsdon and Jaynes, 1993; Angulo-Jaramillo et al., 2000). At this point it is necessary explain that for the same measurement the next heads, applied on the same connection layer, must prove in each case to be greater than the earlier ones, so as to avoid the entrance of air into the macropores;
HESSD
3, 987–1019, 2006 Measurement methods of saturated hydraulic condutivity C. Fallico et al. Title Page Abstract Introduction Conclusions References Tables Figures J I J I Back CloseFull Screen / Esc
Printer-friendly Version
Interactive Discussion
EGU this guarantees that all the initially active macropores continue to help the outflow, but
does not exclude that other macropores act under the effect of greater heads (Elrick and Reynolds, 1992).
The (PI) method is also much used for the measurements ks in the field; it is also very simple and rapid, does not require contact with the sandy layer and is particularly
5
suitable for the measurements in agricultural soil (Mertens et al., 2002).
The ring pressure infiltrometer consists of a tower used either as reservoir or as Mariotte bottle, for fixing the constant head to the measurements; this reservoir is connected to the base, by means of a small gum tube, to another tower, formed by the transparent rigid tube, with a smaller dimension, where the water reaches the level
10
correspondent to the fixed head. This tube is placed directly on the metallic ring, which is fixed into the soil and the infiltration water flows out through it (Reynolds, 1993a; Elrick and Reynolds, 1992; Angulo-Jaramillo et al., 2000).
The insertion of the ring may cause considerable disturbance to the state of the soil, truncating the macropores intercepted by its walls, which end up no longer contributing
15
to the flow; moreover, a preferential flow may create itself, as a short circuit, along the metallic walls of the ring, which changes the normal conditions of the water infiltration. Also the sizes of the ring can affect the measurement, if they are relatively small, the considered soil portion prove to be reduced, the measure may prove scarcely repre-sentative of an assigned soil.
20
Also for the (PI) method the steady state flow during the constant-head measurement is considered; every measurement is repeated twice or more with constant heads in-creasing; it is necessary to consider that, nevertheless, in this case the pressure on the water infiltration is positive.
As in the previous method, for each constant head the equation which expresses the
25
infiltration rate is written, so arriving at the determination of the ksparameter (Reynolds and Elrick, 1990; Angullo-Jaramillo et al., 2000).
The (SC) method is a laboratory method; the soil samples are analyzed with very simple techniques, after that they were saturated with immersion in water for some
HESSD
3, 987–1019, 2006 Measurement methods of saturated hydraulic condutivity C. Fallico et al. Title Page Abstract Introduction Conclusions References Tables Figures J I J I Back CloseFull Screen / Esc
Printer-friendly Version
Interactive Discussion
EGU days (Klute and Dirksen, 1986; Hillel, 1980; Bouma, 1980; Reynolds, 1993b).
This ks measurement method is also among the more classical ones, the undis-turbed samples are drawn out by inserting small metallic cylinders into the soil of a diameter and depth of generally about some centimetres (5÷10 cm), with a sharp bot-tom edge for easy insertion into the soil. For its simplicity the (SC) method is used very
5
frequently and often it is considered as a “sampler” method to calibrate or value other methods (Reynolds et al., 2000).
Nevertheless, it also has various limitation, such as those of PI method, like the disturbance caused to the soil sample during the inserting of the metallic ring, the sizes of the sample and the possibility of short circuit along the walls of the metallic
10
sampler or along the macropores which eventually cross all the samples.
2 The field site
To carry out the measurements only the one site was selected, located in Calabria (Southern Italy), in the basin of the Turbolo torrent, a tributary of the Crati river. The site area presents a surface of 800 m2(40 m×20 m) and an average slope of about 6%,
15
on the longer side.
Geologically it is an area formed prevalently by sandy slimy conglomerate alluvial deposits; there is about 8.3 m depth from the trampling plane, a shallow aquifer, whose thickness is about 8 m and at the bottom there is a clay layer.
The upper soil in this area presents structural and textural characteristics typical of
20
the agricultural soil with prevalent typology of sandy-loam. This field is cultivated an-nually with cereal cultivation (wheat, oats, purple medick) and was tilled with mechanic instruments immediately before the measurements; moreover, the grass was cut many times during the measurements and to disturb the soil as little as possible this cutting was done by hand.
25
Table 1 shows the principal physical characteristics of the above-mentioned soil, as mean values obtained from the structural and granulometric analysis of the upper-soil
HESSD
3, 987–1019, 2006 Measurement methods of saturated hydraulic condutivity C. Fallico et al. Title Page Abstract Introduction Conclusions References Tables Figures J I J I Back CloseFull Screen / Esc
Printer-friendly Version
Interactive Discussion
EGU samples, relative to a depth of 10 cm max.
3 Materials and methods
The measurement of ksfor the (TI) method were performed by means of a single-disc infiltrometer, which consists of a measurement apparatus like that described earlier and works at multiple heads. The disc diameter was 0.20 m and the basis-membrane
5
had a pore diameter of about 53 µm; the contact layer was constituted of white sand with hydraulic conductivity of about 1×10⁻⁴m/s, while its thickness was kept constantly equal to about 1 cm.
The support-surface of the sandy contact layer was adequately prepared before the measurement, removing the grass and proceeding next to levelling and brushing.
10
The contact layer diameter was always fixed slightly greater than that of the disc and often it was realized utilizing a metallic ring with a diameter of 0.25 m.
The ksvalues, with the (TI) method, were determined considering, at least, two con-stant pressure head values, fixed in an increasing manner, and for each of them steady state flow was achieved, continuing to measure the drawdowns of the water level
reser-15
voir and the relative time-ranges for at least another 5 min (Reynolds and Zebchuk, 1996); in every case the ranges were never less than 17 min for each constant head (Philip, 1986; Reynolds et al., 2000).
At the beginning, the reservoir was filled so as to avoid further additions of water during the measurement, which could have generated air bubbles inside the instrument
20
and the air trapped in the soil, for the redistribution of the water in it. (Elrick et al., 1989). To determine ks, the method of simultaneous equations (S.E.A.) was applied. It consists in writing a system with flux equations for each constant head, as indicated by Wooding (1968) and numerous other authors (Logsdon and Jaynes, 1993; Elrick and Reynolds, 1992; Elrick et al., 1995; Angulo-Jaramillo et al., 2000).
25
For the ks measurement, with the (PI) method, a single ring pressure infiltrometer was used; this metallic ring had a diameter of 0.098 m and a 0.06 m high wall, with a
HESSD
3, 987–1019, 2006 Measurement methods of saturated hydraulic condutivity C. Fallico et al. Title Page Abstract Introduction Conclusions References Tables Figures J I J I Back CloseFull Screen / Esc
Printer-friendly Version
Interactive Discussion
EGU thickness of 2.5 mm and a blunted lower rim for making insertion into the ground easy.
For this method each measurement was repeated twice with constant and time-increasing pressure-heads, by acting in such a manner that the water initially present in the reservoir of the measurement device was sufficient to avoid intermediate fillings until the end of the same measurement, which could have caused formation of the air
5
bubbles in the small connection-tubes and in the soil. The time-range of the measure-ment for each of the constant heads was equal to 90 min, so that the measuremeasure-ment in each location presented a range of at least 3 h; so the attainment of steady state flow was guaranteed, which some authors consider sufficient, for the (PI) method, a range max of 30 min for each value of the constant head (Reynolds et al., 2000).
10
Also in this case the ks values were determined with the simultaneous equations ap-proach (S.E.A.) as the modality described in the literature (Reynolds and Elrick, 1990; Reynolds, 1993a).
For the ks measurement by the (SC) method the soil core samples were removed with a small 0.04 m diameter metallic cylinder with a height of 0.05 m, and a sharp
bot-15
tom rim to make ground penetration easy . The samples were all removed in the same location where the measurements had been executed by the (PI) method; specifically, the sample was removed inside the metallic ring of the pressure infiltrometer, consider-ing that the sizes of the latter were greater than those of the metallic cylinder used for the extraction of the samples. The work of sample extraction was effected at the end of
20
the measure by the (PI) method, paying maximum attention to disturb the soil as little as possible, removing at the beginning the material around the small metallic cylinder and successively detaching it from the bottom with the help of the metallic blade.
The ks values for each sample were obtained by using the classical procedure as reported in the literature (Klute and Dirksen, 1986; Reynolds, 1993b); the analysis of
25
these samples and the relative ks value determinations were carried out at the Labo-ratory of the Institute for Land and Water Management of the Katholieke Universiteit of Leuven (Belgium).
HESSD
3, 987–1019, 2006 Measurement methods of saturated hydraulic condutivity C. Fallico et al. Title Page Abstract Introduction Conclusions References Tables Figures J I J I Back CloseFull Screen / Esc
Printer-friendly Version
Interactive Discussion
EGU methods were all modified without considering the temperature changes, the effects of
air trapping and other possible variations of the boundary conditions during the mea-surements.
During this data acquisition campaign further measurements of ks were performed, limited to the (TI) and (PI) methods, also outside of the above-mentioned area, a larger
5
total area equal to 2800 m2 (70 m×40 m) was involved; the principal physical charac-teristics of the soil of this larger area remain equal to the ones relative to the area considered at the beginning and already shown.
4 Statistical analysis
At first, the probability distribution law which better describes the ks data sets
corre-10
sponding to this three different methods was established.
As known, the characteristic parameters of the soil are generally described by a normal statistical frequency distribution or log-normal one (Warrick and Nielson, 1980). In the present study the three sets of the ks values, obtained with the considered methods, were analyzed by both the above-mentioned distribution laws; the results
15
were successively compared, in terms of the determination coefficient R2, determined by considering the linear regression of the reduced variable u versus ks, respectively, for the normal and log-normal distribution.
Successively, for each data set relative to the three methods, (TI) (PI) and (SC), the values of the arithmetical average (M), the geometrical one ¯ks, the amplitude of the sets
20
(A), the coefficient of variation (CV ) and the standard deviation (SD) were estimated, remembering that for the data described according to the log-normal distribution it is necessary to take into account the geometrical average and for the determination of this and the coefficient of variation the fitted relations must be used (Hastings and Peacock, 1975). To make sure of correlation among the various methods, for each
25
of the relative data sets, correlation with the other two was verified, estimating the Pearson correlation coefficient (P ).
HESSD
3, 987–1019, 2006 Measurement methods of saturated hydraulic condutivity C. Fallico et al. Title Page Abstract Introduction Conclusions References Tables Figures J I J I Back CloseFull Screen / Esc
Printer-friendly Version
Interactive Discussion
EGU Moreover, test-F and the test-T were carried out, the former to verify the
homogene-ity of each data-set in terms of variance with the other two, the latter to verify if the sets of each pair could be considered belonging to two populations having the same average value; finally, the Student distribution furnished suggestions about the aver-age value variation range, assuming an interval of confidence equal to 95% (5% level
5
of significance ).
5 Results
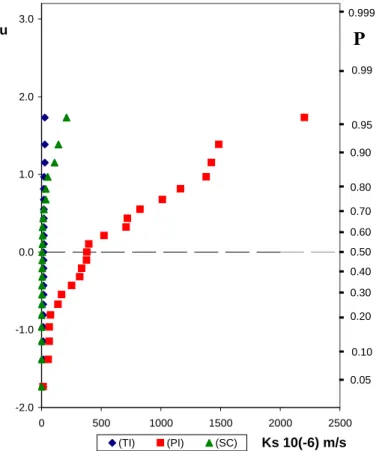
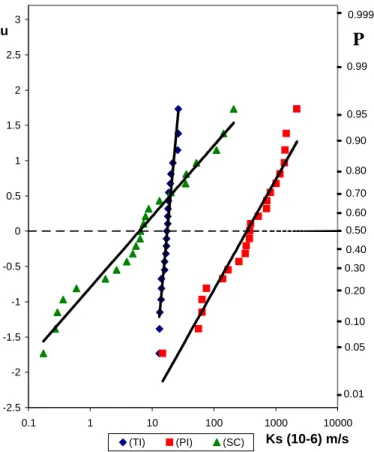
Each of three sets of 23 ks values obtained by the (TI), (PI) and (SC) methods, was statistically described by the normal and log-normal distribution; the results are shown respectively in Fig. 1 and in Fig. 2. Moreover, in Table 2 the values of the determination
10
coefficient R2are shown for each of the measurement methods.
This table, as well as Figs. 1 and 2, in which are shown respectively the represen-tations on normal and log-normal fractil diagrams of these sets with the respective distribution, prove the log-normal distribution is the best fit. Consequently, assuming such a distribution law for the description of the sets of ks values, the parameters M,
15
ks,A, CV and SD are estimated for each of these methods, as shown in Table 3.
The data set obtained by (TI) method presents the value of ¯ksintermediate respect-ing the ones of the sets relative to the (PI) and (SC) methods; for the rest the amplitude
A is less, so also the values of the coefficient of variation CV and standard deviation SD are lower than the other two methods.
20
Regarding the (PI) method, though it generates the data set with a ks value clearly bigger than the other two methods, while the A, CV and SD corresponding values are intermediate.
The (SC) method produces a data set with the ¯ks value lower than the other two methods; on the contrary, the A, CV and SD parameters present the highest values.
25
Table 3 shows that ¯ks assumes different values for all three measurement methods; however, the values of this parameter for the (TI) and (SC) methods, although they
HESSD
3, 987–1019, 2006 Measurement methods of saturated hydraulic condutivity C. Fallico et al. Title Page Abstract Introduction Conclusions References Tables Figures J I J I Back CloseFull Screen / Esc
Printer-friendly Version
Interactive Discussion
EGU present one quantity order of difference, are sufficiently neighbouring and comparable,
while the (PI) one is greater by one order than that of (TI) and by two orders than that of (SC).
However, the coefficient of variation CV relative to the (SC) method is clearly greater than that of (TI) and nearly four times larger than that of the (PI) method; so also the
5
standard deviation SD of the (SC) method is about two times that of the (PI) method and over six times greater than that of (TI).
As already noticed, the greater amplitude belongs to the set of the (SC) method, while the smaller one is the (TI) method amplitude.
The Pearson-correlation coefficients values, determined among pairs of the data
10
sets for verifying the existence of any correlation, are shown in Table 4; this verification was carried out both on normal values and on the logarithmic ones, considering for the latter the transformed variable ln (Hastings and Peacock, 1975).
Test-F and the test-T, carried out on the data sets of these methods, did not provide the significant values, while the Student distribution, in an interval of confidence of
15
95%, provided extreme values of the average shown in Table 5 for each method. Referring to (TI) and (PI) measurements methods on the larger area of 2800 m2 mentioned earlier, it is necessary to underline that the relative sets of values of ks, obtained by the respective methods, are certainly much more numerous than the ones treated till now; the values of ks relative to the (TI) method proved to be in all a good
20
126 while the (PI)-ones 45, specifying that both the sets also include the values of the area of 800 m2, already examined.
Evidently no statistical comparison of the data sets could be carried out because the sets had different dimensions and consequently represented the respective popu-lations which they can be thought to belong to in a different way.
25
However, also for the two further sets of ks values, the representation as normal and log-normal distribution was carried out; in Table 6 the respective values of the coefficient of determination R2are shown; the latter values were calculated for each of the two measurement methods and for each of the distribution laws.
HESSD
3, 987–1019, 2006 Measurement methods of saturated hydraulic condutivity C. Fallico et al. Title Page Abstract Introduction Conclusions References Tables Figures J I J I Back CloseFull Screen / Esc
Printer-friendly Version
Interactive Discussion
EGU Also in this case the greater representative nature of the data by the log-normal
distribution is evident.
In Fig. 3 the representations of the two sets of ks values, also if limited to only the log-normal distribution, were shown again; in the figure, for both the methods, (TI) and (PI), also the distribution plots for the sets of smaller dimensions (23 values) were
5
shown again so as to evidence the variations relative to each methods in spite of the exclusion of their comparison.
To be better able to perform the comparison between sets relative to the same mea-surement method, as shown again in Table 3, the values of the principal statistical parameters of the wide sets are shown in Table 7, they are relative to the (TI) and (PI)
10
methods.
6 Discussion
Describing the ks spatial variability, in many cases the large variability among the val-ues of this parameter both in the context of the same method and in the comparison of the different methods is not important, but rather being able to dispose of a greater
15
number of measurements is determining; in other cases, however, the contrary hap-pens and accuracy appears prevalent on the number (Lee et al., 1985).
On the other hand, focusing on this latter aspect, the differences of the ¯ks values comparable among several methods, by themselves do not provide reliable elements; so also it does not follow that the smaller value of CV or SD should lead to believing that
20
the value of ¯ks be considered more accurate and therefore the corresponding method preferable.
It is, however, necessary and useful to analyze the possible causes which produced the differences of the values of the above-mentioned parameter utilizing different meth-ods, taking in account the principal elements effecting the phenomenon.
25
In the examined case the statistical analysis, compared to what was proved by other researchers (Reynolds et al., 2000), underlined the presence of a significant correlation
HESSD
3, 987–1019, 2006 Measurement methods of saturated hydraulic condutivity C. Fallico et al. Title Page Abstract Introduction Conclusions References Tables Figures J I J I Back CloseFull Screen / Esc
Printer-friendly Version
Interactive Discussion
EGU among the pairs of data relative to measurement methods, resulting in the Pearson
correlation coefficient values shown in Table 4. However, the undoubtedly negative results of the statistical (F and T) tests show that these three different sets of values of ks must be thought of as belonging to three different populations, each of which presents a clearly definite trend, different from others, as proves already evident from
5
the Figs. 1 and 2. The diversity among the sources-populations of the ks value sets, relative to (TI), (PI) and (SC) methods and, after all the different values of ¯ks, must be
attributed, as is known, also to the different techniques and modality of providing some water to the soil, to the different position assumed by macroporosity in each of them for the following principal factors:
10
– characteristic sampling volume of each measurement method; in effect this
vol-ume in the (TI) method is owing to the disc diameter, in the (PI) method to the ring diameter and in the (SC) method to the sampler diameter;
– flux geometry which is three-dimensional in the (TI) method, while it is prevalently
mono-dimensional (vertical direction) in the (PI) and (SC) methods. If the
distri-15
bution of the macropores induces flow directional anisotropy (horizontal/vertical), this circumstance can prove determining;
– soil disturbance, inexistent in the (TI) method, while in (PI) and (SC) methods it is
owing to the ring insertion within the soil, which can truncate before hydraulically activate macropores, stopping or changing the water flow, as already noticed.
20
Referring to the examined case the average value of the hydraulic conductivity ( ¯ks), relatively to the (TI) method, is comparable with the (SC) method one and by far lower than the (PI) method . The disc dimensions of the (TI) method (20 cm) appear, as al-ready noticed, clearly greater than the ring of the (PI) method (9.8 cm) and the sampler of the (SC) method (4 cm), and therefore, substantial differences of structure and
tex-25
ture apart, it is possible to suppose, relative to the (TI) method, an influence on the ¯ks
HESSD
3, 987–1019, 2006 Measurement methods of saturated hydraulic condutivity C. Fallico et al. Title Page Abstract Introduction Conclusions References Tables Figures J I J I Back CloseFull Screen / Esc
Printer-friendly Version
Interactive Discussion
EGU
– the difficulty of the air passage in the Mariotte bottle of the disc infiltrometer or in
the pipes-joint;
– the impediment to the flow owing to the membrane;
– the impediment to the flow owing to the contact sandy layer; – the influence of the algorithm;
5
– the three-dimensionality of the flux geometry.
However, the influence of the above-mentioned factors on the ¯ks value, relative to the (TI) method, most likely, might not have been noticeable, as asserted for the similar cases by other researchers (Reynolds et al., 2000); in fact, the measurements were carried out with the shrewdness necessary to limit these causes, as previously
de-10
scribed. It is likely that other factors had greater weight, owing either to the macrop-ores number present in the locations where the measurements were performed by this method and to the heterogeneity of the soil, or to possibility of their blocking during the procedure of preparation of the measurement surface which could occur, in spite of the great care taken; thus, the choice of the measurement locations could also affect the
15
results, apart from the known subjectivity of the measurement operator.
The high value of ¯ks, relative to the (PI) method, as it has arisen in the present study, requires careful reflection. In effect the (PI) method is not affected by a need to use membranes and contact layers and, at least in this case, it seems evident that any difficulties of air passage into the joint tubes and the Mariotte bottle can be excluded,
20
which in this instrument acts also as reservoir.
It is likely that the ¯ks value of the (PI) method being greater than that of the two other methods is attributable to the soil disturbance during the ring insertion and to the presence of root channels and the presence of worm holes.
Specifically, the presence of roots could have a determining role, useful to furnish
25
HESSD
3, 987–1019, 2006 Measurement methods of saturated hydraulic condutivity C. Fallico et al. Title Page Abstract Introduction Conclusions References Tables Figures J I J I Back CloseFull Screen / Esc
Printer-friendly Version
Interactive Discussion
EGU (TI) method, without excluding, however, possible infuences owing to the already cited
factors, such as the membrane and contact layer.
In effect, although it is undeniable that the greater the intercepted-infiltration area, the greater is the number of macropores which potentially can be present in this area, as also the influence of soil heterogeneity, in the case in examination this circumstance
5
does not seem be confirmed; in fact, according to this reasoning, since the disc diam-eter is by far greater than the ring one, the ¯ks value relative to the (TI) method should have given a result greater than that of the (PI) method, however the opposite situation is verified.
Most likely a reasonable explanation can be found through a careful analysis of the
10
macroporosity influence induced on the soil topper by the grass roots, which, during the measurements, grew spontaneously and quickly on the soil, already soft from the recent working (Beven and Germann, 1982). To disturb the soil as little as possible, the grass was frequently extirpated by hand and with it also the roots; during this operation it was verified that the roots had a length not greater than 10÷12 cm like tufts, often
15
twined around one another.
Therefore, the correspondent macropores, presumably of the same length, were not able to affect the whole infiltration volume relative to the (TI) method, identifiable with a bulb of about a diameter of 30÷40 cm, while certainly they passed through the whole infiltration volume relative to the (PI) method, determining a flow which, although it was
20
substantially vertical in the zone near the surface of the soil, under the metallic walls of the ring, it finished by orienting prevalently in other directions, following the network of macropores produced by these roots.
Between the ¯ks value of the (PI) method and the (SC) method the present-survey difference proves to be much more surprising, because of the coincidence of the
mea-25
surement locations, also because both the methods employ a metallic device in the soil and both of them present a prevalently vertical flow. The causes could reside in numer-ous factors; most likely the difference among the dimensions of the soil volumes which were involved in the two methods, (PI) and (SC), for the calculation of ks, appeared
HESSD
3, 987–1019, 2006 Measurement methods of saturated hydraulic condutivity C. Fallico et al. Title Page Abstract Introduction Conclusions References Tables Figures J I J I Back CloseFull Screen / Esc
Printer-friendly Version
Interactive Discussion
EGU determining. In this case that is clear because of the difference between the ring and
the sampler, but this circumstance was noticed by other researchers also when the two metallic devices, the ring and the sampler, presented the same dimensions (Reynold et al., 2000). In fact, in the (PI) method the infiltration flow produces a saturated soil bulb immediately under the metallic ring, rounded by an unsaturated greater
dimen-5
sion soil zone, with an advancing wetting front; on the contrary, in the (SC) method the whole soil volume considered is only that of the metallic-cylinder soil sample (Elrick and Reynolds, 1992).
On the other hand, since in the (SC) method soil samples were taken out from the inner-part of the ring infiltrometer of the (PI) method, a possible decreasing of the
num-10
ber of the intercepted macropores, because of the reduced dimensions of the sampler with respect to the ring, seems the logical consequence; moreover, these very reduced dimensions could have caused a soil disturbance amplification during insertion, with a consequent increasing of the occlusion influence of the intercepted macropores from metallic sampler walls on the water flow and its consequent drastic reduction.
15
Another significant cause of the difference between these two methods consists in the (PI) method, where soil disturbance takes place only because of the ring insertion, while in that of the (SC) method it takes place because, as well as the insertion of the metallic sampler into the soil, also, and perhaps above all, during its extraction, which, in spite of care taken, can have a noticeable effect. A further difference between these
20
two methods is because the (SC) method requires that the sample, before being ana-lyzed in the laboratory, be saturated and maintained in this condition for a sufficiently long time. In fact, especially in the presence of clay, this can determine the partial or total closing of the splits and macropores, with consequent flow reduction; sometimes, on the contrary, especially in structured soils, the splits and the macropores do not
25
close themselves and often go on to extend themselves uninterruptedly from the top to the bottom of the sample.
In the examined case the soil samples were subjected to saturation for 4 days, before being analyzed in the laboratory. In this time-range the macropores can themselves be
HESSD
3, 987–1019, 2006 Measurement methods of saturated hydraulic condutivity C. Fallico et al. Title Page Abstract Introduction Conclusions References Tables Figures J I J I Back CloseFull Screen / Esc
Printer-friendly Version
Interactive Discussion
EGU occluded because of swilling, given the small clay percentage, less than because of
obstruction phenomena owing to the finer particles, or ceding and collapsing of the walls of the macropores and eventual splits, probably owing to the sometimes exces-sively friable soil state, caused by its evolution, prior to the measurement campaign; in fact, this circumstance can be determining in such a semi-structural soil and can
5
exclude every influence of the grass root channels and macropores network which, on the other hand, is assigned a determining function in the (PI) method.
It cannot be excluded, in spite of such a long saturation period, that sufficient air remained entrapped in the soil samples to stop the water flow through the macropores. As already said, to survey the spatial distribution of ksthe number of measurements
10
is of fundamental importance. In fact, in this case one needs to take into account that when the dimensions of the data sets increase, also the correspondent values of the characteristic parameters M, ¯ks, A, CV and SD change, the larger is the number n of the set values the more it represents the source-population.
Regarding this case, comparing separately the (TI) method and the (PI) method
15
parameter values of Table 3, obtained by two data sets both constituted of 23 values, with the correspondent ones of Table 7, relative to data sets constituted respectively of 126 and 45 values, it is possible to see that, also if the data number increases, very noticeably for the sets of the (TI) method, caused a variation of the above-mentioned parameter values, the ones relative to ¯ks, are not changed significantly, maintaining
20
unchanged the respective order of quantity; the same thing is observed about the arithmetic-average value. Significant changes are obtained, on the contrary, in the amplitude A, coefficient of variation CV and standard deviation SD, as, on the other hand, this was expected.
Here it was not possible to effect any comparison between the two different data
25
sets obtained either by the (TI) method or the (PI) method, because of their different dimensions. However, examining separately the pairs of the data sets correspondent to the same method, a trend variation can be seen for each of the relative belonging-populations, as shown in Fig. 3. This variation proves to be significant only for the (TI)
HESSD
3, 987–1019, 2006 Measurement methods of saturated hydraulic condutivity C. Fallico et al. Title Page Abstract Introduction Conclusions References Tables Figures J I J I Back CloseFull Screen / Esc
Printer-friendly Version
Interactive Discussion
EGU method, for which the increase of data number of sets was noticeable.
7 Conclusions
This study, on the comparison of ks measurement methods, revealed numerous un-certainties owing to the absence of a reference technique and benchmarks; moreover, the extreme difficulty should be noticed, perhaps the impossibility, of obtaining some
5
directions of general validity, because of the great variability of the measurement con-ditions. This is linked either to the different types of soil, or to the different methods and measurement devices utilized.
Thus, according to other researchers (Lee et al., 1985; Reynolds et al., 2000), it is retrained opportune evidence the usefulness of these studies, because they provide
10
information about the devices to adopt during the measurements, on possible inconve-niences and, in the last analysis, on the choice of the measurement method.
On the agricultural soil of the “Turbolo” basin, examined in the present work, several measurements of the saturated hydraulic conductivity ks, were carried out, by using the (TI), (PI) and (SC) methods, analyzing the obtained results statistically and
com-15
paring the more significant statistical parameters of the correspondent data sets, which presented a good degree of correlation.
However, the statistical tests evidenced the clear belonging of three sets of ksvalues to different populations. The maximum amplitude A of the set was the one relative to the (SC) method, as were the coefficient of variation (CV) and standard deviation SD.
20
Referring to the value of ¯ks, the maximum was the one of the set relative to the (PI) method, while the values of the two other methods (TI) and (SC) were noticeably com-parable. The causes of such a difference, even though not evident, can be researched in the following points:
– difference between the reference volumes of each methods;
25
HESSD
3, 987–1019, 2006 Measurement methods of saturated hydraulic condutivity C. Fallico et al. Title Page Abstract Introduction Conclusions References Tables Figures J I J I Back CloseFull Screen / Esc
Printer-friendly Version
Interactive Discussion
EGU
– different procedures of water application inside the soil; – different boundary conditions;
– soil heterogeneity.
Regarding the (TI) method, it seems that the ¯ks value can be considered mainly af-fected by the specific characteristics of the macropores in the measurement soil, then
5
by the local soil heterogeneities, soil preparation procedures and, perhaps to a lesser degree, by other causes outlined earlier.
Relating to the (PI) method, as well as to the soil heterogeneity, a noticeable influ-ence can be assigned to the disturbance of the ring insertion into the soil and to the presence of roots, that, very likely, may have influenced the macroporosity, in a
deter-10
mining manner and with the modality as shown above, and, in a less probable way, to the remaining reasons listed above. The ¯ksvalues obtained by the (SC) method, lower than for the two other methods, very probably are caused by the soil sample distur-bance owing to the extraction and eventual macroporosity variations occurring during the saturation and, above all, to the limited sampler dimensions and, therefore, to the
15
corresponding intercepted area, without, however, excluding the possible influence of other above-cited factors.
Therefore, it is rational to believe that, in this case, the (PI) method over-estimated the ¯ks value, while the (TI) and (SC) methods under-estimated this parameter.
In other words it can be considered that the (PI) and (SI) methods provide a ¯ks
20
value, more representative of the soil layer nearer to the surface (about 10÷15 cm), the first tending to give over-estimated values of this parameter and the second under-estimated values: while the (TI) method provides a representative value of the larger soil volume about 30÷40 cm of depth, with a probable under-estimation of ¯ksfor above-stated the reason.
25
On the basis of this behaviour, in each case the different function of the macrop-orosity in the three methods, (TI),(PI) and (SC), remains and the foregoing is intended
HESSD
3, 987–1019, 2006 Measurement methods of saturated hydraulic condutivity C. Fallico et al. Title Page Abstract Introduction Conclusions References Tables Figures J I J I Back CloseFull Screen / Esc
Printer-friendly Version
Interactive Discussion
EGU to furnish suggestions about the modality affecting the ks measurements in each of
considered methods (Bouma, 1982; Beven and Germann, 1982).
The choice of the method to adopt is certainly not simple, because it is not pos-sible to assume that the measurements carried out by means one of them is more reliable than the ones effected by means of the others; however, it is certainly possible
5
to underline the usefulness of taking into account the circumstances emerging in the context of the present investigation and the opportunity to estimate carefully, case by case, the inconveniences which one meets using each of the considered methods and the possible remedies.
In any case it is necessary to point out that, as expected, the results obtained by
10
means of a comparison of the three methods considered in this work do not always prove to be coincident with those obtained by other researchers, who effected similar investigations on soil of the same type (Reynolds et al., 2000; Lee et al., 1985). These differences, expected, because of the difficulty already referred to, of generalizing the results, very probably, can be associated with the specific conditions of the texture
15
and structure of the different soils, which confirms the determining influence that such characteristics can have on the values of the investigated parameters, such as the hydraulic conductivity ¯ks (Bouma, 1983).
From the present investigation it seems, however, clear that the difference among ¯ks values,measured through different methods, depends prevalently on the particularities
20
of the individual methods and certainly to a lesser extent, on the choice of the mea-surement location, just as it emerges from the diversity of the ¯ks values obtained by the (PI) and (SC) methods, whose measurements were carried out at the same loca-tion, and, instead, on the relative proximity among the values of this parameter for the (TI) and (SC) methods, whose measurements were carried out at completely different
25
locations.
Regarding the influence that the number of measurements can have on the results of investigations of this type, from the present study, limited to the (TI) and (PI) methods, only an improvement of the statistical significance of the single data sets emerges,
HESSD
3, 987–1019, 2006 Measurement methods of saturated hydraulic condutivity C. Fallico et al. Title Page Abstract Introduction Conclusions References Tables Figures J I J I Back CloseFull Screen / Esc
Printer-friendly Version
Interactive Discussion
EGU while the values of the respective investigated parameters have not undergone
sub-stantial changes.
However, it is necessary to specify that here only the strictly statistical influence was considered, without taking into account the possible influence of an increase in the investigation area, despite verifying the permanence of the same typology and
5
the same soil characteristics, because the present study did not in any way intend to consider aspects relative to the spatial variability of hydraulic conductivity.
It can be confirmed that the choice of the method for the measurement of saturated hydraulic conductivity ¯ksis certainly not simple, but careful valuation of the advantages and the limits of each of the three considered methodologies can help to individuate the
10
most suitable and convenient method to solve the specific problem under examination.
Acknowledgements. The authors thank J. Feyen, Director of the Institute for Land and Water
Management of the Katholieke Universiteit Leuven (Belgium), for his precious suggestions and to have allowed this research, furnishing the measurement devices and performing the labo-ratory tests; furthermore they thank, also, J. Mertens, Researcher of the same institute, who
15
participated in the initial stage of the research.
References
Angulo-Jaramillo, R., Vandervaere, J. P., Roulier, S., Thony, J. L., Gaudet, J. P., and Vauclin, M.: Field measurement of soil surface hydraulic properties by disc and ring infiltrometers. A review and recent developments, Soil & Tillage Research, 55, 1–29, 2000.
20
Ankeny, M. D., Ahmed, M., Kaspar, T. C., and Horton, R.: Simple field method for determining unsaturated hydraulic conductivity, Soil Sci. Soc. Am. J., 55, 467–470, 1991.
Bagarello, V. and Provenza, G.: Factors affecting field and laboratory measurements of satu-rated hydraulic conductivity, Trans. ASHE, 39, 153–159, 1996.
Beven, K. and Germann, P.: Macropores and water flow in Soils, Water Resour. Res., 18, 5,
25
1311–1325, 1982.
Bouma, J.: Field measurement of soil hydraulic properties characterizing water movement through swelling clay soils, J. Hydrol., 45, 149–158, 1980.
HESSD
3, 987–1019, 2006 Measurement methods of saturated hydraulic condutivity C. Fallico et al. Title Page Abstract Introduction Conclusions References Tables Figures J I J I Back CloseFull Screen / Esc
Printer-friendly Version
Interactive Discussion
EGU Bouma, J.: Measuring the hydraulic conductivity of soil horizons with continuous macropores,
Soil Sci. Soc. Am. J., 46, 438–441, 1982.
Bouma, J.: Use of soil survey data to select measurement techniques for hydraulic conductivity, Agric. Water Manage, 6, 177–190, 1983.
Clemente, R. S., De Jong, R., Hayhoe, H. N., Reynolds, W. D., and Hares, M.: Testing and
5
comparison of three unsaturated soil water flow models, Agric. Water Manage, 25, 135–152, 1994.
Elrick, D. E., Reynolds, W. D., and Tan, K. A.: Hydraulic conductivity measurements in the unsaturated zone using improved well analysis, Graundwater Monit. Rev., 9, 184–193, 1989. Elrick, D. E. and Reynolds, W. D.: Infiltration from constant-head well permeameters and
in-10
filtrometers, in: Advances in measurement of soil physical properties: Bringing theory into practice, edited by: Topp, G. C., Reynolds, W. D., and Green, R. E., SSSA Spec. Publ., 30, Madison, WI, 1–24, 1992.
Elrick, D. E., Parkin, G. W., Reynolds, W. D., and Fallow, D. J.: Analysis of early-time and steady-state single-ring infiltration under falling head conditions, Water Resour. Res., 31,
15
1883–1893, 1995.
Hastings, N. A. J. and Peacock, J. B.: Statistical distributions, Halsted Press, New York, 1975. Herman, S., Mertens, J., Timmerman, A., and Feyen, J.: Comparison of tension infiltrometer,
single-ring pressure infiltrometer and soil core Ksat estimates on a sandy loam hillslope, Proceedings of EGS-AGU-EUG Joint Assembly, Nice (France), 2003.
20
Hillel, D.: Applications of soil physics. Academic Press, New York, USA, 1980.
Klute, A. and Dirksen, C.: Hydraulic conductivity and diffusivity: Laboratory methods, in: Meth-ods of soil analysis, edited by: Klute, A., Part. 1. 2nd. Ed. Agron. Monogr. 9, ASA and SSSA, Madison, WI, 687–734, 1986.
Lee, D. M., Reynolds, W. D., Eldrick, D. E., and Clothier, B. E.: A Comparison of Three Field
25
Methods for Measuring Saturated Hydraulic Conductivity, Can. J. Soil Sci., 65, 563–573, 1985.
Logsdon, S. D. and Jaynes, D. B.: Methodology for determining hydraulic conductivity with tension infiltrometers, Soil Sci. Soc. Am. J., 57, 1426–1431, 1993.
Mertens, J., Jacques, D., Vanderborght, J., and Feyen, J.: Characterisation of the
field-30
saturated hydraulic conductivity on a hillslope: In situ single ring pressure infiltrometer mea-surements, J. Hydrol., 263, 217–229, 2002.
HESSD
3, 987–1019, 2006 Measurement methods of saturated hydraulic condutivity C. Fallico et al. Title Page Abstract Introduction Conclusions References Tables Figures J I J I Back CloseFull Screen / Esc
Printer-friendly Version
Interactive Discussion
EGU 1215, 1988.
Philip, J. R.: Linearized unsteady multidimensional infiltration, Water Resour. Res., 22, 1717– 1727, 1986.
Reynolds, W. D.: Saturated hydraulic conductivity: Field measurement, in: Soil Sampling and methods of analysis, edited by: Carter, M. R., Can. Soc. Soil Sci., Lewis Publ., Boca Raton,
5
FL, 599–613, 1993a.
Reynolds, W. D.: Saturated hydraulic conductivity: Laboratory measurement, in: Soil Sampling and methods of analysis, edited by: Carter, M. R., Can. Soc. Soil Sci., Lewis Publ., Boca Raton, FL, 589–598, 1993b.
Reynolds, W. D. and Elrick, D. E.: Ponded infiltration from a single ring. Part. 1. Analysis of
10
steady flow, Soil Sci. Soc. Am. J., 54, 1233–1241, 1990.
Reynolds, W. D. and Elrick, D. E.: Determination of hydraulic conductivity using a tension infiltrometer, Soil Sci. Soc. Am. J., 55, 633–639, 1991.
Reynolds, W. D. and Zebchuk, W. D.: Use of contact material in tension infiltrometer measure-ments, Soil Tech., 9, 141–159, 1996.
15
Reynolds, W. D., Bowman, B. T., Brune, R. R., Drury, C. F., and Tan., C. S.: Comparison of Tension Infiltrometer, Pressure Infiltrometer and Soil Core Estimates of Saturated Hydraulic Conductivity, Soil Sci. Soc. Am. J., 64, 478–484, 2000.
Warrick, A. W. and Nielsen, D. R.: Spatial variability for soil physical properties in the field, in: Applications of soil physics, Hillel, D., Academic Press, Toronto, 319–344, 1980.
20
White, I., Sully, M. J., and Perroux, K. M.: Measurement of surface-soil hydraulic properties: Disk permeameters, Tension infiltrometers and other techniques, in: Advances in mea-surement of soil physical properties: Bringing theory into practice, edited by: Topp, G. C., Reynolds, W. D., and Green, R. E., SSSA Spec. Publ. 30, SSSA, Madison, WI, 69–103, 1992.
25
Wooding, R. A.: Steady infiltration from a shallow circular pond, Water Res., 4, 1259–1273, 1968.
HESSD
3, 987–1019, 2006 Measurement methods of saturated hydraulic condutivity C. Fallico et al. Title Page Abstract Introduction Conclusions References Tables Figures J I J I Back CloseFull Screen / Esc
Printer-friendly Version
Interactive Discussion
EGU
Table 1. Soil physical characteristics.
% of the soil soil type Soil texture in top Soil structure in top samples (USDA classification) mean values (early 10 cm) (early10 cm)
Sand % slim Clay %
70 Sandy loam 60 26 14 single grain, friable, with high presence of bio-pores, roots and aggre-gates
HESSD
3, 987–1019, 2006 Measurement methods of saturated hydraulic condutivity C. Fallico et al. Title Page Abstract Introduction Conclusions References Tables Figures J I J I Back CloseFull Screen / Esc
Printer-friendly Version
Interactive Discussion
EGU
Table 2. Goodness of fit of cumulative normal and lognormal ks distributions as described by
the coefficient of determination R2
.
Measurement Values of R2for the Values of R2for the method normal distribution log-normally
distribution
TI 0.875 0.0929
PI 0.858 0.937
HESSD
3, 987–1019, 2006 Measurement methods of saturated hydraulic condutivity C. Fallico et al. Title Page Abstract Introduction Conclusions References Tables Figures J I J I Back CloseFull Screen / Esc
Printer-friendly Version
Interactive Discussion
EGU
Table 3. Mean values (M and ¯ks), range (A=ksmax−ksmin), coefficient of variation (CV) and
standard deviation (SD) for the sets of 23 ksvalues relative to each of considered methods.
Measurement M (m/s) k¯s× 10−5(m/s) A (Range) CV(%) SD method
TI −10.97 1.72 0.70 19.93 1.22 PI −10.03 33.91 6.28 207.74 5.07 SC −11.99 0.62 7.09 786.24 7.65
HESSD
3, 987–1019, 2006 Measurement methods of saturated hydraulic condutivity C. Fallico et al. Title Page Abstract Introduction Conclusions References Tables Figures J I J I Back CloseFull Screen / Esc
Printer-friendly Version
Interactive Discussion
EGU
Table 4. Pearson correlation coefficients (P) of (TI), (PI) and (SC) methods, for normal value
and for ln-transformed.
Measurement method P
normal series ln-transformed series TI vs. PI 0.952 0.920
TI vs. SC 0.883 0.972 PI vs. SC 0.896 0.974
HESSD
3, 987–1019, 2006 Measurement methods of saturated hydraulic condutivity C. Fallico et al. Title Page Abstract Introduction Conclusions References Tables Figures J I J I Back CloseFull Screen / Esc
Printer-friendly Version
Interactive Discussion
EGU
Table 5. Variation ranges of the average value ¯ks estimated by the Student distribution, for the interval of confidence of 95%.
Measurement method Range of ¯ks
normal values−6(m/s) ln-transformed values TI 16 225÷19 678 −11 042÷−10 860 PI 362 634÷863 519 −10 730÷−9338 SC 6475÷51 980 −12 865÷−11 120
HESSD
3, 987–1019, 2006 Measurement methods of saturated hydraulic condutivity C. Fallico et al. Title Page Abstract Introduction Conclusions References Tables Figures J I J I Back CloseFull Screen / Esc
Printer-friendly Version
Interactive Discussion
EGU
Table 6. Goodness of fit of cumulative normal and lognormal ks distributions as described by
the coefficient of determination R2, for the sets of ks values relative to (TI) and (PI) methods
and an area of 2800 m2.
Measurement method Values of R2for the normal Values of R2for the log-normal distribution distribution
(TI)Tot 0.670 0.857
HESSD
3, 987–1019, 2006 Measurement methods of saturated hydraulic condutivity C. Fallico et al. Title Page Abstract Introduction Conclusions References Tables Figures J I J I Back CloseFull Screen / Esc
Printer-friendly Version
Interactive Discussion
EGU
Table 7. Mean values of the main statistical parameters for the wide sets of ks values,relative
to (TI) and (PI) methods.
Measurement method n M k¯s×10−5 (m/s) A(Range) CV SD TI 126 −10.93 1.79 4.51 78.73 2.00 PI 45 −7.67 46.74 5.66 209.43 3.66
HESSD
3, 987–1019, 2006 Measurement methods of saturated hydraulic condutivity C. Fallico et al. Title Page Abstract Introduction Conclusions References Tables Figures J I J I Back CloseFull Screen / Esc
Printer-friendly Version Interactive Discussion EGU -2.0 -1.0 0.0 1.0 2.0 3.0 0 500 1000 1500 2000 2500 Ks 10(-6) m/s u (TI) (PI) (SC)
P
0.999 0.99 0.95 0.90 0.80 0.70 0.60 0.50 0.40 0.30 0.20 0.10 0.05Fig. 1. Fractil diagram of the ks values by the normal distribution, for the (TI), (PI) and (SC) measurement methods.
HESSD
3, 987–1019, 2006 Measurement methods of saturated hydraulic condutivity C. Fallico et al. Title Page Abstract Introduction Conclusions References Tables Figures J I J I Back CloseFull Screen / Esc
Printer-friendly Version Interactive Discussion EGU -2.5 -2 -1.5 -1 -0.5 0 0.5 1 1.5 2 2.5 3 0.1 1 10 100 1000 10000 Ks (10-6) m/s u (TI) (PI) (SC)
P
0.999 0.99 0.95 0.90 0.80 0.70 0.60 0.50 0.40 0.30 0.20 0.10 0.05 0.01Fig. 2. Fractil diagram of the ksvalues by the log-normal distribution, for the (TI), (PI) and (SC)
HESSD
3, 987–1019, 2006 Measurement methods of saturated hydraulic condutivity C. Fallico et al. Title Page Abstract Introduction Conclusions References Tables Figures J I J I Back CloseFull Screen / Esc
Printer-friendly Version Interactive Discussion EGU -4 -3 -2 -1 0 1 2 3 4 0.1 1 10 100 1000 10000 Ks 10(-6) m/s u (TI) (PI) P 0.999 0.99 0.95 0.90 0.80 0.70 0.60 0.50 0.40 0.30 0.20 0.10 0.05 0.01 0.001
Fig. 3. Fractil diagram of the ks values by the log-normal distribution, for two wide data sets
relative to the (TI) (126 data) and (PI) (45 data) methods and comparison between the corre-spondent distributions relative to reduced sets of 23 data.