HAL Id: hal-00296998
https://hal.archives-ouvertes.fr/hal-00296998
Submitted on 30 May 2007
HAL is a multi-disciplinary open access
archive for the deposit and dissemination of
sci-entific research documents, whether they are
pub-lished or not. The documents may come from
teaching and research institutions in France or
abroad, or from public or private research centers.
L’archive ouverte pluridisciplinaire HAL, est
destinée au dépôt et à la diffusion de documents
scientifiques de niveau recherche, publiés ou non,
émanant des établissements d’enseignement et de
recherche français ou étrangers, des laboratoires
publics ou privés.
Evaluation of evapotranspiration methods for model
validation in a semi-arid watershed in northern China
K. Schneider, B. Ketzer, L. Breuer, K. B. Vaché, C. Bernhofer, H.-G. Frede
To cite this version:
K. Schneider, B. Ketzer, L. Breuer, K. B. Vaché, C. Bernhofer, et al.. Evaluation of evapotranspiration
methods for model validation in a semi-arid watershed in northern China. Advances in Geosciences,
European Geosciences Union, 2007, 11, pp.37-42. �hal-00296998�
www.adv-geosci.net/11/37/2007/ © Author(s) 2007. This work is licensed under a Creative Commons License.
Advances in
Geosciences
Evaluation of evapotranspiration methods for model validation in a
semi-arid watershed in northern China
K. Schneider1, B. Ketzer2, L. Breuer1, K. B. Vach´e1, C. Bernhofer2, and H.-G. Frede1
1Institute of Landscape Ecology and Resources Management, Justus-Liebig-Universit¨at Gießen, Heinrich-Buff-Ring 26,
35392 Gießen, Germany
2Institute of Hydrology and Meteorology, Technische Universit¨at Dresden, 01062 Dresden, Germany
Received: 15 January 2007 – Revised: 10 April 2007 – Accepted: 15 May 2007 – Published: 30 May 2007
Abstract. This study evaluates the performance of four
evap-otranspiration methods (Priestley-Taylor, Penman-Monteith, Hargreaves and Makkink) of differing complexity in a semi-arid environment in north China. The results are compared to observed water vapour fluxes derived from eddy flux mea-surements. The analysis became necessary after discharge simulations using an automatically calibrated version of the Soil and Water Assessment Tool (SWAT) failed to reproduce runoff measurements. Although the study area receives most of the annual rainfall during the vegetation period, high tem-peratures can cause water scarcity. We investigate which evapotranspiration method is most suitable for this environ-ment and whether the model performance of SWAT can be improved with the most adequate evapotranspiration method. The evapotranspiration models were tested in two con-secutive years with different rainfall amounts. In general, the simple Hargreaves and Makkink equations outmatch the more complex Priestley-Taylor and Penman-Monteith meth-ods, although their performance depended on water availabil-ity. Effects on the quality of SWAT runoff simulations, how-ever, remained minor. Although evapotranspiration is an im-portant process in the hydrology of this steppe environment, our analysis indicates that other driving factors still need to be identified to improve SWAT simulations.
1 Introduction
Measuring and modelling key features of the hydrology of semi-arid watersheds can hold unexpected challenges as compared to similar work developed in humid environments. Precipitation and temperature patterns differ, which when combined with additional differences in soil and vegetation properties, lead to a significant shift in the distribution of
Correspondence to: K. Schneider
(katrin.schneider@agrar.uni-giessen.de)
runoff processes. In humid regions, relatively low intensity long duration precipitation over soils with relatively high in-filtration capacities lead to a characteristic pattern of downs-lope wetting and a high likelihood of lateral subsurface flows. While there is considerable evidence to suggest that the de-gree of connectivity and convergence is not as high as one might predict based upon the topographic index (Western, et al., 1999; Seibert et al., 2004), various simulations relying on the concept of connected lateral subsurface flows have been successfully developed in wet catchments. These include a wide variety of applications using the TOPMODEL concept (where the classic example is Beven and Kirkby, 1979) or Dupuit Forchheimer theory (Wigmosta et al., 1994; Vache and McDonnell, 2006). In addition, simulations using the semi-distributed SWAT (Soil and Water Assessment Tool) model were shown to improve, for the Dill catchment, Ger-many, with the explicit incorporation of lateral subsurface flows (Eckhardt et al., 2002). In more arid regions, the de-gree of connectivity declines, process non-linearity increases and models that perform acceptably in humid environments may need to be adapted. A key component of this adapta-tion is the realizaadapta-tion that evapotranspiraadapta-tion (ET) may play a significantly larger role in the water balance of semi-arid catchments, and may therefore be a focus of catchment sim-ulations in these regions.
In our study catchment, the Xilin River, in Inner Mongo-lia, P.R. China, runoff ratios are extremely low and ET flux measurements are relatively high, suggesting that finding an appropriate ET method is a key component in the develop-ment of any hydrological model.
Many equations to model ET are available. One of the most common used ones is the Penman-Monteith (PM) for-mula. It is recommended by the FAO (Allen et al., 1998) as reference ET (adapted from grass ET when water is not limited). Nevertheless ET often has to be estimated under water stress conditions. Several studies investigated which method is most suitable for semi-arid areas (Frank, 2003;
38 K. Schneider et al.: Evaluation of evapotranspiration methods
Fig. 1. Outline of the Xilin river catchment with the location of the
eddy flux station situated in the subcatchment relevant for the study. IMGERS: Inner Mongolia Grassland Ecosystem Research Station.
DehghaniSanij et al., 2004; Kurc and Small, 2004). Liu and Erda (2005) compared the Priestley-Taylor (PT) method with the reference crop PM equation for six weather stations in the semi-arid northern China. As PT only delivers acceptable re-sults under certain conditions, they recommend the PM equa-tion. This is in agreement with L´opez-Urrea et al. (2006), who tested seven ET methods in semi-arid regions in Spain. They found the PM method to be most suitable, but under-line that also simpler methods (e.g. Hargreaves) performed surprisingly well.
Preliminary model results for the present hydrological case study of the Xilin river catchment using the Soil Water Assessment Tool (SWAT, Arnold et al. 1998) are unsatisfy-ing. The model structure is unable to capture (1) the spring snowmelt peak and (2) summer discharge. Modelled spring snowmelt is far too low as compared to observed data, and summer peaks are considerably higher than observed under extreme precipitation events, but much lower under average conditions. Temporal dynamics, as well as annual discharge, are not captured. As neither manual nor automatic calibra-tion improved the model performance to an acceptable de-gree we seek alternative ways to understand and finally sim-ulate the hydrological processes in this semi-arid catchment. In a first step we focus on the summer discharge. Due to high temperatures, the watershed can be water limited even during the wet vegetation period. Thus evaporation and tran-spiration magnitudes are a key component of the hydrologic cycle. To evaluate the potential role of ET simulation er-rors in the SWAT results, we independently analyse the per-formance of several ET methods, all of which are supplied within the model. The modelled ET rates are compared to water fluxes measured by the eddy covariance technique.
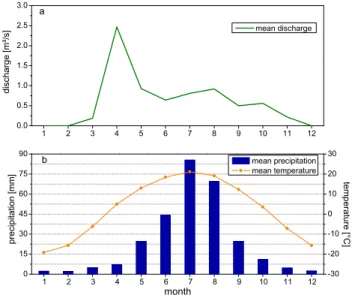
1 2 3 4 5 6 7 8 9 10 11 12 0 15 30 45 60 75 90 1 2 3 4 5 6 7 8 9 10 11 12 0.0 0.5 1.0 1.5 2.0 2.5 3.0 -30 -20 -10 0 10 20 30 p re ci p it a ti o n [ m m ] month mean precipitation mean temperature d isch a rg e [ m ³/ s] mean discharge a te m p e ra tu re [° C ] b
Fig. 2. Mean discharge (a) and precipitation and temperature (b) in
Xilin river catchment.
Table 1. Data requirements of the four ET models.
parameter PM PT HG MK
Air temperature X X X X
Relative humidity X X X
Solar radiation X X X
Wind speed X
2 Materials and methods
2.1 Study area
The study site is located approximately 400 km north of Beijing at the southern rim of the Xilin river catchment (3650 km2)in the Province of Inner Mongolia (P.R. China) (Fig. 1). It belongs to the Eurasian steppe ecosystem and
is marked by a continental climate (Fig. 2a). The mean
monthly temperature amplitude ranges between 18◦C (July)
to −23◦C (January). Mean annual precipitation is 350 mm,
but is highly variable between 150 to 500 mm. The wet sea-son from June to August receives 60–80% of annual rainfall (Chen, 1988); nevertheless precipitation during the vegeta-tion period differs among years (Xiao et al., 1995).
In contrast to the distinct precipitation peak during the summer months, the hydrograph does not reflect the annual precipitation cycle: despite low snow rates during the win-ter months (November to March) vernal discharge reaches highest values during the melt period, whereas the precipita-tion peak in June and July does not result in high discharge (Fig. 2b).
Table 2. Summary of precipitation, observed and calculated ET for 2004 and 2005.
rainfall observed ET PT PM HG MK
16.8.–30.9.2004 82.6 99.3 92.1 81.3 107.4 104.3
Deviation from observed (%) −7 −18 8 5
15.5.–24.9.2005 113.1 174.5 140.0 145.0 164.0 155.3
Deviation from observed (%) −19.8 −16.9 −6 −11.2
2.2 Model and observational data
2.2.1 The SWAT model
SWAT is a semi-distributed eco-hydrological model. Water fluxes are calculated for unique soil and land use combi-nations (Hydrological Response Units, HRU) within a sub-catchment. After deriving surface runoff and infiltration pro-cesses, evaporation and transpiration are calculated, thus re-ducing the available water for percolation or river runoff. The fluxes calculated for each HRU are accumulated within the relevant subcatchment and then routed along the stream net-work to the watershed outlet.
Several methods with varying data requirements for evap-otranspiration estimation are incorporated in SWAT: the rather complex Penman-Monteith (PM) and Priestley-Taylor (PT) methods, and the simpler Hargreaves (HG) formula (see Neitsch et al. (2001) for details). The modified SWAT-G ver-sion, which is used for all model runs in this study (Eckhardt et al., 2002), was further extended by the Makkink (MK) method, a simplified version of the PT formula (Makkink, 1957; De Bruin and Lablans, 1998). The parameters required for the ET models are given in Table 1. In SWAT, the ET methods estimate potential ET (PET) as a first step. Actual ET (AET) is then derived from PET as a function of plant pa-rameters and water storage in the soil (Neitsch et al., 2001). In the present work all ET methods were applied in an uncal-ibrated mode.
2.2.2 Eddy flux measurements
Evapotranspiration rates were derived from measurements of an eddy flux station located on experimental sites in the southern part of the catchment. The change of water vapour concentration was measured with an open path infrared gas analyser (LI-7500, LI-COR Inc., Lincoln, Nebraska, USA). In combination with wind speed and wind direction measure-ments (CSAT3, Campbell Scientific Inc., UK), an eddy co-variance approach was applied to calculate latent heat fluxes. Actual evapotranspiration was derived from this calculation. The observed and modelled evapotranspiration rates are compared for the summer of 2004 (16 August–30 Septem-ber) and 2005 (15 May–24 SeptemSeptem-ber). Though SWAT was
run for the 3600 km2 catchment, we only compared
mea-sured AET with modelled AET data from the subcatchment
where the eddy flux tower is located (Fig. 1). Precipitation during the study period was measured at the eddy flux sta-tion. This data is assigned to the subcatchment in the SWAT model, so the comparison is based on uniform precipitation data. Precipitation for the rainy season from May to Septem-ber was 288 mm in 2004 and 125 mm in 2005 (measured at Inner Mongolia Grassland Research Station, see Fig. 1). The comparison of the different ET methods thus also comprises an evaluation on how the methods perform under varying boundary conditions (normal vs. dry year).
3 Results and discussion
3.1 Comparison of summer sums
Observed and calculated ET sums for 2004 and 2005 are given in Table 2. Summer precipitation was much higher in 2004 than in 2005. In 2004, PT and PM underestimate, and HG and MK overestimate measured ET. Calculated ET does not fit observed ET exactly, yet the deviation from measure-ments is moderate. Though the MK method shows lowest deviation from measured ET, all methods perform in an ac-ceptable way.
In contrast, we found higher differences in the much dryer summer of 2005. During a very dry period from 16 August to 24 September with only 5 mm of precipitation observed and calculated ET rates show marked deviations which reach up to 40% of the observed ET values (data not shown).
The deviations from observed ET are lower when the com-plete measurement period 2005 (15 May–24 September) is considered. The models seem to smoothen out extremes throughout the vegetation period. Yet, all ET methods under-estimate observed ET when the complete monitoring period of 2005 is analysed, but yield overestimations during the very dry period. Overestimation occurs more pronounced under dry conditions and deviations from observed data tend to rise under high water deficits.
3.2 Comparison of daily ET
Figures 3a–d compares observed and modelled ET rates in daily time steps. In 2004 all models reflect observations in an acceptable way, though PM partly underestimates and HG and MK partly overestimate measurements. Both, observed
40 K. Schneider et al.: Evaluation of evapotranspiration methods 1 6 .0 8 .2 0 0 4 0 4 .0 9 .2 0 0 4 2 4 .0 9 .2 0 0 4 2 2 .0 5 .2 0 0 5 1 1 .0 6 .2 0 0 5 0 1 .0 7 .2 0 0 5 2 1 .0 7 .2 0 0 5 1 0 .0 8 .2 0 0 5 3 0 .0 8 .2 0 0 5 1 9 .0 9 .2 0 0 5 0 1 2 3 4 5 6 7 8 9 10 30 28 26 24 22 20 18 16 14 12 10 8 6 4 2 0 E T a [ m m ] p re c ip ita tio n [m m ] measured ET Priestley-Taylor (a) 1 6 .0 8 .2 0 0 4 0 4 .0 9 .2 0 0 4 2 4 .0 9 .2 0 0 4 2 2 .0 5 .2 0 0 5 1 1 .0 6 .2 0 0 5 0 1 .0 7 .2 0 0 5 2 1 .0 7 .2 0 0 5 1 0 .0 8 .2 0 0 5 3 0 .0 8 .2 0 0 5 1 9 .0 9 .2 0 0 5 0 1 2 3 4 5 6 7 8 9 10 30 28 26 24 22 20 18 16 14 12 10 8 6 4 2 0 E T a [ m m ] p re c ip ita tio n [m m ] (b) measured ET Penman-Monteith 1 6 .0 8 .2 0 0 4 0 4 .0 9 .2 0 0 4 2 4 .0 9 .2 0 0 4 2 2 .0 5 .2 0 0 5 1 1 .0 6 .2 0 0 5 0 1 .0 7 .2 0 0 5 2 1 .0 7 .2 0 0 5 1 0 .0 8 .2 0 0 5 3 0 .0 8 .2 0 0 5 1 9 .0 9 .2 0 0 5 0 1 2 3 4 5 6 7 8 9 10 30 28 26 24 22 20 18 16 14 12 10 8 6 4 2 0 E T a [ m m ] p re c ip ita tio n [m m ] (c) measured ET Hargreaves 1 6 .0 8 .2 0 0 4 0 4 .0 9 .2 0 0 4 2 4 .0 9 .2 0 0 4 2 2 .0 5 .2 0 0 5 1 1 .0 6 .2 0 0 5 0 1 .0 7 .2 0 0 5 2 1 .0 7 .2 0 0 5 1 0 .0 8 .2 0 0 5 3 0 .0 8 .2 0 0 5 1 9 .0 9 .2 0 0 5 0 1 2 3 4 5 6 7 8 9 10 30 28 26 24 22 20 18 16 14 12 10 8 6 4 2 0 E T a [ m m ] p re c ip ita tio n [m m ] (d) measured ET Makkink
Fig. 3. Observed vs. measured ET ((a) Priestley-Taylor, (b) Penman-Monteith, (c) Hargreaves, (d) Makkink).
and modelled ET rates are on a lower level in 2005 than in the previous year. Except for the PM model, none of the ET methods show high anomalies from observed ET val-ues. The more complex PT and PM models show higher amplitudes as compared to observational data or the sim-pler HG and the MK methods. None of the models produces systematic under- or overestimation compared to observed data, and fluctuate above or beneath the observed data. The ability of the four ET methods to reproduce daily ET mea-surements was assessed with the Nash-Sutcliffe-Efficiency
(NSE) (Nash and Sutcliffe, 1970). The closer NSE
ap-proaches 1, the better modelled and observed values match. Table 3 shows the results for 2004 and 2005. Though the MK method has lowest deviation from observed in 2004, only the PT method reaches a NSE of more than 0.5. The quality
of the calculations clearly decreases in 2005, as all methods have negative NSE values. PT and PM perform particularly bad in 2005. Our results suggest that the simpler HG and MK methods are superior to the more complex PT and PM meth-ods. The MK method performs unexpectedly well consider-ing that it was developed under temperate humid conditions.
3.3 Influence of ET method on SWAT output
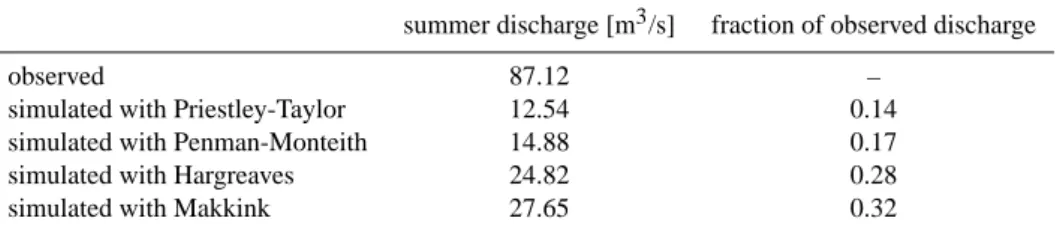
Though the four ET methods yield different results, none of them leads to satisfying predictions of discharge with the SWAT model. Table 4 summarises observed and simulated mean discharge sums for the vegetation period. All simu-lations underestimate discharge and fail to reproduce obser-vations. Even the “best” simulation using the MK method estimates only one third of actual discharge. None of the ET
Table 3. Quality of ET simulations in 2004 and 2005 (NSE: Nash-Sutcliffe-Efficiency, RMSE: Root Mean Square Error).
PT PM HG MK
2004 2005 2004 2005 2004 2005 2004 2005
NSE 0.648 −0.636 −0.001 −0.474 0.285 −0.028 0.275 −0.004
RMSE 0.413 0.879 0.696 0.834 0.588 0.697 0.593 0.688
Table 4. Mean accumulated summer discharge (1 May–30 Sep) calculated from observed data and SWAT simulations with four ET methods.
Values are calculated from 8 consecutive years with available data.
summer discharge [m3/s] fraction of observed discharge
observed 87.12 –
simulated with Priestley-Taylor 12.54 0.14
simulated with Penman-Monteith 14.88 0.17
simulated with Hargreaves 24.82 0.28
simulated with Makkink 27.65 0.32
methods clearly improves the SWAT simulations. In conse-quence, other processes might influence model performance to a greater extent than the chosen the ET method does.
4 Conclusions
In semi-arid regions, ET is a large component of the hydro-logic cycle, and a key component of any applied catchment model. In an effort to quantify the potential effect of ET es-timation on a model focused on runoff generation, we evalu-ated four ET methods and compared their performance with observational data. Considering the uncertainties associated with modelling and measuring ET, we conclude: (1) The dif-ferent methods did not reflect observed sums for 2004 and 2005 accurately; nevertheless, deviations remained moder-ate. (2) The quality of the ET simulations varied depend-ing on water availability. Especially durdepend-ing very dry periods, the HG and MK methods showed a high bias, whereas they performed better than the PT and PM methods when peri-ods with mixed wet and dry conditions are considered. (3) The ability to capture day-to-day characteristics of measured data is also dependent on water availability. In general, the simpler HG and MK equations outperform the PM method in the study environment. While ET results differed between methods, effects on the simulated discharge response appears to be minor. We conclude from this observation that while ET is a key component of water cycle in this region, other factors also contribute to the inability of SWAT to capture the measured discharge response. These factors remain to be determined, but may include uncertainties in the spatial distribution of convective precipitation or deep groundwater recharge.
Acknowledgements. This research was conducted within the
project “Matter fluxes in Inner Mongolia as influenced by stocking rate (MAGIM)”, funded by the German Science foundation (DFG) (Research Unit 536, http://www.magim.net).
Edited by: K.-E. Lindenschmidt
Reviewed by: A. Blatter and an anonymous referee
References
Allen, R.G., Pereira, L. S., Raes, D., and Smith, M.: Crop
evapotranspiration-Guidelines for Computing Crop Water Re-quirements, FAO Irrigation and Drainage Paper 56, 300 p., 1998. Arnold, J. G., Srinivasan, R., Muttiah, R. S., and Williams, J. R.: Large area hydrologic modeling and assessment. Part I: Model development, J. Am. Water Resour. Assoc., 34, 73–88, 1998. Beven, K. and Kirkby, M.: A Physically Based, Variable
Contribut-ing Area Model of Basin Hydrology, Hydrol. Sci. Bull. 24(1), 43–69, 1979.
Chen, Z.: Topography and climate of Xilin river basin. Inner Mongolia Ecosystem Research Station, Research on Grassland Ecosystems[3], 13–22, Beijing, Science Press (in Chinese with English abstract), 1988.
De Bruin, H. A. R. and Lablans, W. N.: Reference crop evapotran-spiration determined with a modified Makkink equation, Hydrol. Processes, 12(7), 1053–1062, 1998.
DehghaniSanij, H., Yamamoto, T., and Rasiah, V.: Assessment of evapotranspiration estimation models for use in semi-arid envi-ronments, Agr. Water Manage., 64(2), 91–106, 2004.
Eckhardt, K., Haverkamp, S., Fohrer, N., and Frede, H.G.: SWAT-G, a version of SWAT99.2 modified for application to low moun-tain range catchments, Phys. Chem. Earth, 27(9–10), 641–644, 2002.
42 K. Schneider et al.: Evaluation of evapotranspiration methods
Frank, A. B.: Evapotranspiration from Northern Semiarid Grass-lands, Agron. J., 95(6), 1504–1509, 2003.
Kite, G. W. and Droogers, P.: Comparing evapotranspiration esti-mates from satellites, hydrological models and field data, J. Hy-drol., 229, 3–18, 2000.
Kurc, S. A. and Small, E. E.: Dynamics of evapotranspiration in semiarid grassland and shrubland ecosystems during the sum-mer monsoon season, central New Mexico, Water Resour. Res., 40(9), W0930501–W0930515, 2004.
Liu, X. and Erda, L.: Performance of the Priestley-Taylor equa-tion in the semiarid climate of North China, Agr. Water Manage., 71(1), 1–17, 2005.
L´opez-Urrea, R., Santa Olalla, F., Fabeiro, C., and Moratalla, A.: Testing evapotranspiration equations using lysimeter observa-tions in a semiarid climate, Agr. Water Manage., 85(1–2), 15–26, 2006.
Makkink, G. F.: Testing the Penman formula by means of lysime-ters, J. Inst. Water Eng., 11(3), 277–288, 1957.
Nash, J. E. and Sutcliffe, J. V.: River flow forecasting through con-ceptual models, I, A discussion of principles, J. Hydrol., 10, 282– 290, 1970
Neitsch, S. L., Arnold, J. G., Kiniry, J. R., and Williams, J. R.: Soil and Water Assessment Tool Theoretical Documentation, Ver-sion 2000, Texas Water Resources Institute, College Station, TX, 2001.
Sivapalan, M.: Prediction in ungauged basins: a grand challenge for theoretical hydrology, Hydrol. Processes, 17, 3163–3170, 2003. Vach´e, K. B. and McDonnell, J. J.: A process-based
rejection-ist framework for evaluating catchment runoff model structure, Water Resour. Res., 42, W02409, doi:10.1029/2005WR004247, 2006.
Wigmosta, M. S., Vail, L. W., and Lettenmaier, D. P.: A distributed hydrology-vegetation model for complex terrain, Water Resour. Res., 30, 1665–1679, 1994.
Xiao, X., Wang, Y., Jiang, S., Ojima, D. S., and Bonham, C. D.: Interannual variation in the climate and above-ground biomass of Leymus chinensis steppe and Stipa grandis steppe in the Xilin river basin, Inner Mongolia, China. J. Arid Environ., 31, 283– 299, 1995.