HAL Id: hal-00298905
https://hal.archives-ouvertes.fr/hal-00298905
Submitted on 18 Oct 2007HAL is a multi-disciplinary open access
archive for the deposit and dissemination of sci-entific research documents, whether they are pub-lished or not. The documents may come from teaching and research institutions in France or abroad, or from public or private research centers.
L’archive ouverte pluridisciplinaire HAL, est destinée au dépôt et à la diffusion de documents scientifiques de niveau recherche, publiés ou non, émanant des établissements d’enseignement et de recherche français ou étrangers, des laboratoires publics ou privés.
Vegetation composition and soil microbial community
structural changes along a wetland hydrological gradient
W. K. Balasooriya, K. Denef, Jochen Peters, N. E. C. Verhoest, P. Boeckx
To cite this version:
W. K. Balasooriya, K. Denef, Jochen Peters, N. E. C. Verhoest, P. Boeckx. Vegetation composition and soil microbial community structural changes along a wetland hydrological gradient. Hydrology and Earth System Sciences Discussions, European Geosciences Union, 2007, 4 (5), pp.3869-3907. �hal-00298905�
HESSD
4, 3869–3907, 2007 Microbial community structure along a hydrological gradient W. K. Balasooriya et al. Title Page Abstract Introduction Conclusions References Tables Figures ◭ ◮ ◭ ◮ Back CloseFull Screen / Esc
Printer-friendly Version Interactive Discussion
EGU
Hydrol. Earth Syst. Sci. Discuss., 4, 3869–3907, 2007 www.hydrol-earth-syst-sci-discuss.net/4/3869/2007/ © Author(s) 2007. This work is licensed
under a Creative Commons License.
Hydrology and Earth System Sciences Discussions
Papers published in Hydrology and Earth System Sciences Discussions are under open-access review for the journal Hydrology and Earth System Sciences
Vegetation composition and soil microbial
community structural changes along a
wetland hydrological gradient
W. K. Balasooriya1, K. Denef2, J. Peters1, N. E. C. Verhoest1, and P. Boeckx2
1
Department of Forest and Water Management, Ghent University, Coupure links 653, 9000 Gent, Belgium
2
Department of Applied Analytical and Physical Chemistry, Ghent University, Coupure links 653, 9000 Gent, Belgium
Received: 4 October 2007 – Accepted: 12 October 2007 – Published: 18 October 2007 Correspondence to: W. K. Balasooriya ([email protected])
HESSD
4, 3869–3907, 2007 Microbial community structure along a hydrological gradient W. K. Balasooriya et al. Title Page Abstract Introduction Conclusions References Tables Figures ◭ ◮ ◭ ◮ Back CloseFull Screen / Esc
Printer-friendly Version Interactive Discussion
EGU
Abstract
Fluctuations in wetland hydrology create an interplay between aerobic and anaerobic conditions, controlling vegetation composition and microbial community structure and activity in wetland soils. In this study, we investigated the vegetation composition and microbial community structural and functional changes along a wetland hydrological
5
gradient. Two different vegetation communities were distinguished along the hydrolog-ical gradient; Caricetum gracilis at the wet depression and Arrhenatherum elatioris at the drier upper site. Microbial community structural changes were studied by a com-bined in situ 13CO2 pulse labeling and phospholipid fatty acid (PLFA) based stable
isotope probing approach, which identifies the microbial groups actively involved in
as-10
similation of newly photosynthesized, root-derived C in the rhizosphere soils. Gram negative bacterial communities were relatively more abundant in the surface soils of the drier upper site than in the surface soils of the wetter lower site, while the lower site and the deeper soil layers were relatively more inhabited by gram positive bacte-rial communities. Despite their large abundance, the metabolically active proportion of
15
gram positive bacterial and actinomycetes communities was much smaller at both sites, compared to that of the gram negative bacterial and fungal communities. This suggests much slower assimilation of root-derived C by gram positive and actinomycetes com-munities than by gram negative bacteria and fungi at both sites. Ground water depth showed a significant effect on the relative abundance of several microbial
communi-20
ties. Relative abundance of gram negative bacteria was significantly decreased with increasing ground water depth while the relative abundance of gram positive bacteria and actinomycetes at the surface layer increased with increasing ground water depth.
1 Introduction
Wetland ecosystems are characterized by hydric soils which support hydrophilic
veg-25
HESSD
4, 3869–3907, 2007 Microbial community structure along a hydrological gradient W. K. Balasooriya et al. Title Page Abstract Introduction Conclusions References Tables Figures ◭ ◮ ◭ ◮ Back CloseFull Screen / Esc
Printer-friendly Version Interactive Discussion
EGU
availability of oxygen, resulting in the interplay between aerobic and anaerobic pro-cesses of key biogeochemical cycles, such as nitrification, denitrification and methano-genesis (Davidsson et al., 1997). These wetland biogeochemical cycling processes are mostly microbially mediated. While wetland microbiology is receiving increasing research attention, it still remains under investigated. Wetland biogeochemistry
re-5
search has mainly focused on (i) biogeochemical studies of processes, and, although less thoroughly studied, (ii) microbial ecological studies of populations and community structure (Gutknecht et al.,2006).
Hydrology is a dominant factor controlling microbial processes in wetlands (Bardgett
and Shine, 1999; Gutknecht et al., 2006; Mentzer et al., 2006). Higher water levels
10
increase the rate of anaerobic processes, such as denitrification (Smith and Tiedje,
1997), methanogenesis (Coles and Yavitt ,2004), and sulfate reduction (Devito and
Hill , 1999), and decrease rates of aerobic processes, such as nitrification (Qiu and
McComb, 1996) by creating low oxygen and anaerobic soil micro sites. In addition, temporal fluctuations of soil moisture from drying/wetting cycles stimulate denitrification
15
in wet cycles and nitrification in dry cycles (Qiu and McComb,1996;Venterink et al.,
2002).
Additionally, hydrology affects vegetation composition since wetland plant species occurrence has been shown to be highly responsive to fluctuations in water level
(Leyer,2005;Van der Hoek and Sykora,2006) and hydroperiod (Battaglia and Collins,
20
2006; Peters et al., 20071). Plants can influence microbial functions directly by provid-ing resources in litter (Bardgett and Shine, 1999), with variations among plant types or species depending on their nutrient content (Hume et al., 2002). Indirectly, plants affect microbial processes through their rhizosphere characteristics. The rhizosphere receives readily decomposable labile resources from plant roots (Kennedy,2005) and
25
increase oxygen levels relative to the surrounding wetland soil (Colmer,2003). 1
Peters, J., Verhoest, N., Boeckx, P., Balasooriya, W. K., and Samson, R.: An ecohydrologi-cal study of an alluvial floodplain in Belgium: monitoring and spatio-temporal analysis, Belgian Journal of Botany, submitted, 2007.
HESSD
4, 3869–3907, 2007 Microbial community structure along a hydrological gradient W. K. Balasooriya et al. Title Page Abstract Introduction Conclusions References Tables Figures ◭ ◮ ◭ ◮ Back CloseFull Screen / Esc
Printer-friendly Version Interactive Discussion
EGU
While bacterial communities generally dominate the wetland soil microbial commu-nity (Boon et al., 1996), mycorrhizal fungi adapted to wetland conditions also occur
(Anupam,2003). Wetland hydrology may affect the general microbial community
struc-ture (Sundh et al.,1997;Mentzer et al.,2006), or specific organisms, such as mycor-rhizal fungi (Wetzel and VanderValk, 1996). Wetland microbial community structure
5
has also been shown to vary among plant species rhizospheres (Halbritter and
Mogy-orossy,2002) and with plant community composition (Borga et al.,1994;Sundh et al.,
1997;Ingham and Wilson,1999).
Different biochemical and microbiological techniques have been used to describe the general structure of soil and aquatic microbial communities. In situ characterization of
10
microbial community composition is commonly done through in situ analysis of specific components (biomarkers), which are only produced by and therefore characteristic for specific microbial groups. For example, the analysis of phospholipid fatty acids (PLFA) is based on the analysis of a group of cell membrane lipids, several of which can be used as biomarkers for specific microbial communities (Vestal and White,1989;Zelles,
15
1997). The polar group of phospholipids is rapidly hydrolyzed upon microbial cell death, hence the fatty acids in intact phospholipids are assumed to originate from living mi-cro organisms (White et al.,1979;Zelles,1997). In wetland studies, PLFA analysis has shown microbial community compositional changes across different wetlands (Borga et
al.,1994;Boon et al.,1996;Sundh et al.,1997) as a result of differences in
hydrologi-20
cal fluctuations (Sundh et al.,1997;Mentzer et al.,2006). Although most PLFA studies have provided valuable information regarding the structure of the microbial commu-nity (Frostegard et al.,1993;Bossio et al.,1998;Steer and Harris,2000;Fierer et al.,
2003;Drissner et al.,2007), they usually do not reveal any information regarding the
function of microbial communities associated with C cycling. Technological
develop-25
ments in mass-spectrometry in the last decades have made it possible to integrate stable isotope analysis into biomarker analysis (Boschker and Middleburg,2002). The combination of13C stable isotope and PLFA analysis through Gas Chromatography-Combustion-Isotope Ratio Mass Spectrometry (GC-C-IRMS) has made it possible to
HESSD
4, 3869–3907, 2007 Microbial community structure along a hydrological gradient W. K. Balasooriya et al. Title Page Abstract Introduction Conclusions References Tables Figures ◭ ◮ ◭ ◮ Back CloseFull Screen / Esc
Printer-friendly Version Interactive Discussion
EGU
trace the flow of C from a13C-labeled substrate into the PLFA fraction of the microbial communities (Boschker et al.,1998), and to identify the microbial communities actively assimilating the labeled substrate-derived C. This combined approach is unique as it allows to assess the specifically “active” proportion of the microbial community and to link biogeochemical processes with microbial identity. Stable isotope probing (SIP) of
5
PLFA has been successfully attained through laboratory incubations with13C enriched substrate additions (Waldrop and Firestone,2004), in situ enriched substrate additions
(Williams et al.,2006), as well as in situ 13CO2 pulse labeling of growing plants (
Tre-onis et al., 2004;Prosser et al., 2006; Denef et al.,2007;Lu et al.,2007). By using in situ PLFA-based SIP analysis, several studies have demonstrated a dominant
con-10
tribution of fungi in the immediate assimilation of rhizosphere-derived C in grasslands (Butler et al.,2003;Treonis et al.,2004;Olsson and Johnson,2005;Denef et al.,2007). In this study, PLFA-based SIP was performed through an in situ stable isotope13CO2
pulse labeling approach in a natural wetland ecosystem to examine the incorporation of rhizodeposition into individual PLFAs across a spatial and temporal hydrological
gradi-15
ent. The main objective of this study was to examine if a wetland hydrological gradient and consequent vegetation composition distributions are linked to microbial community structural differences.
2 Description of the study site
The study was conducted along a topographical transect in the Northern part of the
20
wetland nature reserve Ossemeersen, Ghent, Belgium. The Bourgoyen-Ossemeersen is an alluvial complex characterized by floodplains of the river Leie. Higher levees are found next to the river with well drained sandy to silty textured soil types while floodplain depressions in the hinterland have clay soils with gleyic proper-ties. The management of the Bourgoyen-Ossemeersen aims at increasing the
botan-25
ical and ornithological value of the nature reserve area. During winter (November-March), a floodgate is closed and the gravitational drainage of the area is blocked up
HESSD
4, 3869–3907, 2007 Microbial community structure along a hydrological gradient W. K. Balasooriya et al. Title Page Abstract Introduction Conclusions References Tables Figures ◭ ◮ ◭ ◮ Back CloseFull Screen / Esc
Printer-friendly Version Interactive Discussion
EGU
to a height of 5.67 m a.s.l. The rate of ground water depth rising is dependent on the precipitation during this period. From the first of March on, gravitational drainage is allowed to a height of 5.27 m a.s.l., but evapotranspiration losses might further lower the actual ground water depth. The vegetation of Bourgoyen-Ossemeersen consists of several grassland associations. Areas with high productivity are mown twice a year
5
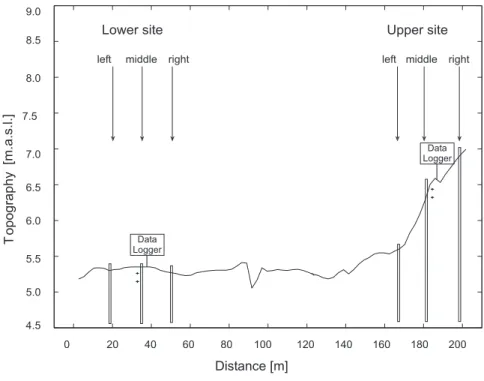
(June and September), whereas areas with lower productivity are mown once a year. Some other parcels are seasonally grazed. Along the transect, an upper site on the levee and a lower site in the depression, each approximately 15 m long, were selected. Each of the two sites was subdivided in a left, middle and right sampling point (Fig.1). The elevation ranges from 5.3 m a.s.l. at the lower site to 7 m a.s.l. at the upper site
10
(Peters et al.,2006). Soil texture at the different sites could be summarized as: (i) clay
soils at the lower site; (ii) a sandy loam soil texture at the upper left sampling point, and (iii) sandy soils at the upper middle and upper right sampling points.
3 Methods
3.1 Monitoring of the eco-hydrological site conditions
15
3.1.1 Hydrological data
At each sampling point (left, middle and right) of the lower and the upper site, soil wa-ter content reflectomewa-ters (CS616, Campbell Scientific Ltd.) were installed at 10 and 30 cm depths for measuring the volumetric water content (VWC) of the soil [cm3cm−3]. In addition piezometers were installed and equipped with divers (TD Diver, Van Essen
20
Instruments) to measure ground water depths relative to the soil surface. Details on the field position of the devices can be seen in Fig.1. Hourly data recorded during a sampling period of two years (from 21 June 2005 until 21 June 2007) was extracted for this study. Additional information on precipitation was gathered from the nearby weather station Vinderhoute (4 km from the study area), managed by the Flemish
HESSD
4, 3869–3907, 2007 Microbial community structure along a hydrological gradient W. K. Balasooriya et al. Title Page Abstract Introduction Conclusions References Tables Figures ◭ ◮ ◭ ◮ Back CloseFull Screen / Esc
Printer-friendly Version Interactive Discussion
EGU
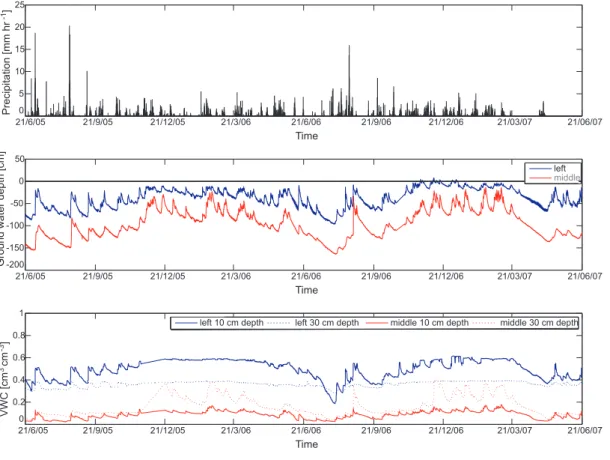
vironmental agency VMM (hydronet databankhttp://www.hydronet.be). Time series of precipitation, ground water depth and soil water content are given in Figs.2and3. 3.1.2 Vegetation data
Vegetation at the lower and the upper sites have been monitored on both floristic com-position and vegetation structural variables. Floristic data were gathered by installing
5
six permanent quadrats of 2 m by 2 m at both sites (12 quadrats in total), located near the three sampling points. In August 2006, the species composition within these quadrats was described, and the abundance of recorded species was estimated using the decimal Londo scale (Londo, 1976). The vegetation structure was described by means of two variables: living above ground biomass [gm−2], and leaf area [m2m−2],
10
which is the quotient of the total one-sided green leaf area and the ground area. There-fore monthly samples were taken by harvesting six randomly distributed 30 cm by 30 cm patches on the lower and upper site. Dead and living plant materials of the vegetation samples were separated prior to the determination of the leaf area using a LI-3100 leaf area meter (LI-COR Biosciences). Finally, the plant material was oven dried (48 h,
15
70◦C and weighted to determine the above ground biomass. 3.2 Assessment of microbial community structure and function 3.2.1 Experimental13CO2pulse labeling
In April and June 2007, 13CO2 pulse labeling events were conducted. In April, pulse
labeling was performed on three replicate plots at the lower site whereas in June, this
20
was done on three replicate plots at both the lower and upper site on two consecutive days. For each pulse labeling event, 500 ml of13C labeled (99 atom %) CO2was
sup-plied to photosynthesizing plants inside a plexi glass chamber (30×30×30 cm) over a period of 6 daylight hours. Each injection was done when CO2levels inside the cham-bers were below 250 ppm. Three replicate chamcham-bers, placed 2 m apart were placed on
HESSD
4, 3869–3907, 2007 Microbial community structure along a hydrological gradient W. K. Balasooriya et al. Title Page Abstract Introduction Conclusions References Tables Figures ◭ ◮ ◭ ◮ Back CloseFull Screen / Esc
Printer-friendly Version Interactive Discussion
EGU
top of stainless-steel frames firmly inserted in the soil to a depth of about 10 cm. CO2 concentrations were monitered (EGM-4, PP systems) within the chambers during the 6 hour pulse labeling to follow the uptake of13CO2 by photosynthesizing plants. The
next day, chambers were removed approximately 24 hours after the first labeled CO2 injection, when all respired13CO2was completely taken up by plant photosynthesis.
5
3.2.2 Sampling andδ13C determinations in solid samples
From each pulse labeled square within a site (n=3), soil samples at 0–10 cm and 10–20 cm depth and shoot samples were taken after 24 h, immediately following the removal of the chambers. In addition, composite samples of soil and shoots were taken prior to labeling as controls. All samples were immediately stored on ice and transported
10
to the laboratory where soil samples were frozen (−20◦C). Later, soil samples were thawed and wet sieved through a 250µm sieve to remove all visible roots, macro fauna and fresh litter since plants contain large concentrations of the fungal biomarker PLFA “linoleic acid” (18:2ω6,9c) (Zelles,1997). Direct dry sieving was not practicable due to high density of root mats and clayey texture in the samples from the lower site. The
15
soil solution from wet sieving was centrifuged at 2500 rpm for 10 min and the pellet was immediately frozen (−20◦C) to recover the soil fraction. To obtain a dry sample for PLFA analysis, these frozen soil pellets were freeze dried. Dry sieving was done as the last step (50µm) in order to exclude any fine root hairs. Shoot samples and separated root fractions were oven dried (24 h at 60◦C) and then ground to a fine homogeneous
20
powder using an ultra centrifugal mill (ZM200, Retsch Germany). A subsample of ground shoot and root samples and soil samples were analysed for C, N and 13C content using an Elemental Analyser (EA) (ANCA-SL, Europa PDZ, UK) coupled to an Isotope Ratio Mass Spectrometer (IRMS) (20–20, Sercon, UK) (EA-IRMS). Isotope ratios were calculated as below (Dawson et al.,2002), and reported in terms ofδ13C
HESSD
4, 3869–3907, 2007 Microbial community structure along a hydrological gradient W. K. Balasooriya et al. Title Page Abstract Introduction Conclusions References Tables Figures ◭ ◮ ◭ ◮ Back CloseFull Screen / Esc
Printer-friendly Version Interactive Discussion
EGU
‰ (per mil) values.
δ13C = Rsample− Rreference
Rreference
× 103 (1)
where Rsample is the 13
C/12C ratio of sample and Rreference is the 13
C/12C ratio of Vienna-Pee Dee Belemnite (V-PDB) reference standard from the IAEA. Finally the13C enrichment (∆δ13C ‰) of shoot, root and soil samples was calculated by subtracting
5
the pre-labeling natural abundanceδ13C values from the post-labeling δ13C values of solid samples.
3.2.3 PLFA extraction and quantification
The extraction, quantification and compound specificδ13C analysis of PLFAs was per-formed following the method described byDenef et al. (2007). Total lipids were
ex-10
tracted from 6 g of soil using phosphate buffer/chloroform/methanol at a 0.9:1:2 ratio. Total lipids retrieved in the chloroform phase were partitioned on silica gel columns. Neutral and glycolipids were eluted from these columns with chloroform and acetone and discarded. Polar lipids were eluted with methanol, which were collected and trans-esterified (using methanolic KOH) to form volatilizable fatty acid methyl esters (FAMEs).
15
FAMEs were analysed by capillary gas chromatography combustion-isotope ratio mass spectrometry (GC-C-IRMS) (GC-C/DeltaPLUS XP Thermo Scientific) via a GC/C III in-terface. The gas chromatograph (splitless mode; He carrier gas) was equipped with a Chrompack CP-SIL88 column (100 m×0.25 mm i.d. ×0.2 mm, Varian Inc.). The oven temperature was programmed at 75◦C for 2 min., followed by a ramp at 5◦C min−1 to
20
180◦C with a 20 min. hold, and a final ramp at 2◦C min−1 to 225◦C with a 20 min. hold.
Individual fatty acids were identified based on relative retention times compared to two internal standards (12:0 and 19:0) which were added to the FAME extract prior to gas chromatography and cross referenced with several standards: a mixture of 37 FAMEs (37 component FAME mix, no. 47885, Supelco Inc.), a mixture of 24 bacterial FAMEs
HESSD
4, 3869–3907, 2007 Microbial community structure along a hydrological gradient W. K. Balasooriya et al. Title Page Abstract Introduction Conclusions References Tables Figures ◭ ◮ ◭ ◮ Back CloseFull Screen / Esc
Printer-friendly Version Interactive Discussion
EGU
(BAME mix, no. 47080, Supelco Inc.) and several individual FAMEs (Supelco Inc. and Larodan Inc.).
On average, 25 PLFA peaks were detected and quantified, but only 14 were in-vestigated in this study depending on their use as biomarker fatty acids for different microbial communities (Zelles, 1997). Fatty acid nomenclature consists of the total
5
number of C atoms, a colon, and the number of double bonds. Then an “ω” and a number showing the position of the double bond in the chain, sometimes followed by a “c” or “t” for cis or trans configuration respectively. The prefixes “i”, “a” and “10Me” refer to methyl branching at the iso and anteiso positions and the carboxyl group from the 10th carbon respectively. Cyclopropane fatty acids have the prefix “cy” (Sundh et
10
al.,1997). The 14 biomarker PLFAs analysed within this data set included: 18:1ω9c and 18:2ω6,9c (indicative of saprotrophic fungi), 16:1ω5c (indicative of arbuscular my-corrhizal fungi (AMF)), i14:0, i15:0, i16:0, i17:0 and a17:0 (indicative of gram positive bacteria), cy17:0, 16:1ω7c and 18:1ω7c (indicative of gram negative bacteria) and 10Me16:0 and 10Me18:0 (indicative of actinomycetes) (Denef et al.,2007). In most
15
GC chromatograms, a17:0 and 16:1ω7c peaks overlapped, leading to an identification based on the relative abundance of other biomarker fatty acids in the sample. Chro-matographic peak area ratios of each individual PLFA to that of 16:0, a universal PLFA occurring in the membranes of all organisms, were determined. Peak area ratios less than 0.02 were excluded from the data set (Drijber et al.,2000). Based on regressions
20
between peak area and PLFA concentration of a dilution series of the quantitative “37 component FAME mix”, the C concentrations [nmol g−1soil] of the individual biomarker PLFAs in the soil samples were quantified (Denef et al.,2007). Relative proportions of the individual PLFA-C ([PLFA − C]i) to total PLFA-C of the sample (MCi) were
calcu-lated and expressed as PLFA-C mol% as an indicator of relative abundance of microbial
25 communities. MCi = [PLFA − C]i P [PLFA − C]i × 100 (2)
HESSD
4, 3869–3907, 2007 Microbial community structure along a hydrological gradient W. K. Balasooriya et al. Title Page Abstract Introduction Conclusions References Tables Figures ◭ ◮ ◭ ◮ Back CloseFull Screen / Esc
Printer-friendly Version Interactive Discussion
EGU
3.2.4 Compound-specific13C analysis
In order to calculate δ13C value in each PLFA, the δ13C values of FAMEs obtained from GC-C-IRMS were corrected for the addition of the methyl group during transes-terification.
δ13C
PLFA=
[NPLFA+ 1]δ13CFAME− δ13CMeOH
NPLFA (3)
5
where NPLFA is the number of C atoms of the PLFA component, CFAME is the δ13C value of the FAME and CMeOHis theδ
13
C value of methanol determined by EA-IRMS (−36.7%, n=5).
The13C enrichment or net labeling of PLFAs (∆δ13C ‰) was calculated by subtract-ing the pre-labelsubtract-ing natural abundance PLFAδ13C values from the post-labeling PLFA
10
δ13C values. The proportion of root-derived PLFA-C was calculated for each individual PLFA through the following equation (Williams et al.,2006):
FCi =
δl i− δui
δr− δui × MCi
(4)
where FCi is the relative fraction of C in each PLFA derived from the 13C-labeled roots, MCi is the relative mol % of PLFA-C in each PLFA to the total PLFA-C in the sample.
15
δl i represents the δ13C of the PLFA-C in the post-labeled sample, δui represents the δ13C of the PLFA-C in the pre-labeled sample, andδr represents theδ13C of the post-labeled roots. The relative proportion of root-derived PLFA-C (PFi) was then calculated for each individual PLFA using the following equation (Williams et al.,2006):
PFi = MCi/
X
FCi × 100 (5)
HESSD
4, 3869–3907, 2007 Microbial community structure along a hydrological gradient W. K. Balasooriya et al. Title Page Abstract Introduction Conclusions References Tables Figures ◭ ◮ ◭ ◮ Back CloseFull Screen / Esc
Printer-friendly Version Interactive Discussion
EGU
4 Results and discussion
4.1 Spatio-temporal changes of eco-hydrological variables 4.1.1 Ground water depth
A clear gradient in ground water depths can be observed along the studied transect. Temporal averages range from 4.6 cm and 15.5 cm below surface at the lower middle
5
and left monitoring points respectively, to 37.9 cm and 94.7 cm below surface at the left and middle monitoring points of the upper site. Ground water depths showed an an-nual pattern, with a deeper ground water table during summer and a more superficial ground water table during winter. Although this pattern was observed at all measure-ment points, inundation only occurs at the lower site with average flood durations of
10
three to five months during winter and spring. Beside the annual ground water fluctu-ations, a daily fluctuation can be observed at the lower site during dry periods. These fluctuations can be a result of ground water consumption through transpiration activi-ties of phreatophytic plant species, similar to what was reported in many other studies
(White,1932;Engel et al.,2005;Schilling,2007). During daytime, when plants are
ac-15
tively photosynthesizing, water consumption causes a drop down of the ground water table which is (partially) replenished during night. At the upper site, this phenomena is absent (upper middle) or less pronounced in amplitude (upper left) (Peters et al., 20071).
The cross-correlation function was calculated to inspect the relationship between
20
hourly precipitation [mm h−1] and the change in ground water depth [cm h−1] for dif-ferent time lags [h] after the rainfall event (Table1). Maximal cross-correlation values were found one or two hours after rainfall, since higher infiltration rates at the upper site compensate for the higher distance to the ground water table. The highest cross-correlation value was calculated at the upper left monitoring point and results from the
25
high permeability of the soil, the relative superficial ground water table and the lack of inundation. At the lower site, notwithstanding a shallow mean ground water depth,
HESSD
4, 3869–3907, 2007 Microbial community structure along a hydrological gradient W. K. Balasooriya et al. Title Page Abstract Introduction Conclusions References Tables Figures ◭ ◮ ◭ ◮ Back CloseFull Screen / Esc
Printer-friendly Version Interactive Discussion
EGU
cross-correlation values were found to be lower, which may be attributed to the win-ter inundations. During inundations, cross-correlations are low (0.13) due to saturated conditions compared to cross-correlation value during summer (0.49). At the upper middle monitoring point, cross-correlation is lowest, indicating the less pronounced re-sponse of the ground water table to a rainfall event. Because of the greater depth of
5
the ground water table, a relatively large proportion of the precipitation water never reaches the ground water table as it is stored in the soil volume above.
4.1.2 Soil water content
At the lower site the volumetric water contents of the soil layers increases with increas-ing depth (Fig.2). At 30 cm depth, a year round soil saturation results in a constant
10
volumetric water content of around 0.8 cm3cm−3. At 10 cm depth, saturation is only interrupt during summer, but even then values are very high (in the range of 0.5– 0.7 cm3cm−3). These high values result from the high amount of organic C in the top soil (Table3). The time series of volumetric water contents at the upper middle and left point differ considerably. At the upper middle sampling point, volumetric water content
15
increases with depth, and fluctuations are noticed in both. The upper left site, however, is characterized by a higher water content at 10 cm depth, and saturated soil water conditions at 30 cm depth.
The relation between precipitation and volumetric water content at different depths was evaluated using the cross-correlations function. At a depth of 10 cm high
correla-20
tions were found immediately after the rainfall event. At the upper site, correlations are twice as high as at the lower site due to the lack of winter inundation. A response of soil water content at a depth of 30 cm to precipitation is only present at the upper site. 4.1.3 Vegetation
Based on species occurrence and abundance data, two different vegetation
associa-25
Carice-HESSD
4, 3869–3907, 2007 Microbial community structure along a hydrological gradient W. K. Balasooriya et al. Title Page Abstract Introduction Conclusions References Tables Figures ◭ ◮ ◭ ◮ Back CloseFull Screen / Esc
Printer-friendly Version Interactive Discussion
EGU
tum gracilis Almquist 1929 at the lower site and Arrhenatherum elatioris (L.)J.&C.Presl. at the upper site. Caricetum gracilis Almquist 1929 (Schamin ´ee et al.,1995) is a Carex acuta L. dominated vegetation type with Ranunculus flammula L. and Galium palus-tre L. Arrhenatheretum elatioris Braun 1915 (Schamin ´ee et al., 1996) is a grassland association with Arrhenatherum elatioris (L.)J.&C.Presl., Festuca rubra L., Plantago
5
lanceolata L. and Ranunculus repens L. Ellenberg moisture figures (Ellenberg et al.,
1992) indicate a clear gradient from species occurring at intermediately moist habitats at the upper site toward species occurring on hydric soils in the depression (Fig.4).
Vegetation structure was described during the year 2006 by means of above ground living biomass [gm−2] and leaf area [m2m−2] (Table 2). Vegetation development
10
started from zero at the lower site, and biomass and leaf area values did not increase very much during the period January–April. From May until July, a rapid increase in biomass (from 184.4 gm−2 until 746.3 gm−2) and leaf area (from 2.23 m2m−2 until 8.27 m2m−2) was measured, which was leveled off during August. In September, lower
values were measured due to natural senescence. This was followed by a mowing
15
event which drastically decreased above ground biomass (−426.2 gm−2) and leaf area (−3.26 m2m−2). A short regrowth period during November increased values slightly.
The observed vegetation development differed quite a lot between the lower and the upper site. During winter, an above ground living biomass of ≈115 gm−2 was mea-sured, which decreased in March and April. As seen at the lower site, a fast increase
20
in biomass and leaf area was measured during May and June, with maximal values of 469.7 gm−2and 3.9 m2m−2, respectively. A mowing event at the end of June drastically decreased biomass (−433 gm−2) and leaf area (−2.7 m2m−2). Vegetation recovery was
fast, and a second growing period after the mowing event resulted in biomass and leaf area values as high as 229.8 gm−2and 3.3 m2m−2, respectively.
HESSD
4, 3869–3907, 2007 Microbial community structure along a hydrological gradient W. K. Balasooriya et al. Title Page Abstract Introduction Conclusions References Tables Figures ◭ ◮ ◭ ◮ Back CloseFull Screen / Esc
Printer-friendly Version Interactive Discussion
EGU
4.2 microbial community structure and function 4.2.1 δ13C enrichment of shoot, root and soil C
All 3 pulse labeling events in the lower and the upper sites resulted an increasedδ13C signature of the shoot and root biomass (Table3). Comparatively lowerδ13C signa-tures (i.e. more negative or less positive) were observed in soil C, especially at the
5
lower site, reflecting a small but significant incorporation of new plant photosynthate-C into the soil matrix. The larger background soil C at the lower the site more clayey (Table3) possibly diluted the incomingδ13C from plants and may explain the observed lower 13C enrichment of the soil C of the lower site compared to that of the upper site (Table 3). The data was presented as δ13C enrichment (∆δ13C ‰) relative to
pre-10
pulse labeling (control) samples to correct for initialδ13C differences between sites at each labeling event. Shoot biomass showed the highestδ13C enrichment, followed by root biomass and soil organic C. Enrichment of soil and root biomass was generally greater at the upper site compared to the lower site after the pulse labeling in June. Within the lower site, June labeling resulted in lesserδ13C enrichment of root biomass
15
and soil C at 0–10 cm depth, than that in April. These differences were expected to be indicative of differences in microbial performance between sites and time periods, how-ever, could be shadowed by differences in solar radiation and other climatic conditions prevailing during the different labeling events that control plant photosynthetic CO2
up-take and consequently the rhizodeposit-C transport in the rhizosphere soil. Therefore,
20
δ13C-PLFA comparisons were performed after expressing the data as proportions of derived PLFA-C of each individual fatty acid to that of the total rhizosphere-derived PLFA-C (PFi).
4.2.2 Spatio-temporal patterns of microbial community structure
Spatio-temporal patterns of PLFA profiles in the lower and upper sites are illustrated
25
HESSD
4, 3869–3907, 2007 Microbial community structure along a hydrological gradient W. K. Balasooriya et al. Title Page Abstract Introduction Conclusions References Tables Figures ◭ ◮ ◭ ◮ Back CloseFull Screen / Esc
Printer-friendly Version Interactive Discussion
EGU
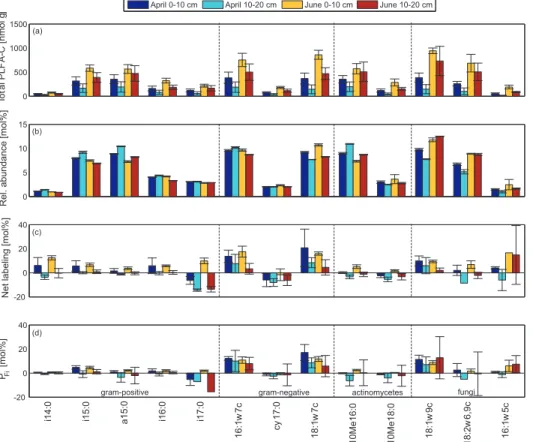
were done by ANOVA, the concentration of individual PLFAs ([PLFA-C], nmol C g−1 soil), representing the abundance of the different microbial cell membrane biomarker lipids, was significantly higher (p<0.05) in the lower site than in the upper site through-out the soil profile (0–20˙cm) (Fig. 6a), indicating higher microbial abundance at the lower site. A general decline of [PLFA-C] occurred with depth at both sites showing
5
decreasing microbial abundance with depth. A significantly greater [PLFA-C] of most of the individual PLFAs occurred in June compared to April at the lower site (Fig.5a) at both depths indicating greater microbial abundance in June than April (except for i14:0, a15:0, 16:1ω7c and 10Me16:0 at 10–20 cm depth).
The relative abundance of individual PLFAs (MCi%) represent the relative
propor-10
tions of the individual PLFA-C ([PLFA − C]i) to total PLFA-C abundance (Fig. 5b and
Fig.6b). Gram positive bacteria associated fatty acids were relatively more abundant (higher MCi%) in the wetter lower site and in the subsurface soils of the drier upper site than in the upper surface horizon. Among all gram positive PLFAs, this pattern was significant (p<0.05) for i15:0, i16:0 and i17:0. A general decline of gram positive
15
PLFAs was found with increasing soil depth, with a significant decline found in April for most of the gram positive PLFAs (i15:0, a15:0, i16:0, i14:0) (p<0.05). The observed higher abundance of gram positive fatty acids in April (significant at 10–20 cm depth p < 0.05) compared to that in June in the lower site further confirms the association of this set of fatty acids with anaerobic conditions which were prevalent in April than in
20
June, as well as in deeper soil depths and in the lower compared to the upper site. The relative abundance of gram negative PLFAs was greater in the surface layer of the upper site than in that of the lower site (Fig.5b and Fig.6b). In the lower site, greater gram negative relative abundance occurred in the surface samples of June than in the surface samples of April. Among all gram negative bacterial PLFAs, 18:1ω7c was
25
significantly more relatively abundant in the upper site than in the lower site (p<0.01) and cy17:0 and 18:1ω7c showed a significant decline in relative abundance with depth at both sites (p<0.05).
HESSD
4, 3869–3907, 2007 Microbial community structure along a hydrological gradient W. K. Balasooriya et al. Title Page Abstract Introduction Conclusions References Tables Figures ◭ ◮ ◭ ◮ Back CloseFull Screen / Esc
Printer-friendly Version Interactive Discussion
EGU
at the lower site than in the upper site and generally increased with depth (Fig.5b and Fig.6b). The relative abundance of arbuscular mycorrhizal fungal PLFA (16:1ω5c) was significantly greater (p<0.05) in the upper site than in the lower site, while saprotrophic fungi associated PLFAs; 18:1ω9c and 18:2ω6,9c were significantly higher (p<0.05) at the lower site. Fungal PLFAs were relatively high in the surface horizon compared
5
to the subsurface layers. This decline with depth was significant for 18:1ω9c and 18:2ω6,9c fungal PLFAs in April at the lower site (p<0.05) and for AMF (16:1ω5c) in June at the upper site (p<0.05). However, the relative abundance of fungal PLFA 18:1ω9c was higher at the subsurface layer than at the surface layer in June at the lower site. Relative abundance of fungal PLFAs were generally higher in June
com-10
pared to that in April at lower site, while 18:1ω9c and 18:2ω6,9c fungal PLFAs in the surface layer were significantly relatively higher in June compared to that in April (Fig.5b and Fig.6b).
Several other studies reported significant changes of soil microbial communities with depth or in response to land-use, management or environmental change based on
15
PLFA analysis (Sundh et al., 1997; Fierer et al., 2003; Bossio et al., 2006). Similar patterns of relatively more abundant gram positive bacterial PLFAs in wetlands with prevailing anaerobic conditions as compared to more aerated agricultural fields, and decreased relative abundance of gram negative bacterial PLFAs with soil depth in both wetland and agricultural land uses were reported byBossio et al.(2006). In addition,
20
Bossio et al. (2006) suggested a higher growth rate of aerobic bacteria dominated
communities compared to anaerobic bacteria dominated communities, based on PLFA indices. This study concluded that the aeration condition was the predominant deter-minant of abundances of the microbial communities across soil types and land usage.
Sundh et al. (1997) found increasing gram positive bacteria and actinomycetes with
25
depth (based on total PLFA concentrations), in dry sites of peatlands, and suggested that these shifts could be due to anaerobic conditions imposed by ground water depth. Other studies have detected relatively large actinomycetes populations in sub surface soils influenced by anaerobic conditions (Federle et al., 1986) and in podzol profiles
HESSD
4, 3869–3907, 2007 Microbial community structure along a hydrological gradient W. K. Balasooriya et al. Title Page Abstract Introduction Conclusions References Tables Figures ◭ ◮ ◭ ◮ Back CloseFull Screen / Esc
Printer-friendly Version Interactive Discussion
EGU
under coniferous forest (Fritze et al.,2000). In this study, anaerobic conditions were expected in the lower site due to a year round shallow ground water depth compared to the upper site, where average ground water depth is below 30 cm (Figs.2and3). Gram positive bacteria are known to have a strong association with anaerobic conditions
(Sundh et al.,1997) prevailing in wetlands and with increasing soil depth, while gram
5
negative bacteria are known to associate with well aerated conditions (Ponder and
Tadros,2002). Therefore, the observed shift from greater gram negative dominance at the well aerated soil surface in the upper site to greater gram positive dominance in the lower site and deeper depth, is consistent with the prevailing anaerobic conditions in the lower site and with increasing depth. Similar to our findings,Fierer et al.(2003)
10
reported that gram positive bacteria as well as actinomycetes tended to increase in relative abundance with increasing soil depth, while that of gram negative bacteria and fungi were higher at the soil surface compared to that in the lower surface in two semi arid soil profiles. They concluded that the vertical distribution of these microbial groups can largely be attributed to the decline in carbon availability with soil depth.Griffiths et
15
al. (1999) have shown that higher rates of C addition to soil will raise the proportions of fungi and gram negative bacteria in the microbial community and lower the proportions of actinomycetes and gram positive bacteria. In this study, greater biomass turnover occurred at the lower site than in the upper site (Table2) indicating a higher C addition. Fungal PLFAs (18:1ω9c and 18:2ω6,9c) were higher at the lower site following the C
20
availability. However, gram negative bacteria and AMF shifts were opposite than the predictions based on C availability, i.e. gram negative bacteria and AMF was higher at the surface layers of the upper site compared to that in the lower site. At the lower site, the aboveground plant biomass production was higher in June than in April, result-ing in a temporal shift in the relative abundance of fungal PLFAs, i.e. greater relative
25
abundance of fungal PLFAs in June than in April reflecting the greater C availability in June.
The advantage of the pulse labeling approach in combination with13C PLFA analysis is the identification of those microbial communities that are actively assimilating newly
HESSD
4, 3869–3907, 2007 Microbial community structure along a hydrological gradient W. K. Balasooriya et al. Title Page Abstract Introduction Conclusions References Tables Figures ◭ ◮ ◭ ◮ Back CloseFull Screen / Esc
Printer-friendly Version Interactive Discussion
EGU
produced rhizosphere-C. The two13C-PLFA based indices used in this study, i.e. net labeling (∆δ13C‰) and PFi, distinguish the PLFAs associated with the metabolically-active proportion of the microbial communities from the PLFAs associated with the in-active or slow in-active proportion of the microbial communities with regard to rhizosphere C cycling (Denef et al.,2007). Net labeling was significantly higher in the surface layers
5
of the upper site than that in the lower site (p<0.05) in most of the individual PLFAs except for i14:0 and cy17:0 (Fig. 5c and Fig. 6c). A general decline of net labeling occurred with depth. In June, net labeling was generally higher than in April at the surface layers of the lower site, except for i16:0, 18:1ω7c and 18:1ω9c. These differ-ences could be due to differdiffer-ences in microbial functioning between sites, depths and
10
time periods, however, could be shadowed by differences in photosynthetic efficiency resulting in differences in13C input to the soil.
The relative abundance of root derived PLFA-C (PFi), which corrects for any differ-ences in photosynthetic efficiency and was used as a measure for the active root-C assimilating portion of the microbial community structure, was generally greater at the
15
surface layers compared to that in the subsurface at both sites except for 10Me16:0, 10Me18:0, and 18:1ω9c (Fig. 5d and Fig. 6d). In general PFi was higher in gram negative and fungal PLFAs at both sites than other groups confirming their relatively greater and rapid involvement in rhizosphere C cycling than the less active and slower growing gram positive bacteria and actinomycete communities at both sites. Rather
20
than a uniform pattern of PFi of all PLFAs in both sites and periods, PFi of different mi-crobial groups shifted differently between sites and time periods. For example, PFi of
gram negative bacteria was generally greater in the surface layer of the upper site than that in the lower site while PFi of of gram positive bacteria was higher in the surface horizon of the lower site compared to that in the upper site. Gram negative PFi was
25
generally higher in April than in June (except cy17:0) at the lower site, while gram pos-itive PFi in the upper surface showed no prominent difference between April and June. Both gram negative and gram positive PFi generally decreased with depth. Among them, i14:0, i15:0 and i16:0 showed a significant decrease with depth at the lower site
HESSD
4, 3869–3907, 2007 Microbial community structure along a hydrological gradient W. K. Balasooriya et al. Title Page Abstract Introduction Conclusions References Tables Figures ◭ ◮ ◭ ◮ Back CloseFull Screen / Esc
Printer-friendly Version Interactive Discussion
EGU
(p<0.05), while i15:0, i16:0 and i17:0 significantly decreased with depth at the upper site (p<0.05). Significantly higher PFi (p<0.01) was observed with actinomycetes at the lower site surface horizon compared to that in the upper site. At the lower site, actinomycetes (10Me 16:0) PFi significantly increased with depth (p<0.05) and signif-icantly greater PFi was found for 10Me16:0 and 10Me18:0 (p<0.05) in June than in
5
April. PFi of fungal PLFAs was not prominently different between two sites in the sur-face layer, while PFi of 18:2ω6,9c and 18:1ω9c in the subsurface layer of the lower site was greater than that in the subsurface layer of the upper site. AMF showed higher PFi in June than in April at the lower site, while the other two fungal PLFAs showed the opposite pattern between April and June. PFi of 18:1ω9c showed a significant decline
10
with depth (p<0.05) in lower April and upper June respectively. An increase of PFi with depth was observed for 18:1ω9c and AMF fungal PLFAs at lower June.
None of the previous studies on 13CO2 pulse labeling based PLFA analysis, used
PFi as an indicator to assess the proportion of those microbial communities that are actively assimilating root derived C in the rhizosphere. However, PFi has been
suc-15
cessfully used byWilliams et al.(2006) as an indicator to assess the active microbial communities assimilating 13C-labeled residue-derived C in rhizosphere by δ13C en-riched straw addition under field conditions. Also a limited number of previous studies used 13CO2 pulse labeling based PLFA analysis to assess the active microbial
com-munities in root-derived C cycling in the rhizosphere (Butler et al.,2003;Treonis et al.,
20
2004;Denef et al.,2007;Lu et al.,2007). Butler et al.(2003) pulse labeled rye grass in laboratory microcosms and found maximum labeling in the fungal PLFA 18:2ω6,9c in rhizosphere soils. Treonis et al. (2004) found greater net labeling of gram negative and fungal PLFAs than gram positive PLFAs at surface soil layer (10 cm) in upland grassland fields. Denef et al.(2007) assessed microbial community dynamics based
25
on the proportional net labeling of individual PLFAs compared to that of a universal PLFA (i.e. 16:0) and found a rapid transfer of newly produced rhizosphere C to fungal PLFAs compared to bacterial PLFAs in the surface layers (7.5 cm) of grassland soils. Based on calculated net labeling in an in situ pulse labeling study of rice plants,Lu et
HESSD
4, 3869–3907, 2007 Microbial community structure along a hydrological gradient W. K. Balasooriya et al. Title Page Abstract Introduction Conclusions References Tables Figures ◭ ◮ ◭ ◮ Back CloseFull Screen / Esc
Printer-friendly Version Interactive Discussion
EGU
al. (2007) reported that gram negative and fungi were most actively assimilating root-derived C in the rhizosphere, whereas gram positive microorganisms became relatively more important in the soil layer below the root zone. Our PFi results indicating a rela-tively greater active proportion of gram negative and fungal PLFAs in the rhizosphere at both sites are in consistent with the results ofButler et al.(2003);Denef et al.(2007);
5
Lu et al.(2007). In agreement withLu et al.(2007), we found greater active proportion
of gram negative bacteria in the surface layer at the upper site compared to that in the subsurface layer. However, gram positive activity was depleted with depth in contrast toLu et al.(2007).
The PFi of gram positive bacteria and actinomycetes at both sites was very low
10
despite the observed higher relative abundances, indicating that more metabolically-inactive gram positive bacteria and actinomycetes were abundant in the rhizosphere soils at these sites or that these microbial communities were more dependent on other C resources such as soil organic C than newly produced-root derived C. PFi of gram negative bacteria and fungal PLFA 18:1ω9c and AMF at both sites and fungal
15
PLFA 18:2ω6,9c at the upper site were not substantially declined in relation to their relative abundances, suggesting that these microbial groups are more dependent on rhizodeposit-C as a C source for their growth. PFi of 18:2ω6,9c was rather low at the lower site despite its high relative abundance indicating, a preference of non-arbuscular mycorrhizal fungi for other C sources than new rhizodeposit-C at the lower site.
20
4.3 Linking microbial community structure to hydrological changes and vegetation composition
The observed shift from greater gram negative dominance at the well aerated soil sur-face in the drier upper site to greater gram positive dominance in the wetter lower site, is consistent with the patterns observed in other soil profiles (Sundh et al.,1997;Fierer
25
et al.,2003;Bossio et al.,2006). However the underlying causes of these shifts were interpreted differently.Fierer et al.(2003) concluded that availability of C resources and not anaerobiosis was the underlying cause of these patterns whileBossio et al.(2006)
HESSD
4, 3869–3907, 2007 Microbial community structure along a hydrological gradient W. K. Balasooriya et al. Title Page Abstract Introduction Conclusions References Tables Figures ◭ ◮ ◭ ◮ Back CloseFull Screen / Esc
Printer-friendly Version Interactive Discussion
EGU
concluded that aeration conditions, and not C availability per se were responsible for changes of microbial community structure. Hydrological changes are the key factors influencing aeration conditions of wetland soils (Davidsson et al., 1997). Anaerobic conditions can be expected in the lower site, due to inundation during winter months and a shallow ground water depth (GWD) throughout the year. In addition, the clayey
5
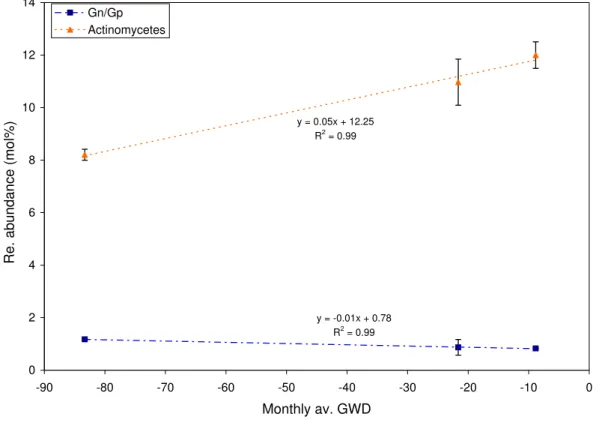
soil texture in the lower site enhanced the water logged anaerobic condition of these soils. In the surface layer of the upper site, more aerobic conditions can prevail, due to the sandy loam texture of the soil and deep GWD, which never rises 30 cm under-neath the soil surface. Monthly average GWD (over 2 years) in lower left and lower middle sampling points was 8.8 cm in April and that in June was 21.6 cm. In upper
10
left and upper middle sampling points the monthly average GWD in June was 83.3 cm and was significantly higher (p<0.01) than corresponding June GWD value in the lower site. The relationship between ground water depth vs. the relative abundance (MC%) of several microbial groups; gram positive, gram negative, actinomycetes and fungi (saprotrophic and AMF) was determined by linear regression. The realtive abundance
15
of a microbial group was calculated by summation of the relative abundances of indi-vidual PLFAs within the microbial group. Several groups showed significant relation-ships with GWD. The relative abundance of the gram negative bacteria at the surface layer was significantly decreased with increasing GWD (p<0.05, R2=0.46), while the relative abundance of the gram positive bacteria in the surface layer was positively
af-20
fected by increasing GWD (p<0.05, R2=0.40). The Ratio of the relative abundance of the gram negative bacteria over that of the gram positive bacteria (Gn/Gp) in the sur-face soils showed a significant negative relationship with the increasing GWD (p<0.05, R2=0.73). Actinomycetes were greatly increased with increasing GWD at the surface (p<0.01, R2=0.95) and at the subsurface (p<0.01, R2=0.60) (Fig.7). These results
25
suggest that anaerobic conditions imposed by incresaing GWD favors the abundance of gram positive bacteria and actinomycetes while gram negative bacteria prefer the aerobic surface layers where ground water is deep.
HESSD
4, 3869–3907, 2007 Microbial community structure along a hydrological gradient W. K. Balasooriya et al. Title Page Abstract Introduction Conclusions References Tables Figures ◭ ◮ ◭ ◮ Back CloseFull Screen / Esc
Printer-friendly Version Interactive Discussion
EGU
compared to the upper site (Table3). Within the lower site, organic C increased from April to June at the surface layers, while this increment was not significant at the sub-surface. Linear regression functions were obtained between the organic C content vs. the relative abundance of several dominant microbial groups. None of the bacterial communities showed significant relationships with soil organic C. However, the
rela-5
tive abundance of fungi at the subsurface soils significantly increased with increasing soil organic C (p<0.05, R2=0.74), indicating their dependence on soil organic C re-sources at depth. Greater biomass growth rate of Caricetum gracilis at the lower site than Arrhenatherum elatioris at the upper site could have caused greater soil organic C available in the lower site, explaining the unexpected larger abundance of saprotrophic
10
fungal communities, which are aerobic (Mentzer et al.,2006) at the more anaerobic lower sites. Caricetum gracilis in the lower site was also associated with slow growing anaerobic bacterial communities, whereas Arrhenatherum elatioris at the upper site was associated with fast growing aerobic bacterial communities in the surface soils. However, rather than the C availability, low C substrate quality, i.e. “low
decomposabil-15
ity” in vegetated wetlands found to control the microbial community structure; (i.e. de-crease the relative abundance of aerobic fast growing bacterial communities) (Bossio
et al.,2006). We therefore expected a greater decomposability of Arrhenatherum ela-tioris litter than Caricetum gracilis. Lower C/N ratios (16.2) found for the shoot samples of Arrhenatherum elatioris than for the shoot samples of Caricetum gracilis (21.7)
sup-20
port this hypothesis. However, more research is needed on decomposition rates in line with SIP-PLFA analysis to determine the effects of vegetation composition on soil microbial community structure.
5 Conclusions
The objective of the study was to investigate the effects of hydrology and vegetation
25
composition on soil microbial community structural differences. The study site is char-acterized by a hydrological gradient, with superficial ground water levels at the
depres-HESSD
4, 3869–3907, 2007 Microbial community structure along a hydrological gradient W. K. Balasooriya et al. Title Page Abstract Introduction Conclusions References Tables Figures ◭ ◮ ◭ ◮ Back CloseFull Screen / Esc
Printer-friendly Version Interactive Discussion
EGU
sion and deeper ground water depth at the upper site. This hydrological gradient re-sulted in two different vegetation communities along the hydrological gradient; Carice-tum gracilis at the depression and Arrhenatherum elatioris at the drier upper site. The effect of hydrology and vegetation composition on soil microbial community structures was investigated using SIP-PLFA technique. SIP-PLFA analysis showed greater
rela-5
tive abundance of aerobic gram negative communities in the surface layer of the upper site than that of the lower site, while the wetter lower site and the deeper soil layers were inhabited by gram positive bacterial communities. Despite their large abundance, the metabolically active proportion of gram positive bacterial and actinomycetes com-munities was less at both sites, suggesting their slow assimilation of root-derived C or
10
dependence on other soil organic C sources. However, gram negative bacteria and fungi (18:1ω9c and AMF) showed greater active involvement in assimilation of root-derived C at both sites. Ground water depth showed a significant effect on the relative abundance of several microbial communities. Relative abundance of gram negative bacteria was significantly decreased with increasing GWD while the relative abundance
15
of gram positive bacteria and actinomycetes at the surface layer increased with increas-ing GWD, suggestincreas-ing that anaerobic conditions imposed by increasincreas-ing GWD, favors the abundance of gram positive bacteria and actinomycetes while gram negative bacteria prefers the aerobic surface layers where ground water is deep.
Acknowledgements. The authors wish to thank the special research fund (BOF) of Gent
Uni-20
versity and to the Fond voor Wetenschappelijk Onderzoek – Vlaanderen (FWO-Vlaanderen). D. Loete is greatly acknowledged for ecohydrological monitoring and help with the pulse label-ing, J. Vermeulen and K. Van Nieuland are acknowledged for 13C-PLFA analysis.
References
Anupam, B.: Mycorrhizae in wetlands: a review, Int. J. For. Manage., 4, 34–40, 2003.3872
25
Battaglia, L. L. and Collins, B. S.: Linking hydroperiod and vegetation response in Carolina bay wetlands, Plant Ecology, 184, 173–185, 2006. 3871
HESSD
4, 3869–3907, 2007 Microbial community structure along a hydrological gradient W. K. Balasooriya et al. Title Page Abstract Introduction Conclusions References Tables Figures ◭ ◮ ◭ ◮ Back CloseFull Screen / Esc
Printer-friendly Version Interactive Discussion
EGU Bardgett, R. D. and Shine, A.: Linkages between plant litter diversity, soil microbial biomass
and ecosystem function in temperate grasslands, Soil Biol. Biochem., 31, 317–321, 1999.
3871
Boon, P. I., Virtue, P., and Nichols, P. D.: Microbial consortia in wetland sediments: a biomarker analysis of the effects of hydrological regime, vegetation and season on benthic
microorgan-5
isms, Mar. Freshwater Res., 47, 27–41, 1996. 3872
Borga, P., Nilsson, M., and Tunlid, A.: Bacterial communities in peat in relation to botanical composition as revealed by phospholipid fatty acid analysis, Soil Biol. Biochem., 26, 841– 848, 1994.3872
Boschker, H. T. S. and Middleburg, J. J.: Stable Isotopes and biomarkers in microbial ecology,
10
FEMS Microbial Ecol., 40, 85–95, 2002. 3872
Boschker, H. T. S., Nold, S .C., Wellsbury, P., Bos, D., de Graaf, W., Pel, R., Parkers, R. J., and Cappenberg, T. E.: Direct linking of microbial populations to specific biogeochemical processes by C-13-labeling of biomarkers, Nature, 392, 801–805, 1998. 3873
Bossio, D. A., Fleck, J. A., Scow, K. M., and Fuji, R.: Alteration of microbial communities and
15
water quality in restored wetlands, Soil Biol. Biochem., 38, 1223–1233, 2006. 3885,3889,
3891
Bossio, D. A., Scow, K. M., Gunapala, N., and Graham K. J.: Determinants of soil microbial communities: effects of agricultural management, season, and soil type on phospholipid fatty acid profiles. Microbial Ecology, 36, 1–12, 1998.3872
20
Butler, J. L., Williams, M. A., Bottomley, P. J., and Myrold, D. D.: Microbial community dynamics associated with rhizosphere carbon flow, Appl. Environ. Microbiol., 69, 6793–6800, 2003.
3873,3888,3889
Coles, J. R. P. and Yavitt, J. B.: Linking below ground carbon allocation to anaerobic CH4and CO2production in a forested peat land, New York State, Geomicrobiol. J, 21, 445–455, 2004.
25
3871
Colmer, T. D.: Long-distance transport of gases in plants: a perspective on internal aeration and radial oxygen loss from roots, Plant. Cell. Environ., 26, 17–36, 2003. 3871
Davidsson, T. E., Stepanauskas, R., and Leonardson, L.: Vertical patterns in nitrogen trans-formations during infiltration in two wetland soils, Appl. Environ. Microbiol., 63, 3648–3656,
30
1997. 3871,3890
Dawson, T. E., Mambelli, S., Plamboeck, A. H., Templer, P. H., and Tu, K. P.: Stable Isotopes in plant ecology, Ann. Rev. Ecol. Syst., 33, 507–559, 2002.3876
HESSD
4, 3869–3907, 2007 Microbial community structure along a hydrological gradient W. K. Balasooriya et al. Title Page Abstract Introduction Conclusions References Tables Figures ◭ ◮ ◭ ◮ Back CloseFull Screen / Esc
Printer-friendly Version Interactive Discussion
EGU Denef K., Bubenheim, H., Lenhart, K., Vermeulen, J., Van Cleemput, O., Boeckx, P., and
Muller, C.: Community shifts and carbon translocation within metabolically-active rhizosphere microorganisms in grasslands under elevated CO2, Biogeosciences, 4, 1–11, 2007,
http://www.biogeosciences.net/4/1/2007/. 3873,3877,3878,3887,3888,3889
Devito, K. J. and Hill, A. R.: Sulfate mobilization and pore water chemistry in relation to ground
5
water hydrology and summer drought in two conifer swamps on the Canadian Shield, Water Air Soil Pollut., 113, 97–114, 1999. 3871
Drijber, R. A., Doran, J. W., Parkhurst, A. M., and Lyon, D. J.: Changes in soil microbial com-munity structure with tillage under long-term wheat-fallow management, Soil. Biol. Biochem., 32, 1419–1430, 2000. 3878
10
Drissner, D., Wermbter, N., Niklaus, P. A., and Kandeler, E.: Nine years of enriched CO2 changes the function and structural diversity of soil microorganisms in a grassland, Eur. J. Soil Sci., 58, 260–269, 2007. 3872
Ellenberg H., Weber, H. E., D ¨ull, R., Wirth, V., Werner, W., and Paulissen, D.: Zeigerwerte von Pflanzen in Mitteleuropa, second edition: verbesserte und erweiterte Auflage, Scripta
15
Geobotanica, 18, 1992. 3882,3904
Engel, V., Jobby, E. G., Stieglitz, M., Williams, M., and Jackson, R. B.: Hydrological con-sequences of Eucalyptus afforestation in the Argentine Pampas, Water Resour. Res., 41, W10409, doi:10.1029/2004WR003811, 2005. 3880
Federle, T., Dobbins, D., Thornton-Manning, J., and Jones, D.: Microbial biomass, activity, and
20
community structure in subsurface soils, Ground Water, 24, 365–374, 1986. 3885
Fierer, N., Schimel, J. P., and Holden, P. A.: Variations in microbial community composition through two soil depth profiles, Soil Biol. Biochem., 35, 167–176, 2003. 3872,3885,3886,
3889
Fritze, H., Pietikainen, J., and Pennanen, T.: Distribution of microbial biomass and phospholipid
25
fatty acids in Podzol profiles under coniferous forest, European Journal of Soil Science, 51, 565–573, 2000. 3886
Frostegard, A., Baath, E., and Tunlid, A.: Shifts in the structure of soil microbial communities in limed forests as revealed by phospholipid fatty acid analysis, Soil Biol. Biochem., 25, 723– 730, 1993.3872
30
Griffiths, B., Ritz, K., Ebblewhite, N., and Dobson, G.: Soil microbial community structure: effects of substrate loading rates, Soil Biol. Biochem., 31, 145–153, 1999.3886
HESSD
4, 3869–3907, 2007 Microbial community structure along a hydrological gradient W. K. Balasooriya et al. Title Page Abstract Introduction Conclusions References Tables Figures ◭ ◮ ◭ ◮ Back CloseFull Screen / Esc
Printer-friendly Version Interactive Discussion
EGU ecology in freshwater wetland ecosystems, Plant soil, 289, 17–34, 2006. 3871
Halbritter, A. and Mogyorossy, T.: Phospholipid fatty acid (PLFA) analysis of rhizosphere bac-terial communities in a peat soil, Agrokemia et Talajtan, 51, 123–128, 2002. 3872
Hill, M. O.: TWINSPAN - a FORTRAN program for arranging multi-variate data in an ordered two-way table by classification of the individuals and attributes, Cornell University, Ithaca,
5
New York, 19, 1979. 3881,3904
Hume, N. P., Fleming, M. S., and Horne, A. J.: Denitrification potential and carbon quality of four aquatic plants in wetland microcosms, Soil. Sci. Soc. Am. J., 66, 1706–1712, 2002. 3871
Ingham, E. R. and Wilson, M. V.: The mycorrhizal colonization of six wetland plant species at sites differing in land use history, Mycorrhiza, 9, 233–235, 1999. 3872
10
Kennedy, A. C.: Rhizosphere, in: Principals and Applications of Soil Microbiology, edited by: Sylvia, D. M., Hartel, P. G., Fuhrman, J. J., and Zuberer, Z. A., Pearson Prentice, Hall pub-lishing, Upper Saddle River, NJ, 309–407, 2005. 3871
Leyer, I.: Predicting plant species’ responses to river regulation: the role of water level fluctua-tions, J. Appl. Ecol., 42, 239–250, 2005.3871
15
Londo, G.: Decimal scale for releves of permanent quadrats, Vegetatio, 782, 61–64, 1976.
3875,3904
Lu, Y., Abraham, W.-R., and Conrad, R.: Spatial variation of active microbiota in the rice rhizo-sphere revealed by in situ stable isotope probing of phospholipid fatty acids, Environ. Micro-biol., 9, 474–481, 2007. 3873,3888,3889
20
Mausbach, M. J. and Parker, W. B.: Background and history of the concept of hydric soils, in: Wetland soils, edited by: Richardson, J. L. and Vepraskas, M. J., Lewis, New York, 19–34, 2001. 3870
Mentzer, J. L., Goodman, R., and Balser, T. C.: Microbial seasonal response to hydrologic and fertilization treatments in a simulated wet prairie, Plant Soil, 284, 85–100, 2006.3871,3872,
25
3891
Olsson, P. A. and Johnson, N. C.: Tracking carbon from the atmosphere to the rhizosphere, Ecol. Lett., 8, 1264–1270, 2005. 3873
Peters, J., Wieme, V., Boeckx, P., Samson, R., Godoy, R., Oyarz ´un, C., and Verhoest, N.: Ecohydrological monitoring in natural and managed ecosystems in Southern Chile, Gayana
30
Bot ´anica (Chilean journal), 62, 120–129, 2006. 3874
Ponder, F. and Tadros, M.: Phospholipid fatty acids in forest soil four years after organic matter removal and soil compaction, Appl. Soil Ecol., 19, 173–182, 2002.3886