HAL Id: hal-00305134
https://hal.archives-ouvertes.fr/hal-00305134
Submitted on 26 Feb 2008
HAL is a multi-disciplinary open access
archive for the deposit and dissemination of
sci-entific research documents, whether they are
pub-lished or not. The documents may come from
teaching and research institutions in France or
abroad, or from public or private research centers.
L’archive ouverte pluridisciplinaire HAL, est
destinée au dépôt et à la diffusion de documents
scientifiques de niveau recherche, publiés ou non,
émanant des établissements d’enseignement et de
recherche français ou étrangers, des laboratoires
publics ou privés.
structural changes along a wetland hydrological gradient
W. K. Balasooriya, K. Denef, Jochen Peters, N. E. C. Verhoest, P. Boeckx
To cite this version:
W. K. Balasooriya, K. Denef, Jochen Peters, N. E. C. Verhoest, P. Boeckx. Vegetation composition
and soil microbial community structural changes along a wetland hydrological gradient. Hydrology
and Earth System Sciences Discussions, European Geosciences Union, 2008, 12 (1), pp.277-291.
�hal-00305134�
www.hydrol-earth-syst-sci.net/12/277/2008/ © Author(s) 2008. This work is distributed under the Creative Commons Attribution 3.0 License.
Earth System
Sciences
Vegetation composition and soil microbial community structural
changes along a wetland hydrological gradient
W. K. Balasooriya1, K. Denef2, J. Peters1, N. E. C. Verhoest1, and P. Boeckx2
1Department of Forest and Water Management, Ghent University, Coupure links 653, 9000 Gent, Belgium
2Department of Applied Analytical and Physical Chemistry, Ghent University, Coupure links 653, 9000 Gent, Belgium Received: 4 October 2007 – Published in Hydrol. Earth Syst. Sci. Discuss.: 18 October 2007
Revised: 25 January 2008 – Accepted: 25 January 2008 – Published: 26 February 2008
Abstract. Fluctuations in wetland hydrology create an
in-terplay between aerobic and anaerobic conditions, control-ling vegetation composition and microbial community struc-ture and activity in wetland soils. In this study, we inves-tigated the vegetation composition and microbial commu-nity structural and functional changes along a wetland hy-drological gradient. Two different vegetation communities were distinguished along the hydrological gradient;
Carice-tum gracilis at the wet depression and ArrhenathereCarice-tum ela-tioris at the drier upper site. Microbial community structural
changes were studied by a combined in situ13CO2pulse la-beling and phospholipid fatty acid (PLFA) based stable iso-tope probing approach, which identifies the microbial groups actively involved in assimilation of newly photosynthesized, root-derived C in the rhizosphere soils. Gram negative bac-terial communities were relatively more abundant in the sur-face soils of the drier upper site than in the sursur-face soils of the wetter lower site, while the lower site and the deeper soil lay-ers were relatively more inhabited by gram positive bacterial communities. Despite their large abundance, the metaboli-cally active proportion of gram positive bacterial and actino-mycetes communities was much smaller at both sites, pared to that of the gram negative bacterial and fungal com-munities. This suggests much slower assimilation of root-derived C by gram positive and actinomycetes communi-ties than by gram negative bacteria and fungi at both sites. Ground water depth showed a significant effect on the rela-tive abundance of several microbial communities. Relarela-tive abundance of gram negative bacteria significantly decreased with increasing ground water depth while the relative abun-dance of gram positive bacteria and actinomycetes at the sur-face layer increased with increasing ground water depth.
Correspondence to: W. K. Balasooriya
1 Introduction
Wetland ecosystems are characterized by hydric soils which support hydrophilic vegetation (Mausbach and Parker, 2001). Fluctuations in wetland hydrology regulate the avail-ability of oxygen, resulting in the interplay between aerobic and anaerobic processes of key biogeochemical cycles, such as nitrification, denitrification and methanogenesis (Davids-son et al., 1997). These wetland biogeochemical cycling pro-cesses are mostly microbially mediated. While wetland mi-crobiology is receiving increasing research attention, it still remains under investigated. Wetland biogeochemistry re-search has mainly focused on (i) biogeochemical studies of processes, and, although less thoroughly studied, (ii) micro-bial ecological studies of populations and community struc-ture (Gutknecht et al., 2006).
Hydrology is a dominant factor controlling microbial pro-cesses in wetlands (Bardgett and Shine, 1999; Gutknecht et al., 2006; Mentzer et al., 2006). Higher water levels increase the rate of anaerobic processes, such as denitrification (Smith and Tiedje, 1979), methanogenesis (Coles and Yavitt , 2004), and sulfate reduction (Devito and Hill , 1999), and decrease rates of aerobic processes, such as nitrification (Qiu and Mc-Comb, 1996) by creating low oxygen and anaerobic soil mi-cro sites. In addition, temporal fluctuations of soil mois-ture from drying/wetting cycles stimulate denitrification in wet cycles and nitrification in dry cycles (Qiu and McComb, 1996; Venterink et al., 2002).
Additionally, hydrology affects vegetation composition since wetland plant species occurrence has been shown to be highly responsive to fluctuations in water level (Leyer, 2005; Van der Hoek and Sykora, 2006) and hydroperiod (Battaglia and Collins, 2006; Peters et al., 20071). Plants can influence 1Peters, J., Verhoest, N., Boeckx, P., Balasooriya, W. K., and Samson, R.: Hydrologic and vegetative analysis of an alluvial flood-plain in Belgium, Belgian Journal of Botany, in review, 2007.
microbial functions directly by providing resources in lit-ter (Bardgett and Shine, 1999), with variations among plant types or species depending on their nutrient content (Hume et al., 2002). Indirectly, plants affect microbial processes through their rhizosphere characteristics. The rhizosphere receives readily decomposable labile resources from plant roots (Kennedy, 2005) and increase oxygen levels relative to the surrounding wetland soil (Colmer, 2003).
While bacterial communities generally dominate the wet-land soil microbial community (Boon et al., 1996), mycor-rhizal fungi adapted to wetland conditions also occur (Anu-pam, 2003). Wetland hydrology may affect the general mi-crobial community structure (Sundh et al., 1997; Mentzer et al., 2006), or specific organisms, such as mycorrhizal fungi (Wetzel and VanderValk, 1996). Wetland microbial com-munity structure has also been shown to vary among plant species rhizospheres (Halbritter and Mogyorossy, 2002) and with plant community composition (Borga et al., 1994; Sundh et al., 1997; Ingham and Wilson, 1999).
Different biochemical and microbiological techniques have been used to describe the general structure of soil and aquatic microbial communities. In situ characteriza-tion of microbial community composicharacteriza-tion is commonly done through in situ analysis of specific components (biomark-ers), which are only produced by and therefore character-istic for specific microbial groups. For example, the ysis of phospholipid fatty acids (PLFA) is based on the anal-ysis of a group of cell membrane lipids, several of which can be used as biomarkers for specific microbial communi-ties (Vestal and White, 1989; Zelles, 1997). The polar group of phospholipids is rapidly hydrolyzed upon microbial cell death, hence the fatty acids in intact phospholipids are as-sumed to originate from living micro organisms (White et al., 1979; Zelles, 1997). In wetland studies, PLFA analy-sis has shown microbial community compositional changes across different wetlands (Borga et al., 1994; Boon et al., 1996; Sundh et al., 1997) as a result of differences in hy-drological fluctuations (Sundh et al., 1997; Mentzer et al., 2006). Although most PLFA studies have provided valuable information regarding the structure of the microbial commu-nity (Frostegard et al., 1993; Bossio et al., 1998; Steer and Harris, 2000; Fierer et al., 2003; Drissner et al., 2007), they usually do not reveal any information regarding the func-tion of microbial communities associated with C cycling. Technological developments in mass-spectrometry in the last decades have made it possible to integrate stable isotope analysis into biomarker analysis (Boschker and Middleburg, 2002). The combination of 13C stable isotope and PLFA analysis through Gas Chromatography-Combustion-Isotope Ratio Mass Spectrometry (GC-C-IRMS) has made it possi-ble to trace the flow of C from a13C-labeled substrate into the PLFA fraction of the microbial communities (Boschker et al., 1998), and to identify the microbial communities ac-tively assimilating the labeled substrate-derived C. This com-bined approach is unique as it allows to assess the
specifi-cally “active” proportion of the microbial community and to link biogeochemical processes with microbial identity. Sta-ble isotope probing (SIP) of PLFA has been successfully at-tained through laboratory incubations with13C enriched sub-strate additions (Waldrop and Firestone, 2004), in situ en-riched substrate additions (Williams et al., 2006), as well as in situ13CO2 pulse labeling of growing plants (Treonis et al., 2004; Prosser et al., 2006; Denef et al., 2007; Lu et al., 2007). By using in situ PLFA-based SIP analysis, several studies have demonstrated a dominant contribution of fungi in the immediate assimilation of rhizosphere-derived C in grasslands (Butler et al., 2003; Treonis et al., 2004; Olsson and Johnson, 2005; Denef et al., 2007). In this study, PLFA-based SIP was performed through an in situ stable isotope 13CO2pulse labeling approach in a natural wetland ecosys-tem to examine the incorporation of rhizodeposition into in-dividual PLFAs across a spatial and temporal hydrological gradient. The main objective of this study was to examine if a wetland hydrological gradient and consequent vegetation composition distributions are linked to microbial community structural differences.
2 Description of the study site
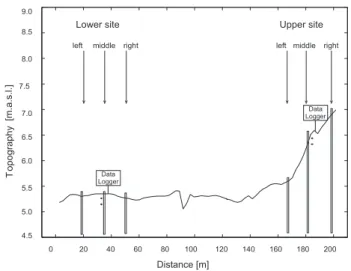
The study was conducted along a topographical tran-sect in the Northern part of the wetland nature reserve Ossemeersen, Ghent, Belgium. The Bourgoyen-Ossemeersen is an alluvial complex characterized by flood-plains of the river Leie. Higher levees are found next to the river with well drained sandy to silty textured soil types while floodplain depressions in the hinterland have clay soils with gleyic properties. The management of the Bourgoyen-Ossemeersen aims at increasing the botanical and ornitho-logical value of the nature reserve area. During winter (November–March), a floodgate is closed and the gravita-tional drainage of the area is blocked up to a height of 5.67 m a.s.l. The rate of ground water depth rising is depen-dent on the precipitation during this period. From the first of March on, gravitational drainage is allowed to a height of 5.27 m a.s.l., but evapotranspiration losses might further lower the actual ground water depth. The vegetation of Bourgoyen-Ossemeersen consists of several grassland asso-ciations. Areas with high productivity are mown twice a year (June and September), whereas areas with lower productiv-ity are mown once a year. Some other parcels are seasonally grazed. Along the transect, an upper site on the levee and a lower site in the depression, each approximately 15 m long, were selected. Each of the two sites was subdivided in a left, middle and right sampling point (Fig. 1). The elevation ranges from 5.3 m a.s.l. at the lower site to 7 m a.s.l. at the up-per site (Peters et al., 2006). Soil texture at the different sites could be summarized as: (i) clay soils at the lower site; (ii) a sandy loam soil texture at the upper left sampling point, and
(iii) sandy soils at the upper middle and upper right sampling points.
3 Methods
3.1 Monitoring of the eco-hydrological site conditions 3.1.1 Hydrological data
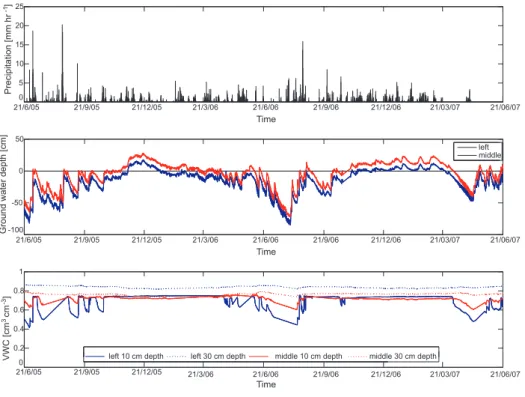
At each sampling point (left, middle and right) of the lower and the upper site, soil water content reflectometers (CS616, Campbell Scientific Ltd.) were installed at 10 and 30 cm depths for measuring the volumetric water content (VWC) of the soil [cm3cm−3]. In addition piezometers were installed and equipped with divers (TD Diver, Van Essen Instruments) to measure ground water depths relative to the soil surface. Details on the field position of the devices can be seen in Fig. 1. Hourly data recorded during a sampling period of two years (from 21 June 2005 until 21 June 2007) was extracted for this study. Additional information on precipitation was gathered from the nearby weather station Vinderhoute (4 km from the study area), managed by the Flemish environmental agency VMM (hydronet databank http://www.hydronet.be). Time series of precipitation, ground water depth and soil wa-ter content are given in Figs. 2 and 3.
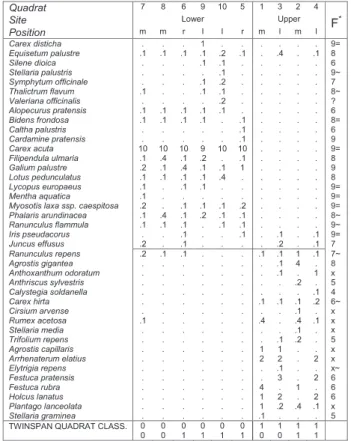
3.1.2 Vegetation data
Vegetation at the lower and the upper sites have been moni-tored on both floristic composition and vegetation structural variables. Floristic data were gathered by installing six per-manent quadrats of 2 m by 2 m at both sites (12 quadrats in total), located near the three sampling points. In Au-gust 2006, the species composition within these quadrats was described, and the abundance of recorded species was esti-mated using the decimal Londo scale (Londo, 1976). The vegetation structure was described by means of two vari-ables: living above ground biomass [gm−2], and leaf area [m2m−2], which is the quotient of the total one-sided green leaf area and the ground area. Therefore monthly samples were taken by harvesting six randomly distributed 30 cm by 30 cm patches on the lower and upper site. Dead and liv-ing plant materials of the vegetation samples were separated prior to the determination of the leaf area using a LI-3100 leaf area meter (LI-COR Biosciences). Finally, the plant ma-terial was oven dried (48 h, 70◦C) and weighted to determine the above ground biomass.
3.2 Assessment of microbial community structure and function
3.2.1 Experimental13CO2pulse labeling
In April and June 2007, 13CO2 pulse labeling events were conducted. In April, pulse labeling was performed on three
Distance [m] Data Logger Data Logger 9.0 8.5 8.0 7.5 7.0 6.5 6.0 5.5 5.0 4.5
left middle right left middle right
0 20 40 60 80 100 120 140 160 180 200
T
opography
[m.a.s.l.]
Lower site Upper site
Fig. 1. Lower and the upper site along the topographical transect
in the Bourgoyen-Ossemeersen. The left, middle and right sam-pling points at each site are indicated by arrows, long tubes are the piezometers and + indicates the soil water content reflectometers.
replicate plots at the lower site whereas in June, this was done on three replicate plots at both the lower and upper site on two consecutive days. For each pulse labeling event, 500 ml of13C labeled (99 atom %) CO2was supplied to photosyn-thesizing plants inside a Plexiglass chamber (30×30×30 cm) over a period of 6 daylight hours. A Tedlar gas sampling bag (1L, Alltech) fixed to a 50 ml gas sampling bulb with a stop cock was used in the field to temporarily store13CO2 gas from the pressurized gas bottle, and allowed sampling of a known volume of13CO2 gas at atmospheric pressure prior to injection into the labeling chamber. When the CO2 level in the chambers fell below 250 ppm, 100 ml of13CO2 was transferred into a 100 ml gas tight syringe (1100, Hamil-ton) from the gas sampling bulb and injected into the la-beling chamber through a septum. The injections were re-peated four times more, approximately in one hour intervals. Each injection was done when CO2levels inside the cham-bers were below 250 ppm. Three replicate chamcham-bers, placed 2 m apart were placed on top of stainless-steel frames firmly inserted in the soil to a depth of about 10 cm. CO2 concentra-tions were monitored (EGM-4, PP systems) within the cham-bers during the 6 hour pulse labeling to follow the uptake of 13CO
2 by photosynthesizing plants. The next day, cham-bers were removed approximately 24 hours after the first labeled CO2 injection, when all respired 13CO2 was com-pletely taken up by plant photosynthesis.
3.2.2 Sampling and δ13C determinations in solid samples From each pulse labeled square within a site (n=3), soil samples at 0–10 cm and 10–20 cm depth and shoot samples were taken after 24 h, immediately following the removal of
21/6/05 21/9/05 21/12/05 21/3/06 21/6/06 21/9/06 21/12/06 21/03/07 21/06/07 0 5 10 15 20 25 Time Precipitation[mmhr -1] 21/6/05 21/9/05 21/12/05 21/3/06 21/6/06 21/9/06 21/12/06 21/03/07 21/06/07 -100 -50 0 50 Time Groundwaterdepth[cm] 0 0.2 0.4 0.6 0.8 1 Time VWC[cm 3cm -3] left middle
left 10 cm depth left 30 cm depth middle 10 cm depth middle 30 cm depth
21/6/05 21/9/05 21/12/05 21/3/06 21/6/06 21/9/06 21/12/06 21/03/07 21/06/07
Fig. 2. Time series of precipitation, ground water depth and volumetric water content (VWC) in the lower site from 21 June 2005 to 21 June
2007. 21/6/05 21/9/05 21/12/05 21/3/06 21/6/06 21/9/06 21/12/06 21/03/07 21/06/07 0 5 10 15 20 25 Time Precipitation[mmhr -1] 21/6/05 21/9/05 21/12/05 21/3/06 21/6/06 21/9/06 21/12/06 21/03/07 21/06/07 -200 -150 -100 -50 0 50 Time Groundwaterdepth[cm] left middle 21/6/05 21/9/05 21/12/05 21/3/06 21/6/06 21/9/06 21/12/06 21/03/07 21/06/07 0 0.2 0.4 0.6 0.8 1 Time VWC[cm 3cm -3]
left 10 cm depth left 30 cm depth middle 10 cm depth middle 30 cm depth
Fig. 3. Time series of precipitation, ground water depth and volumetric water content (VWC) in the upper site from 21 June 2005 to 21 June
the chambers. In addition, composite samples of soil and shoots were taken prior to labeling as controls. All sam-ples were immediately stored on ice and transported to the laboratory where soil samples were frozen (−20◦C). Later, soil samples were thawed and wet sieved through a 250 µm sieve to remove all visible roots, macro fauna and fresh lit-ter since plants contain large concentrations of the fungal biomarker PLFA “linoleic acid” (18:2ω6,9c) (Zelles, 1997). Direct dry sieving was not practicable due to high density of root mats and clayey texture in the samples from the lower site. The soil suspension from wet sieving was centrifuged at 2500 rpm for 10 min and the pellet was immediately frozen (−20◦C) to recover the soil fraction. To obtain a dry sam-ple for PLFA analysis, these frozen soil pellets were freeze dried. Dry sieving was done as the last step (50 µm) in order to exclude any fine root hairs. Shoot samples and separated root fractions were oven dried (24 h at 60◦C) and then ground
to a fine homogeneous powder using an ultra centrifugal mill (ZM200, Retsch Germany). A subsample of ground shoot and root samples (1.5 mg) and soil samples (20 mg) were an-alyzed for C, N and13C content using an Elemental Analyzer (EA) (ANCA-SL, Europa PDZ, UK) coupled to an Isotope Ratio Mass Spectrometer (IRMS) (20-20, Sercon, UK) (EA-IRMS). Samples measured in tin capsules were loaded into the EA using an auto sampler. The temperature at the com-bustion and reduction stages was 1800◦C and 600◦C respec-tively. Water is removed by a magnesiumperchlorate trap. Before entering the mass spectrometer, the gas stream passes a gas chromatograph which separates CO2from N2gas. In the IRMS (90 eV electron voltage, 144 µA trap, He carrier gas, continuous flow, 10−7mbar vacuum pressure, 90% fo-cus) gaseous molecules are ionized in the ion source, then separated according to their mass-to charge ratio and finally collected in an array of Faraday cups (three Faraday cup col-lectors for m/z 44, 45, and 46). Reference CO2of known isotopic composition was used for sample calibration and in-troduced directly into the source three times at the start and end of each run. Each sample was run in duplicate to ensure reliable mean13C values. Isotope ratios were calculated as below (Dawson et al., 2002), and reported in terms of δ13C ‰ (per mil) values.
δ13C = Rsample−Rreference
Rreference
×103 (1)
where Rsampleis the13C/12C ratio of sample and Rreferenceis the13C/12C ratio of Vienna-Pee Dee Belemnite (V-PDB) ref-erence standard from the IAEA. Finally the13C enrichment (1δ13C ‰) of shoot, root and soil samples was calculated by subtracting the pre-labeling natural abundance δ13C val-ues from the post-labeling δ13C values of solid samples. 3.2.3 PLFA extraction and quantification
The extraction, quantification and compound specific δ13C analysis of PLFAs was performed following the method
de-scribed by Denef et al. (2007). Total lipids were extracted from 6 g of soil using phosphate buffer/chloroform/methanol at a 0.9:1:2 ratio. Total lipids retrieved in the chlo-roform phase were partitioned on silica gel columns (CHROMABOND SiOH 500 mg). Neutral and glycolipids were eluted from these columns with 6 ml of chloroform and 10 ml of acetone and discarded. Phospholipids were eluted with 5 ml methanol and the solution was dried un-der N2. Phospholipids were subsequently transesterified by mild methanolysis (1:1 methanol-toluene, 0.2 M methano-lic KOH, heated for 15 min at 35◦C) to form volatilizable fatty acid methyl esters (FAMEs). FAMEs were analysed by capillary gas chromatography combustion-isotope ra-tio mass spectrometry (GC-C-IRMS) (GC-C/DeltaPLUSXP Thermo Scientific) via a GC/C III interface. The gas chro-matograph (splitless mode; He carrier gas) was equipped with a Chrompack CP-SIL88 column (100 m×0.25 mm i.d. ×0.2 mm, Varian Inc.). The oven temperature was programmed at 75◦C for 2 min, followed by a ramp at 5◦C min−1 to 180◦C with a 20 min hold, and a final ramp at 2◦C min−1 to 225◦C with a 20 min hold. Individual fatty acids were identified based on relative retention times compared to two internal standards (12:0 and 19:0) which were added to the FAME extract prior to gas chromatogra-phy and cross referenced with several standards: a mixture of 37 FAMEs (37 component FAME mix, no. 47885, Su-pelco Inc.), a mixture of 24 bacterial FAMEs (BAME mix, no. 47080, Supelco Inc.) and several individual FAMEs (Su-pelco Inc. and Larodan Inc.).
On average, 25 PLFA peaks were detected and quantified, but only 14 were investigated in this study depending on their use as biomarker fatty acids for different microbial commu-nities (Zelles, 1997). Fatty acid nomenclature consists of the total number of C atoms, a colon, and the number of double bonds. Then an “ω” and a number showing the position of the double bond in the chain, sometimes followed by a “c” or “t” for “cis” or “trans” configuration respectively. The pre-fixes “i”, “a” and “10Me” refer to methyl branching at the iso and anteiso positions and the carboxyl group from the 10th carbon respectively. Cyclopropane fatty acids have the pre-fix “cy” (Sundh et al., 1997). The 14 biomarker PLFAs anal-ysed within this data set included: 18:1ω9c and 18:2ω6,9c (indicative of saprotrophic fungi), 16:1ω5c (indicative of ar-buscular mycorrhizal fungi (AMF)), i14:0, i15:0, i16:0, i17:0 and a17:0 (indicative of gram positive bacteria), cy17:0, 16:1ω7c and 18:1ω7c (indicative of gram negative bacteria) and 10Me16:0 and 10Me18:0 (indicative of actinomycetes) (Denef et al., 2007). In most GC chromatograms, a17:0 and 16:1ω7c peaks overlapped, leading to an identification based on the relative abundance of other biomarker fatty acids in the sample. Chromatographic peak area ratios of each indi-vidual PLFA to that of 16:0, a universal PLFA occurring in the membranes of all organisms, were determined. Peak area ratios less than 0.02 were excluded from the data set (Drijber et al., 2000). Based on regressions between peak area and
Table 1. Cross-correlations between ground water depth changes
and precipitation for different time lags [h] after the rainfall event.
LOWER UPPER
left middle left middle GWD vs. Precipitation time lag 0 h 0.22 0.16 0.20 0.19 time lag 1 h 0.37 0.22 0.30 0.24 time lag 2 h 0.23 0.32 0.40 0.31 time lag 3 h 0.20 0.24 0.30 0.28 time lag 10 h 0.02 0.03 0.02 0.15 GWD vs. VWC10 time lag 0 h 0.31 0.25 0.51 0.62 time lag 1 h 0.17 0.14 0.19 0.25 time lag 2 h 0.12 0.12 0.16 0.22 time lag 3 h 0.06 0.077 0.08 0.10 time lag 10 h 0.006 0.016 0.02 −0.009 GWD vs. VWC30 time lag 0 h 0.056 0.055 0.36 0.26 time lag 1 h 0.046 0.030 0.18 0.34 time lag 2 h 0.018 0.018 0.14 0.32 time lag 3 h 0.031 0.023 0.08 0.31 time lag 10 h 0.014 0.099 0.02 0.17
Maximal cross-correlation values are underlined.
PLFA concentration of a dilution series of the quantitative “37 component FAME mix”, the C concentrations [nmol g−1 soil] of the individual biomarker PLFAs in the soil samples were quantified (Denef et al., 2007). Relative proportions of the individual PLFA-C ([PLFA-C]i) to total PLFA-C of
the sample (MCi) were calculated and expressed as
PLFA-C mol% as an indicator of relative abundance of microbial communities. MCi = [PLFA-C]i P [PLFA-C]i ×100 (2) 3.2.4 Compound-specific13C analysis
In order to calculate δ13C value in each PLFA, the δ13C val-ues of FAMEs obtained from GC-C-IRMS were corrected for the addition of the methyl group during transesterification.
δ13CPLFA=[NPLFA+1]δ
13C
FAME−δ13CMeOH NPLFA
(3) where NPLFAis the number of C atoms of the PLFA compo-nent, CFAMEis the δ13C value of the FAME and CMeOHis the
δ13C value of methanol determined by EA-IRMS (−36.7%,
n=5).
The13C enrichment or net labeling of PLFAs (1δ13C ‰) was calculated by subtracting the pre-labeling natural abun-dance PLFA δ13C values from the post-labeling PLFA δ13C values. The proportion of root-derived PLFA-C was
calcu-lated for each individual PLFA through the following equa-tion (Williams et al., 2006):
FCi =
δli−δui
δr−δui
×MCi (4)
where FCi is the relative fraction of C in each PLFA derived
from the 13C-labeled roots, MCi is the relative mol % of
PLFA-C in each PLFA to the total PLFA-C in the sample. δli
represents the δ13C of the PLFA-C in the post-labeled sam-ple, δuirepresents the δ13C of the PLFA-C in the pre-labeled
sample, and δr represents the δ13C of the post-labeled roots.
The relative proportion of root-derived PLFA-C (PFi) was then calculated for each individual PLFA using the follow-ing equation (Williams et al., 2006):
PFi=MCi/
X
FCi×100 (5)
4 Results and discussion
4.1 Spatio-temporal changes of eco-hydrological variables 4.1.1 Ground water depth
A clear gradient in ground water depths can be observed along the studied transect. Temporal averages range from 4.6 cm and 15.5 cm below surface at the lower middle and left monitoring points respectively, to 37.9 cm and 94.7 cm below surface at the left and middle monitoring points of the upper site. Ground water depths showed an annual pattern, with a deeper ground water table during summer and a more superficial ground water table during winter. Although this pattern was observed at all measurement points, inundation only occurs at the lower site with average flood durations of three to five months during winter and spring. Beside the an-nual ground water fluctuations, a daily fluctuation can be ob-served at the lower site during dry periods. These fluctuations can be a result of ground water consumption through tran-spiration activities of phreatophytic plant species, similar to what was reported in many other studies (White, 1932; Engel et al., 2005; Schilling, 2007). During daytime, when plants are actively photosynthesizing, water consumption causes a drop down of the ground water table which is (partially) re-plenished during night. At the upper site, this phenomena is absent (upper middle) or less pronounced in amplitude (up-per left) (Peters et al., 20071).
The cross-correlation function was calculated to inspect the relationship between hourly precipitation [mm h−1] and the change in ground water depth [cm h−1] for different time lags [h] after the rainfall event (Table 1). Maximal cross-correlation values were found one or two hours after rainfall, since higher infiltration rates at the upper site compensate for the higher distance to the ground water table. The highest cross-correlation value was calculated at the upper left moni-toring point and results from the high permeability of the soil,
the relative superficial ground water table and the lack of in-undation. At the lower site, notwithstanding a shallow mean ground water depth, cross-correlation values were found to be lower, which may be attributed to the winter inundations. During inundations, cross-correlations are low (0.13) due to saturated conditions compared to cross-correlation value dur-ing summer (0.49). At the upper middle monitordur-ing point, cross-correlation is lowest, indicating the less pronounced re-sponse of the ground water table to a rainfall event. Because of the greater depth of the ground water table, a relatively large proportion of the precipitation water never reaches the ground water table as it is stored in the soil volume above. 4.1.2 Soil water content
At the lower site the volumetric water contents of the soil lay-ers increases with increasing depth (Fig. 2). At 30 cm depth, a year round soil saturation results in a constant volumetric water content of around 0.8 cm3cm−3. At 10 cm depth, sat-uration is only interrupt during summer, but even then values are very high (in the range of 0.5–0.7 cm3cm−3). These high values result from the high amount of organic C in the top soil (Table 2). The time series of volumetric water contents at the upper middle and left point differ considerably. At the upper middle sampling point, volumetric water content increases with depth, and fluctuations are noticed in both. The upper left site, however, is characterized by a higher water content at 10 cm depth, and saturated soil water conditions at 30 cm depth.
The relation between precipitation and volumetric water content at different depths was evaluated using the cross-correlations function. At a depth of 10 cm high cross-correlations were found immediately after the rainfall event. At the upper site, correlations are twice as high as at the lower site due to the lack of winter inundation. A response of soil water con-tent at a depth of 30 cm to precipitation is only present at the upper site.
4.1.3 Vegetation
Based on species occurrence and abundance data, two dif-ferent vegetation associations could be distinguished along the transect using TWINSPAN (Hill, 1979): Caricetum
gra-cilis Almquist 1929 at the lower site and Arrhenatheretum elatioris Braun 1915 at the upper site. Caricetum gracilis
Almquist 1929 (Schamin´ee et al., 1995) is a Carex acuta L. dominated vegetation type with Ranunculus flammula L. and Galium palustre L. Arrhenatheretum elatioris Braun 1915 (Schamin´ee et al., 1996) is a grassland association with
Arrhenatheretum elatioris (L.)J. & C. Presl., Festuca rubra
L., Plantago lanceolata L. and Ranunculus repens L. Ellen-berg moisture figures (EllenEllen-berg et al., 1992) indicate a clear gradient from species occurring at intermediately moist habi-tats at the upper site toward species occurring on hydric soils in the depression (Fig. 4).
Fig. 4. Synoptic table of species abundances per quadrat (.1<1%,
.2=1–3%, .4=3–5%, 1=5–15%, 2=15–25%, 3=25–35%, 4=35– 45%, 5=45–55%, 6=55–65%, 7=65–75%, 8=75–85%, 9=85–95%, 10=95–100%), according to the Londo scale (Londo, 1976) and subdivided according to TWINSPAN (Hill, 1979). Quadrats are lo-cated near the left (l), middle (m) and right (r) sampling points of the upper and the lower sites (see Fig. 1). F* Ellenberg moisture figure (Ellenberg et al., 1992), indicating the occurrence of plant species in the gradient from dry, shallow-soil rocky slopes to swampy ground (1–9) as well as from shallow to deep water (10–12). The sym-bol “∼” stands for changing moisture conditions, “=” for species of (temporarily) inundated habitats, “x” for indifferent species.
Vegetation structure was described during the year 2006 by means of above ground living biomass [gm−2] and leaf area [m2m−2] (Table 3). Vegetation development started from zero at the lower site, and biomass and leaf area val-ues did not increase very much during the period January– April. From May until July, a rapid increase in biomass (from 184.4 gm−2 until 746.3 gm−2) and leaf area (from 2.23 m2m−2until 8.27 m2m−2) was measured, which was leveled off during August. In September, lower values were measured due to natural senescence. This was followed by a mowing event which drastically decreased above ground biomass (−426.2 gm−2) and leaf area (−3.26 m2m−2). A short regrowth period during November increased values slightly. The observed vegetation development differed quite a lot between the lower and the upper site. During winter, an
Table 2. Isotope composition (δ13C ‰) and δ13C enrichment (1δ13C ‰) of shoot, root and soil samples taken prior to (unl.) (n=3), and 24 h after (lab.) (n=3)13CO2pulse labeling. Soil organic carbon content (%) is also included.
LOWER UPPER
Month Sample Depth [cm] Organic C unl. δ13C lab. δ13C 1δ13C Organic C unl. δ13C lab. δ13C 1δ13C
April Shoot C −28.02 2819.44 2847.46 Root C 0–10 −28.38 4.42 32.80 10–20 −27.55 −11.29 16.26 Soil C 0–10 3.90 −28.65 −25.23 3.42 10–20 2.84 −28.51 −28.68 −0.17 June Shoot C −27.90 1135.81 1163.71 −29.32 1289.40 1318.72 Root C 0–10 −27.46 −9.39 18.07 −29.29 26.76 56.05 10–20 −28.55 −12.45 16.10 −24.66 61.83 86.49 Soil C 0–10 8.82 −28.42 −25.90 1.81 2.52 −28.29 −22.12 6.17 10–20 4.06 −29.06 −27.46 1.60 1.43 −27.85 −25.6 2.24
1δ13C denotes the net increase of δ13C ‰ relative to natural abundance δ13C ‰ values of shoot, root and soil C.
Table 3. Monthly data on biomass [gm−2] and leaf area [m2m−2] at the lower and the upper site.
LOWER UPPER
Biomass Leaf area Biomass Leaf area
Month mean ±std mean ±std mean ±std mean ±std
Jan 0 – 0 – 127.2 14.6 1.9 1.0 Feb 15.6 4.2 0.15 0.03 107.8 23.6 1.2 0.3 Mar 26.1 38.0 0.10 0.04 63.5 15.6 0.6 0.1 Apr 25.0 6.5 0.28 0.1 65.9 6.9 0.8 0.2 May 184.4 47.5 2.23 0.6 147.0 40.2 1.2 0.2 Jun 654.7 124.6 7.15 1.2 469.7 149.2 3.9 1.2 Jul 746.3 87.3 8.27 0.7 36.7 13.7 0.3 0.2 Aug 757.2 128.8 7.11 1.5 104.6 20.0 1.2 0.2 Sep 450.4 113.9 3.44 1.0 211.3 17.8 3.0 0.5 Okt 24.2 8.2 0.18 0.1 229.8 55.2 3.3 0.9 Nov 56.7 10.7 0.64 0.2 175.4 25.9 2.3 0.2 Dec 35.6 3.2 0.27 0.1 143.7 43.4 2.3 0.5
above ground living biomass of ≈115 gm−2was measured, which decreased in March and April. As seen at the lower site, a fast increase in biomass and leaf area was measured during May and June, with maximal values of 469.7 gm−2 and 3.9 m2m−2, respectively. A mowing event at the end of June drastically decreased biomass (−433 gm−2) and leaf area (−2.7 m2m−2). Vegetation recovery was fast, and a second growing period after the mowing event resulted in biomass and leaf area values as high as 229.8 gm−2 and 3.3 m2m−2, respectively.
4.2 microbial community structure and function 4.2.1 δ13C enrichment of shoot, root and soil C
All 3 pulse labeling events in the lower and the upper sites resulted an increased δ13C signature of the shoot and root
biomass (Table 2). Comparatively lower δ13C signatures (i.e. more negative or less positive) were observed in soil C, especially at the lower site, reflecting a small but significant incorporation of new plant photosynthate-C into the soil ma-trix. The larger background soil C at the lower the site (Ta-ble 2) possibly diluted the incoming δ13C from plants and may explain the observed lower13C enrichment of the soil C of the lower site compared to that of the upper site (Table 3). The data was presented as δ13C enrichment (1δ13C ‰) rel-ative to pre-pulse labeling (control) samples to correct for initial δ13C differences between sites at each labeling event. Shoot biomass showed the highest δ13C enrichment, fol-lowed by root biomass and soil organic C. Enrichment of soil and root biomass was generally greater at the upper site compared to the lower site after the pulse labeling in June. Within the lower site, June labeling resulted in lesser δ13C
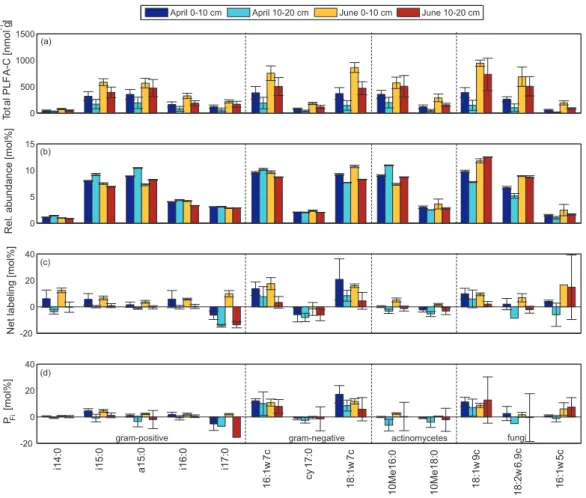
0 500 1000 1500 Tot alPLF A-C[nmolg -1 ] 0 5 10 15 Rel.abundance [mol%] -20 0 20 40 Netlabeling[mol%] -20 0 20 40 PFi [mol%]
i14:0 i15:0 a15:0 i16:0 i17:0
16:1 w 7c cy 17:0 18:1 w 7c 10Me16:0 10Me18:0 18:1 w 9c 18:2 w 6,9c 16:1 w 5c
April 0-10 cm April 10-20 cm June 0-10 cm June 10-20 cm
gram-positive gram-negative actinomycetes fungi (a)
(b)
(c)
(d)
Fig. 5. The abundance of total PLFA-C in nmol g−1soil (a), relative abundance of total PLFA-C (MCi) in mol% (b), net labeling or δ13C
enrichment during labeling (1δ13C ‰) (c), and relative abundance of root-derived PLFA-C (PFi) in mol% (d) in different PLFA biomarkers found in the surface soils (0–10 cm) and subsurface soils (10–20 cm) at the lower site in April and June 2007.
enrichment of root biomass and soil C at 0–10 cm depth, than that in April. These differences were expected to be indica-tive of differences in microbial performance between sites and time periods, however, could have been shaded by differ-ences in solar radiation and other climatic conditions prevail-ing durprevail-ing the different labelprevail-ing events that control plant pho-tosynthetic CO2 uptake and consequently the rhizodeposit-C transport in the rhizosphere soil. Therefore, δ13C-PLFA comparisons were performed after expressing the data as pro-portions of rhizosphere-derived PLFA-C of each individual fatty acid to that of the total rhizosphere-derived PLFA-C (PFi).
4.2.2 Spatio-temporal patterns of microbial community structure
Spatio-temporal patterns of PLFA profiles in the lower and upper sites are illustrated in Fig. 5 and Fig. 6. The compar-isons between sites, time periods and soil depths were done by ANOVA. The concentration of individual PLFAs
([PLFA-C], nmol C g−1soil), representing the abundance of the dif-ferent microbial cell membrane biomarker lipids, was signif-icantly higher (p<0.05) in the lower site than in the upper site throughout the soil profile (0–20˙cm) (Fig. 6a), indicating higher microbial abundance at the lower site. A general de-cline of [PLFA-C] occurred with depth at both sites showing decreasing microbial abundance with depth. A significantly greater [PLFA-C] of most of the individual PLFAs occurred in June compared to April at the lower site (Fig. 5a) at both depths indicating greater microbial abundance in June than April (except for i14:0, a15:0, 16:1ω7c and 10Me16:0 at 10– 20 cm depth).
The relative abundance of individual PLFAs (MCi%)
represent the relative proportions of the individual PLFA-C ([PLFA-PLFA-C]i) to total PLFA-C abundance (Fig. 5b and Fig. 6b). Gram positive bacteria associated fatty acids were relatively more abundant (higher MCi%) in the wetter lower
site and in the subsurface soils of the drier upper site than in the upper surface horizon. Among all gram positive PLFAs, this pattern was significant (p<0.05) for i15:0, i16:0 and
0 500 1000 1500 Tot alPLF A-C[nmolg -1 ] 0 5 10 15 Rel.abundance [mol%] 0 500 1000 1500 Netlabeling[mol%] -20 0 20 40 P Fi [mol%]
i14:0 i15:0 a15:0 i16:0 i17:0
16:1 w 7c cy 17:0 18:1 w 7c 10Me16:0 10Me18:0 18:1 w 9c 18:2 w 6,9c 16:1 w 5c
Lower 0-10 cm Lower 10-20 cm Upper 0-10 cm Upper 10-20 cm
gram-positive gram-negative actinomycetes fungi (a)
(b)
(c)
(d)
Fig. 6. The abundance of total PLFA-C in nmol g−1soil (a), relative abundance of total PLFA-C (MCi) in mol% (b), net labeling or δ13C
enrichment during labeling (1δ13C ‰) (c), and relative abundance of root-derived PLFA-C (PFi) in mol% (d) in different PLFA biomarkers found in the surface soils (0–10 cm) and subsurface soils (10–20 cm) at the lower site and the upper site in June 2007.
i17:0. A general decline of gram positive PLFAs was found with increasing soil depth, with a significant decline found in April for most of the gram positive PLFAs (i15:0, a15:0, i16:0, i14:0) (p<0.05). The observed higher abundance of gram positive fatty acids in April (significant at 10–20 cm depth p<0.05) compared to that in June in the lower site fur-ther confirms the association of this set of fatty acids with anaerobic conditions which were prevalent in April than in June, as well as in deeper soil depths and in the lower site compared to the upper site.
The relative abundance of gram negative PLFAs was greater in the surface layer of the upper site than in that of the lower site (Fig. 5b and Fig. 6b). In the lower site, greater gram negative relative abundance occurred in the sur-face samples of June than in the sursur-face samples of April. Among all gram negative bacterial PLFAs, 18:1ω7c was sig-nificantly more relatively abundant in the upper site than in the lower site (p<0.01) and cy17:0 and 18:1ω7c showed a significant decline in relative abundance with depth at both sites (p<0.05).
Relative abundance of actinomycetes (10Me16:0) was sig-nificantly greater (p<0.05) at the lower site than in the up-per site and generally increased with depth (Fig. 5b and Fig. 6b). The relative abundance of arbuscular mycorrhizal fungal PLFA (16:1ω5c) was significantly greater (p<0.05) in the upper site than in the lower site, while saprotrophic fungi associated PLFAs; 18:1ω9c and 18:2ω6,9c were sig-nificantly higher (p<0.05) at the lower site. Fungal PLFAs were relatively high in the surface horizon compared to the subsurface layers. This decline with depth was significant for 18:1ω9c and 18:2ω6,9c fungal PLFAs in April at the lower site (p<0.05) and for AMF (16:1ω5c) in June at the upper site (p<0.05). However, the relative abundance of fungal PLFA 18:1ω9c was higher at the subsurface layer than at the surface layer in June at the lower site. Relative abundance of fungal PLFAs were generally higher in June compared to that in April at the lower site, while 18:1ω9c and 18:2ω6,9c fun-gal PLFAs in the surface layer were significantly relatively higher in June compared to that in April (Fig. 5b and Fig. 6b).
Several other studies reported significant changes of soil microbial communities with depth or in response to land-use, management or environmental change based on PLFA analysis (Sundh et al., 1997; Fierer et al., 2003; Bossio et al., 2006). Similar patterns of relatively more abundant gram positive bacterial PLFAs in wetlands with prevailing anaer-obic conditions as compared to more aerated agricultural fields, and decreased relative abundance of gram negative bacterial PLFAs with soil depth in both wetland and agricul-tural land uses were reported by Bossio et al. (2006). In ad-dition, Bossio et al. (2006) suggested a higher growth rate of aerobic bacteria dominated communities compared to anaer-obic bacteria dominated communities, based on PLFA in-dices. This study concluded that the aeration condition was the predominant determinant of abundances of the microbial communities across soil types and land usage. Sundh et al. (1997) found increasing gram positive bacteria and actino-mycetes with depth (based on total PLFA concentrations), in dry sites of peatlands, and suggested that these shifts could be due to anaerobic conditions imposed by ground water depth. Other studies have detected relatively large actino-mycetes populations in sub surface soils influenced by anaer-obic conditions (Federle et al., 1986) and in podzol profiles under coniferous forest (Fritze et al., 2000). In our study, anaerobic conditions were expected in the lower site due to a year round shallow ground water depth compared to the up-per site, where average ground water depth is below 30 cm (Figs. 2 and 3). Gram positive bacteria are known to have a strong association with anaerobic conditions (Sundh et al., 1997) prevailing in wetlands and with increasing soil depth, while gram negative bacteria are known to associate with well aerated conditions (Ponder and Tadros, 2002). There-fore, the observed shift from greater gram negative domi-nance at the well aerated soil surface in the upper site to greater gram positive dominance in the lower site and deeper depth, is consistent with the prevailing anaerobic conditions in the lower site and with increasing depth. Similar to our findings, Fierer et al. (2003) reported that gram positive bac-teria as well as actinomycetes tended to increase in relative abundance with increasing soil depth, while that of gram neg-ative bacteria and fungi were higher at the soil surface com-pared to that in the lower surface in two semi arid soil pro-files. They concluded that the vertical distribution of these microbial groups can largely be attributed to the decline in carbon availability with soil depth. Griffiths et al. (1999) have shown that higher rates of C addition to soil will raise the proportions of fungi and gram negative bacteria in the microbial community and lower the proportions of actino-mycetes and gram positive bacteria. In this study, greater biomass turnover occurred at the lower site than in the upper site (Table 3) indicating a higher C addition. Fungal PLFAs (18:1ω9c and 18:2ω6,9c) were higher at the lower site fol-lowing the C availability. However, gram negative bacteria and AMF shifts were opposite than the predictions based on C availability, i.e. gram negative bacteria and AMF was
higher at the surface layers of the upper site compared to that in the lower site. At the lower site, the aboveground plant biomass production was higher in June than in April, resulting in a temporal shift in the relative abundance of fun-gal PLFAs, i.e. greater relative abundance of funfun-gal PLFAs in June than in April reflecting the greater C availability in June.
The advantage of the pulse labeling approach in combi-nation with13C PLFA analysis is the identification of those microbial communities that are actively assimilating newly produced rhizosphere-C. The two13C-PLFA based indices used in this study, i.e. net labeling (1δ13C ‰) and PFi, dis-tinguish the PLFAs associated with the metabolically-active proportion of the microbial communities from the PLFAs as-sociated with the inactive or slow active proportion of the microbial communities with regard to rhizosphere C cycling (Denef et al., 2007). Net labeling was significantly higher in the surface layers of the upper site than that in the lower site (p<0.05) in most of the individual PLFAs except for i14:0 and cy17:0 (Fig. 5c and Fig. 6c). A general decline of net labeling occurred with depth. In June, net labeling was gen-erally higher than in April at the surface layers of the lower site, except for i16:0, 18:1ω7c and 18:1ω9c. These differ-ences could be due to differdiffer-ences in microbial functioning between sites, depths and time periods, however, could be shadowed by differences in photosynthetic efficiency result-ing in differences in13C input to the soil.
The relative abundance of root derived PLFA-C (PFi), which corrects for any differences in photosynthetic effi-ciency and was used as a measure for the active root-C as-similating portion of the microbial community structure, was generally greater at the surface layers compared to that in the subsurface at both sites except for 10Me16:0, 10Me18:0, and 18:1ω9c (Fig. 5d and Fig. 6d). In general PFiwas higher in gram negative and fungal PLFAs at both sites than other groups confirming their relatively greater and rapid involve-ment in rhizosphere C cycling than the less active and slower growing gram positive bacteria and actinomycete communi-ties at both sites. Rather than a uniform pattern of PFiof all PLFAs in both sites and periods, PFi of different microbial groups shifted differently between sites and time periods. For example, PFiof gram negative bacteria was generally greater in the surface layer of the upper site than that in the lower site while PFiof of gram positive bacteria was higher in the sur-face horizon of the lower site compared to that in the upper site. Gram negative PFi was generally higher in April than in June (except cy17:0) at the lower site, while gram posi-tive PFiin the upper surface showed no prominent difference between April and June. Both gram negative and gram posi-tive PFigenerally decreased with depth. Among them, i14:0, i15:0 and i16:0 showed a significant decrease with depth at the lower site (p<0.05), while i15:0, i16:0 and i17:0 sig-nificantly decreased with depth at the upper site (p<0.05). Significantly higher PFi(p<0.01) was observed with actino-mycetes at the lower site surface horizon compared to that in
the upper site. At the lower site, actinomycetes (10Me 16:0) PFi significantly increased with depth (p<0.05) and signif-icantly greater PFi was found for 10Me16:0 and 10Me18:0 (p<0.05) in June than in April. PFiof fungal PLFAs was not prominently different between two sites in the surface layer, while PFi of 18:2ω6,9c and 18:1ω9c in the subsurface layer of the lower site was greater than that in the subsurface layer of the upper site. AMF showed higher PFi in June than in April at the lower site, while the other two fungal PLFAs showed the opposite pattern between April and June. PFiof 18:1ω9c showed a significant decline with depth (p<0.05) in lower April and upper June respectively. An increase of PFi with depth was observed for 18:1ω9c and AMF fungal PLFAs at lower June.
None of the previous studies on 13CO2 pulse labeling based PLFA analysis, used PFi as an indicator to assess the proportion of those microbial communities that are actively assimilating root derived C in the rhizosphere. However, PFi has been successfully used by Williams et al. (2006) as an indicator to assess the active microbial communities assimi-lating 13C-labeled residue-derived C in rhizosphere by δ13C enriched straw addition under field conditions. Also a lim-ited number of previous studies used13CO2pulse labeling based PLFA analysis to assess the active microbial communi-ties in root-derived C cycling in the rhizosphere (Butler et al., 2003; Treonis et al., 2004; Denef et al., 2007; Lu et al., 2007). Butler et al. (2003) pulse labeled rye grass in laboratory mi-crocosms and found maximum labeling in the fungal PLFA 18:2ω6,9c in rhizosphere soils. Treonis et al. (2004) found greater net labeling of gram negative and fungal PLFAs than gram positive PLFAs at surface soil layer (10 cm) in up-land grassup-land fields. Denef et al. (2007) assessed microbial community dynamics based on the proportional net labeling of individual PLFAs compared to that of a universal PLFA (i.e. 16:0) and found a rapid transfer of newly produced rhi-zosphere C to fungal PLFAs compared to bacterial PLFAs in the surface layers (7.5 cm) of grassland soils. Based on cal-culated net labeling in an in situ pulse labeling study of rice plants, Lu et al. (2007) reported that gram negative and fungi were most actively assimilating root-derived C in the rhizo-sphere, whereas gram positive microorganisms became rela-tively more important in the soil layer below the root zone. Our PFiresults indicating a relatively greater active propor-tion of gram negative and fungal PLFAs in the rhizosphere at both sites are in consistent with the results of Butler et al. (2003); Denef et al. (2007); Lu et al. (2007). In agreement with Lu et al. (2007), we found greater active proportion of gram negative bacteria in the surface layer at the upper site compared to that in the subsurface layer. However, gram pos-itive activity was depleted with depth in contrast to Lu et al. (2007).
The PFi of gram positive bacteria and actinomycetes at both sites was very low despite the observed higher rela-tive abundances, indicating that more metabolically-inacrela-tive gram positive bacteria and actinomycetes were abundant in
the rhizosphere soils at these sites or that these microbial communities were more dependent on other C resources such as soil organic C than newly produced-root derived C. PFiof gram negative bacteria and fungal PLFA 18:1ω9c and AMF at both sites and fungal PLFA 18:2ω6,9c at the upper site were not substantially declined in relation to their relative abundances, suggesting that these microbial groups are more dependent on rhizodeposit-C as a C source for their growth. PFi of 18:2ω6,9c was rather low at the lower site despite its high relative abundance indicating, a preference of non-arbuscular mycorrhizal fungi for other C sources than new rhizodeposit-C at the lower site.
4.3 Linking microbial community structure to hydrological changes and vegetation composition
The observed shift from greater gram negative dominance at the well aerated soil surface in the drier upper site to greater gram positive dominance in the wetter lower site, is consis-tent with the patterns observed in other soil profiles (Sundh et al., 1997; Fierer et al., 2003; Bossio et al., 2006). However the underlying causes of these shifts were interpreted differ-ently. Fierer et al. (2003) concluded that availability of C resources and not anaerobiosis was the underlying cause of these patterns while Bossio et al. (2006) concluded that aera-tion condiaera-tions, and not C availability per se were responsible for changes of microbial community structure. Hydrological changes are the key factors influencing aeration conditions of wetland soils (Davidsson et al., 1997). Anaerobic condi-tions can be expected in the lower site, due to inundation dur-ing winter months and a shallow ground water depth (GWD) throughout the year. In addition, the clayey soil texture in the lower site enhanced the water logged anaerobic condition of these soils. In the surface layer of the upper site, more aero-bic conditions can prevail, due to the sandy loam texture of the soil and deep GWD, which never rises 30 cm underneath the soil surface. Monthly average GWD (over 2 years) in lower left and lower middle sampling points was 8.8 cm in April and that in June was 21.6 cm. In upper left and upper middle sampling points the monthly average GWD in June was 83.3 cm and was significantly higher (p<0.01) than cor-responding June GWD value in the lower site. The relation-ship between ground water depth vs. the relative abundance (MC%) of several microbial groups; gram positive, gram negative, actinomycetes and fungi (saprotrophic and AMF) was determined by linear regression. The relative abundance of a microbial group was calculated by summation of the rel-ative abundances of individual PLFAs within the microbial group. Several groups showed significant relationships with GWD. The relative abundance of the gram negative bacteria at the surface layer significantly decreased with increasing GWD (p<0.05, R2=0.46), while the relative abundance of the gram positive bacteria in the surface layer was positively affected by increasing GWD (p<0.05, R2=0.40). The Ratio of the relative abundance of the gram negative bacteria over
that of the gram positive bacteria (Gn/Gp) in the surface soils showed a significant negative relationship with the increas-ing GWD (p<0.05, R2=0.73). Actinomycetes were greatly increased with increasing GWD at the surface (p<0.01,
R2=0.95) and at the subsurface (p<0.01, R2=0.60) (Fig. 7). These results suggest that anaerobic conditions imposed by incresaing GWD favor the abundance of gram positive bac-teria and actinomycetes while gram negative bacbac-teria prefer the aerobic surface layers where ground water is deep.
Soils in the lower site consisted of significantly greater (p<0.01) organic C content compared to the upper site (Ta-ble 2). Within the lower site, organic C increased from April to June at the surface layers, while this increment was not sig-nificant at the subsurface. Linear regression functions were obtained between the organic C content vs. the relative abun-dance of several dominant microbial groups. None of the bacterial communities showed significant relationships with soil organic C. However, the relative abundance of fungi at the subsurface soils significantly increased with increasing soil organic C (p<0.05, R2=0.74), indicating their depen-dence on soil organic C resources at depth. Greater biomass growth rate of Caricetum gracilis at the lower site than
Ar-rhenatheretum elatioris at the upper site could have caused
greater soil organic C available in the lower site, explain-ing the unexpected larger abundance of saprotrophic fungal communities, which are aerobic (Mentzer et al., 2006) at the more anaerobic lower sites. Caricetum gracilis in the lower site was also associated with slow growing anaerobic bacte-rial communities, whereas Arrhenatheretum elatioris at the upper site was associated with fast growing aerobic bacterial communities in the surface soils. However, rather than the C availability, low C substrate quality, i.e. “low decompos-ability” in vegetated wetlands found to control the microbial community structure; (i.e. decrease the relative abundance of aerobic fast growing bacterial communities) (Bossio et al., 2006). We therefore expected a greater decomposability of Arrhenatheretum elatioris litter than Caricetum gracilis. Lower C/N ratios (16.2) found for the shoot samples of
Ar-rhenatheretum elatioris than for the shoot samples of Carice-tum gracilis (21.7) support this hypothesis. However, more
research is needed on decomposition rates in line with SIP-PLFA analysis to determine the effects of vegetation compo-sition on soil microbial community structure.
5 Conclusions
The objective of the study was to investigate the effects of hy-drology and vegetation composition on soil microbial com-munity structural differences. The study site is characterized by a hydrological gradient, with superficial ground water lev-els at the depression and deeper ground water depth at the upper site. This hydrological gradient resulted in two differ-ent vegetation communities along the hydrological gradidiffer-ent;
Caricetum gracilis at the depression and Arrhenatheretum
y = -0.01x + 0.78 R2 = 0.99 y = 0.05x + 12.25 R2 = 0.99 0 2 4 6 8 10 12 14 -90 -80 -70 -60 -50 -40 -30 -20 -10 0 Monthly av. GWD R e . a b u n d a n c e ( m o l% ) Gn/Gp Actinomycetes
Fig. 7. Linear regression of monthly average ground water depth
(GWD, cm) (over two years) vs. relative abundance of actino-mycetes and Gn/Gp (ratio between the relative abundances of gram negative bacteria and gram positive bacteria).
elatioris at the drier upper site. The effect of hydrology and
vegetation composition on soil microbial community struc-tures was investigated using SIP-PLFA technique. SIP-PLFA analysis showed greater relative abundance of aerobic gram negative communities in the surface layer of the upper site than that of the lower site, while the wetter lower site and the deeper soil layers were inhabited by gram positive bacterial communities. Despite their large abundance, the metaboli-cally active proportion of gram positive bacterial and actino-mycetes communities was less at both sites, suggesting their slow assimilation of root-derived C or dependence on other soil organic C sources. However, gram negative bacteria and fungi (18:1ω9c and AMF) showed greater active involve-ment in assimilation of root-derived C at both sites. Ground water depth showed a significant effect on the relative abun-dance of several microbial communities. Relative abunabun-dance of gram negative bacteria significantly decreased with in-creasing GWD while the relative abundance of gram posi-tive bacteria and actinomycetes at the surface layer increased with increasing GWD, suggesting that anaerobic conditions imposed by increasing GWD favor the abundance of gram positive bacteria and actinomycetes while gram negative bac-teria prefers the aerobic surface layers where ground water is deep.
Acknowledgements. The authors wish to thank the special research
fund (BOF) of Gent University and to the Fond voor Wetenschap-pelijk Onderzoek – Vlaanderen (FWO-Vlaanderen). D. Loete is greatly acknowledged for ecohydrological monitoring and help with the pulse labeling, J. Vermeulen and K. Van Nieuland are acknowledged for 13C-PLFA analysis.
References
Anupam, B.: Mycorrhizae in wetlands: a review, Int. J. For. Man-age., 4, 34–40, 2003.
Battaglia, L. L. and Collins, B. S.: Linking hydroperiod and vege-tation response in Carolina bay wetlands, Plant Ecol., 184, 173– 185, 2006.
Bardgett, R. D. and Shine, A.: Linkages between plant litter diver-sity, soil microbial biomass and ecosystem function in temperate grasslands, Soil Biol. Biochem., 31, 317–321, 1999.
Boon, P. I., Virtue, P., and Nichols, P. D.: Microbial consortia in wetland sediments: a biomarker analysis of the effects of hy-drological regime, vegetation and season on benthic microorgan-isms, Mar. Freshwater Res., 47, 27–41, 1996.
Borga, P., Nilsson, M., and Tunlid, A.: Bacterial communities in peat in relation to botanical composition as revealed by phos-pholipid fatty acid analysis, Soil Biol. Biochem., 26, 841–848, 1994.
Boschker, H. T. S. and Middleburg, J. J.: Stable Isotopes and biomarkers in microbial ecology, FEMS Microbial Ecol., 40, 85– 95, 2002.
Boschker, H. T. S., Nold, S .C., Wellsbury, P., Bos, D., de Graaf, W., Pel, R., Parkers, R. J., and Cappenberg, T. E.: Direct linking of microbial populations to specific biogeochemical processes by C-13-labeling of biomarkers, Nature, 392, 801–805, 1998. Bossio, D. A., Fleck, J. A., Scow, K. M., and Fuji, R.: Alteration
of microbial communities and water quality in restored wetlands, Soil Biol. Biochem., 38, 1223–1233, 2006.
Bossio, D. A., Scow, K. M., Gunapala, N., and Graham K. J.: De-terminants of soil microbial communities: effects of agricultural management, season, and soil type on phospholipid fatty acid profiles, Microb. Ecol., 36, 1–12, 1998.
Butler, J. L., Williams, M. A., Bottomley, P. J., and Myrold, D. D.: Microbial community dynamics associated with rhizosphere carbon flow, Appl. Environ. Microbiol., 69, 6793–6800, 2003. Coles, J. R. P. and Yavitt, J. B.: Linking below ground carbon
allo-cation to anaerobic CH4and CO2production in a forested peat land, New York State, Geomicrobiol. J, 21, 445–455, 2004. Colmer, T. D.: Long-distance transport of gases in plants: a
per-spective on internal aeration and radial oxygen loss from roots, Plant. Cell. Environ., 26, 17–36, 2003.
Davidsson, T. E., Stepanauskas, R., and Leonardson, L.: Verti-cal patterns in nitrogen transformations during infiltration in two wetland soils, Appl. Environ. Microbiol., 63, 3648–3656, 1997. Dawson, T. E., Mambelli, S., Plamboeck, A. H., Templer, P. H., and
Tu, K. P.: Stable Isotopes in plant ecology, Ann. Rev. Ecol. Syst., 33, 507–559, 2002.
Denef K., Bubenheim, H., Lenhart, K., Vermeulen, J., Van Cleem-put, O., Boeckx, P., and Muller, C.: Community shifts and carbon translocation within metabolically-active rhizosphere microor-ganisms in grasslands under elevated CO2, Biogeosciences, 4, 1–11, 2007,
http://www.biogeosciences.net/4/1/2007/.
Devito, K. J. and Hill, A. R.: Sulfate mobilization and pore wa-ter chemistry in relation to ground wawa-ter hydrology and summer drought in two conifer swamps on the Canadian Shield, Water Air Soil Pollut., 113, 97–114, 1999.
Drijber, R. A., Doran, J. W., Parkhurst, A. M., and Lyon, D. J.: Changes in soil microbial community structure with tillage under long-term wheat-fallow management, Soil. Biol. Biochem., 32,
1419–1430, 2000.
Drissner, D., Wermbter, N., Niklaus, P. A., and Kandeler, E.: Nine years of enriched CO2changes the function and structural diver-sity of soil microorganisms in a grassland, Eur. J. Soil Sci., 58, 260–269, 2007.
Ellenberg, H., Weber, H. E., D¨ull, R., Wirth, V., Werner, W., and Paulissen, D.: Zeigerwerte von Pflanzen in Mitteleuropa, 2nd edition: verbesserte und erweiterte Auflage, Scripta Geobotan-ica, 18, 1992.
Engel, V., Jobby, E. G., Stieglitz, M., Williams, M., and Jack-son, R. B.: Hydrological consequences of Eucalyptus afforesta-tion in the Argentine Pampas, Water Resour. Res., 41, W10409, doi:10.1029/2004WR003811, 2005.
Federle, T., Dobbins, D., Thornton-Manning, J., and Jones, D.: Mi-crobial biomass, activity, and community structure in subsurface soils, Ground Water, 24, 365–374, 1986.
Fierer, N., Schimel, J. P., and Holden, P. A.: Variations in micro-bial community composition through two soil depth profiles, Soil Biol. Biochem., 35, 167–176, 2003.
Fritze, H., Pietikainen, J., and Pennanen, T.: Distribution of mi-crobial biomass and phospholipid fatty acids in Podzol profiles under coniferous forest, Eur. J. Soil Sci., 51, 565–573, 2000. Frostegard, A., Baath, E., and Tunlid, A.: Shifts in the structure
of soil microbial communities in limed forests as revealed by phospholipid fatty acid analysis, Soil Biol. Biochem., 25, 723– 730, 1993.
Griffiths, B., Ritz, K., Ebblewhite, N., and Dobson, G.: Soil micro-bial community structure: effects of substrate loading rates, Soil Biol. Biochem., 31, 145–153, 1999.
Gutknecht, J. L. M., Goodman, R. M., and Balser, T. C.: Link-ing soil processes and microbial ecology in freshwater wetland ecosystems, Plant Soil, 289, 17–34, 2006.
Halbritter, A. and Mogyorossy, T.: Phospholipid fatty acid (PLFA) analysis of rhizosphere bacterial communities in a peat soil, Agrokemia et Talajtan, 51, 123–128, 2002.
Hill, M. O.: TWINSPAN – a FORTRAN program for arranging multi-variate data in an ordered two-way table by classification of the individuals and attributes, Cornell University, Ithaca, New York, 19, 1979.
Hume, N. P., Fleming, M. S., and Horne, A. J.: Denitrification po-tential and carbon quality of four aquatic plants in wetland mi-crocosms, Soil. Sci. Soc. Am. J., 66, 1706–1712, 2002. Ingham, E. R. and Wilson, M. V.: The mycorrhizal colonization of
six wetland plant species at sites differing in land use history, Mycorrhiza, 9, 233–235, 1999.
Kennedy, A. C.: Rhizosphere, in: Principals and Applications of Soil Microbiology, edited by: Sylvia, D. M., Hartel, P. G., Fuhrman, J. J., and Zuberer, Z. A., Pearson Prentice, Hall pub-lishing, Upper Saddle River, NJ, 309–407, 2005.
Leyer, I.: Predicting plant species’ responses to river regulation: the role of water level fluctuations, J. Appl. Ecol., 42, 239–250, 2005.
Londo, G.: Decimal scale for releves of permanent quadrats, Vege-tatio, 782, 61–64, 1976.
Lu, Y., Abraham, W. R., and Conrad, R.: Spatial variation of active microbiota in the rice rhizosphere revealed by in situ stable iso-tope probing of phospholipid fatty acids, Environ. Microbiol., 9, 474–481, 2007.
concept of hydric soils, in: Wetland soils, edited by: Richardson, J. L. and Vepraskas, M. J., Lewis, New York, 19–34, 2001. Mentzer, J. L., Goodman, R., and Balser, T. C.: Microbial seasonal
response to hydrologic and fertilization treatments in a simulated wet prairie, Plant Soil, 284, 85–100, 2006.
Olsson, P. A. and Johnson, N. C.: Tracking carbon from the atmo-sphere to the rhizoatmo-sphere, Ecol. Lett., 8, 1264–1270, 2005. Peters, J., Wieme, V., Boeckx, P., Samson, R., Godoy, R., Oyarz´un,
C., and Verhoest, N.: Ecohydrological monitoring in natural and managed ecosystems in Southern Chile, Gayana Bot´anica (Chilean journal), 62, 120–129, 2006.
Ponder, F. and Tadros, M.: Phospholipid fatty acids in forest soil four years after organic matter removal and soil compaction, Appl. Soil Ecol., 19, 173–182, 2002.
Prosser, J. I., Rangel-Castro, J. I., and Killham, K.: Studying plant-microbe interactions using stable isotope technologies, Curr. Opin. Biotechnol., 17, 98–102, 2006.
Qiu, S. and McComb, A. J.: Drying-induced stimulation of ammo-nium release and nitrification in reflooded lake sediment, Mar. Freshwater Res., 47, 531–536, 1996.
Schamin´ee, J. H. J, Stortelder, A. H. F., and Weeda, E. J.: De vege-tatie van Nederland, Deel 3: Plantengemeeschappen van graslan-den, zomen en droge heigraslan-den, Opulus press, Uppsala, 356, 1996 (in Dutch).
Schamin´ee, J. H. J., Stortelder, A. H. F., and Westhoff, V.: De veg-etatie van Nederland. Deel 2: Plantengemeeschappen van wa-teren, moerassen en natte heiden, Opulus press, Upsala, 1995 (in Dutch).
Schilling, K. E.: Water table fluctuations under three riparian land covers, Iowa (USA), Hydrol. Processes, 21, 2415–2424, 2007. Smith, M. S. and Tiedje, J. M.: Phases of denitrification
follow-ing oxygen depletion in soil, Soil Biol. Biochem., 11, 261–267, 1979.
Steer, J. and Harris, J. A.: Shifts in the microbial community in rhi-zosphere and non-rhirhi-zosphere soils during the growth of Agrostis
stolonifera, Soil Biol. Biochem., 32, 869–878, 2000.
Sundh, I., Nilsson, M., and Borga, P.: Variation in microbial com-munity structure in two boreal peat lands as determined by anal-ysis of phospholipids fatty acid profiles, Appl. Environ. Micro-biol., 63, 1476–1482, 1997.
Treonis, A. M., Ostle, N. J., Stott, A. W., Primrose, R., Graystone, S. J., and Ineson, P.: Identification of groups of metabolically-active rhizosphere microorganisms by stable isotope probing of PLFAs, Soil Biol. Biochem., 36, 533–537, 2004.
Van der Hoek, D. and Sykora, K. V.: Fen-meadow succession in relation to spatial and temporal differences in hydrological and soil conditions, Appl. Vegetation Sci., 9, 185–194, 2006. Venterink, H. O., Davidsson, T. E., Kiehl, K., and Leonardson, L.:
Impact of drying and re-wetting on N, P and K dynamics in a wetland soil, Plant Soil, 243, 119–130, 2002.
Vestal, J. R. and White, D. C.: Lipid analysis in microbial ecology quantitative approaches to the study of microbial communities, Bioscience, 29, 535–541, 1989.
Waldrop, M. P., and Firestone, M. K.: Microbial community uti-lization of recalcitrant and simple carbon compounds: impact of oak-woodland plant communities, Oecologia, 138, 275–284, 2004.
Wetzel, P. R. and VanderValk, A. G.: Vesicular-arbuscular mycor-rhizae in prairie pothole wetland vegetation in Iowa and North Dakota, Can. J. Bot., 74, 883–890, 1996.
White, D. C., Davis, W. M., Nickels, J. S., King, J. D., and Bobbie, R. J.: Determination of the sedimentary microbial biomass by extractable lipid phosphate, Oecologia, 40, 51–62, 1979. White, W. N.: A method of estimating ground water supplies based
on discharge by plants and evaporation from soil, United States, Geological Survey, Water-Supply Paper, 659A, 1932.
Williams, M. A., Myrold, D. D., and Bottomley, P. J.: Carbon flow from13C-labeled straw and root residues into the phospholipid fatty acid of a soil microbial community under field conditions, Soil Biol. Biochem., 38, 759–768, 2006.
Zelles, L.: Phospholipid fatty acid profiles in selected members of soil microbial communities, Chemosphere, 35, 275–294, 1997.
![Table 1. Cross-correlations between ground water depth changes and precipitation for different time lags [h] after the rainfall event.](https://thumb-eu.123doks.com/thumbv2/123doknet/14772910.592235/7.892.75.426.144.513/table-cross-correlations-ground-changes-precipitation-different-rainfall.webp)
![Table 3. Monthly data on biomass [gm −2 ] and leaf area [m 2 m −2 ] at the lower and the upper site.](https://thumb-eu.123doks.com/thumbv2/123doknet/14772910.592235/9.892.231.665.477.740/table-monthly-data-biomass-leaf-area-lower-upper.webp)