HAL Id: hal-00295883
https://hal.archives-ouvertes.fr/hal-00295883
Submitted on 24 Apr 2006
HAL is a multi-disciplinary open access
archive for the deposit and dissemination of
sci-entific research documents, whether they are
pub-lished or not. The documents may come from
teaching and research institutions in France or
abroad, or from public or private research centers.
L’archive ouverte pluridisciplinaire HAL, est
destinée au dépôt et à la diffusion de documents
scientifiques de niveau recherche, publiés ou non,
émanant des établissements d’enseignement et de
recherche français ou étrangers, des laboratoires
publics ou privés.
basin due to the interaction of the gap winds with the
synoptic flow
B. de Foy, A. Clappier, L. T. Molina, M. J. Molina
To cite this version:
B. de Foy, A. Clappier, L. T. Molina, M. J. Molina. Distinct wind convergence patterns in the Mexico
City basin due to the interaction of the gap winds with the synoptic flow. Atmospheric Chemistry
and Physics, European Geosciences Union, 2006, 6 (5), pp.1249-1265. �hal-00295883�
www.atmos-chem-phys.net/6/1249/2006/ © Author(s) 2006. This work is licensed under a Creative Commons License.
Chemistry
and Physics
Distinct wind convergence patterns in the Mexico City basin due to
the interaction of the gap winds with the synoptic flow
B. de Foy1,*, A. Clappier2, L. T. Molina1,*, and M. J. Molina1
1Department of Earth, Atmospheric and Planetary Sciences, Massachusetts Institute of Technology, USA 2Air and Soil Pollution Laboratory, Swiss Federal Institute of Technology, Lausanne (EPFL), Switzerland *now at: Molina Center for Energy and the Environment (MCE2), La Jolla, CA 92037, USA
Received: 7 October 2005 – Published in Atmos. Chem. Phys. Discuss.: 1 November 2005 Revised: 8 February 2006 – Accepted: 21 February 2006 – Published: 24 April 2006
Abstract. Mexico City lies in a high altitude basin where air quality and pollutant fate is strongly influenced by local winds. The combination of high terrain with weak synop-tic forcing leads to weak and variable winds with complex circulation patterns. A gap wind entering the basin in the af-ternoon leads to very different wind convergence lines over the city depending on the meteorological conditions. Surface and upper-air meteorological observations are analysed dur-ing the MCMA-2003 field campaign to establish the meteo-rological conditions and obtain an index of the strength and timing of the gap wind. A mesoscale meteorological model (MM5) is used in combination with high-resolution satellite data for the land surface parameters and soil moisture maps derived from diurnal ground temperature range. A simple method to map the lines of wind convergence both in the basin and on the regional scale is used to show the different convergence patterns according to episode types. The gap wind is found to occur on most days of the campaign and is the result of a temperature gradient across the southern basin rim which is very similar from day to day. Momentum mix-ing from winds aloft into the surface layer is much more vari-able and can determine both the strength of the flow and the pattern of the convergence zones. Northerly flows aloft lead to a weak jet with an east-west convergence line that pro-gresses northwards in the late afternoon and early evening. Westerlies aloft lead to both stronger gap flows due to chan-nelling and winds over the southern and western basin rim. This results in a north-south convergence line through the middle of the basin starting in the early afternoon. Improved understanding of basin meteorology will lead to better air quality forecasts for the city and better understanding of the chemical regimes in the urban atmosphere.
Correspondence to: B. de Foy ([email protected])
1 Introduction
The interaction of a low level jet with regional air flows into the Mexico City basin leads to complex convergence patterns that determine the concentration and fate of air pollutants, with strong associated health effects (Molina and Molina, 2002). The Mexico City Metropolitan Area (MCMA) lies in a dry lake bed at 2240 m altitude surrounded by high moun-tains on three sides. Bossert (1997) modelled the local wind circulation and showed distinct pollution venting patterns de-pending on the interaction of the synoptic and local winds, and in particular on the combination of the Pacific and Gulf coast sea breezes with the mountain winds. Jazcilevich et al. (2003) examine cases of convective transport of pollutants in the basin and the flushing of pollutants through the passage to the southeast.
The IMADA-AVER field campaign (Doran et al., 1998) made extensive meteorological observations in the basin and found large day-to-day variation in the wind patterns. Fast and Zhong (1998) describe in detail some of the wind pat-terns leading to high surface ozone concentrations, including the presence of a convergence zone that moves through the MCMA from south to north. This is due to southerly gap winds forming in a mountain pass in the southeast of the basin near Chalco. As they enter the basin, they encounter the northerly surface winds from the Mexican plateau and sweep through the city transporting air pollutants with them. Whiteman et al. (2000) analyse the heat budget in the basin to highlight the importance of an influx of cool moist air through the Chalco gap. This cooling term is larger than the solar heat flux in the afternoon and is similar to flows described by Kimura and Kuwagata (1993) (see below). Do-ran and Zhong (2000) analyse this gap flow in terms of the heat balance on the regional scale and across the basin rim to find that the jet strength is a function of the thermal forc-ing. A different episode was analysed by Jazcilevich et al. (2005) who found a north–south convergence line forming in the city in January 2001.
Stensrud (1996) reviews the climatological importance of low level jets and their impact on deep convection. While their focus is on the regional scale, they review low level jets induced by terrain effects on smaller scales. They also sug-gest that model simulations of low level jets may serve as a proxy for evaluating the accuracy of the simulated plane-tary boundary layers. Kimura and Kuwagata (1993) study in greater detail the thermal forcing in an elevated basin, lead-ing to low pressures and a strong flow from neighbourlead-ing val-leys over mountain ridges. Optimum conditions are a basin less than 100 km and mountain ranges slightly lower than the mixing height. Banta and Cotton (1981) analysed the struc-ture of the local wind systems in a broad mountain basin and found that in addition to night-time drainage and day-time up-slope flows, there were afternoon winds due to down-mixing of momentum aloft into the boundary layer. Both of these studies are particularly relevant to the Mexico City basin as it is of the order of 100 km wide and has high mixing heights that reach into the tropospheric free flow.
A number of recent field campaigns have taken place in mountain valleys and basins. The Vertical Transport and Mixing (VTMX, Doran et al., 2002) field campaign stud-ied the meteorological processes in Salt Lake city in Oc-tober 2000. Banta et al. (2004) found that cold drainage flows from the surrounding mountains could lead to conver-gence in the basin and vertical motion within a cold stable atmosphere. Rife et al. (2004) looked at the performance of a range of mesoscale meteorological models for the com-plex local flows measured during VTMX. They found that by standard verification measures, high resolution models did not perform significantly better than the regional mod-els. This was traced to the high fraction of spectral power in the sub-diurnal range which the models cannot simulate exactly. Nevertheless, the high resolution models did sim-ulate the fine flow features more realistically. Accounting for the spectral power range of the observations suggests that the high resolution models do perform better. Mexico City has the potential for similar model validation issues given the weak and variable surface winds and the possibility for drainage flows to interact with urban heat island effects.
The Mesoscale Alpine Programme (MAP, Mayr et al., 2004) provided extensive measurements in a gap through the Alps. The aim of the study is to study the interaction of the gap flow with the flow aloft, develop local forecasting methods and improve model verification. Z¨angl et al. (2004) developed the MM5 model to use true horizontal diffusion. This leads to improved simulations of the progression of the Foehn down the valley and its impact on the cold air pool at Lake Constance due in part to the improved modelling of the vertical turbulent mixing. It was also used for Mexico City leading to improved surface wind simulations (de Foy et al., 2006). Liu et al. (2000) describe a different low level jet in Iran where a synoptic surface high leads to a gap wind and an outflow of cold air down valley. The forces determining the strength of the jet are analysed, as is the ability of the model
to represent the flow features.
Kossmann and Fiedler (2000) analysed the diurnal mo-mentum budget of thermally induced slope winds. The bal-ance between the buoyancy and pressure gradient forces with the friction forces was found to determine the strength of the slope flows. These were also found to react to changes of forcing within 120 s. The formation of a mesoscale heat low was described by Kossmann et al. (2002) in an alpine lake basin. This is similar to Kimura and Kuwagata (1993) and leads to an intrusion of cold air into the basin in the late af-ternoon. Regmi et al. (2003) find a similar situation in Kath-mandu, Nepal. Shallow surface influx of cool southwest-erly air from the Indian plateau forms a stable layer beneath northwesterly valley flow. The resulting layers suppress ver-tical mixing and lead to high air pollution events.
The present study is focused on the meteorological episodes occurring during the MCMA-2003 field campaign (de Foy et al., 2005) which took place from 1 April to 5 May 2003. Three different wind circulation episode types are pro-posed for the duration of the campaign. O3-South are days when ozone is high in the south and a weak late afternoon gap flow forms in the southeast. O3-North days are when the ozone peak is in the north due to the combination of a strong gap flow and winds over the south and west edges of the basin. Cold Surge days are when cold northerlies sweep the basin atmosphere clean.
This paper seeks to build on the analysis of Doran and Zhong (2000) for the wind jets occurring during MCMA-2003, classifying the results according to the three episode types. Convergence zones suggested by Fast and Zhong (1998) are shown explicitly thereby illustrating the interac-tion of synoptic and local scales proposed by Bossert (1997). After describing the observations and model used in Sect. 2, the synoptic conditions during MCMA-2003 will be reviewed in Sect. 3 and the model results will be evaluated in Sect. 4. Sections 5 and 6 will describe the low level jet and the convergence patterns. Section 7 will discuss how the circulation patterns relate to the local and synoptic forcings.
2 Observations and model description
The observations described in de Foy et al. (2005) are used, in particular the surface meteorological observation network and the radiosondes of the Mexican National Weather Ser-vice (Servicio Meteorol´ogico Nacional, SMN) and the moni-toring data from the campaign super-site at the National Cen-tre for Environmental Research and Training (Centro Na-cional de Investigaci´on y Capacitaci´on Ambiental, CENICA) as well as the surface ozone measurements from the Ambient Air Monitoring Network (Red Autom´atica de Monitoreo At-mosf´erico, RAMA). Figure 1 shows the radiosonde and sur-face stations along with geographical reference points. Fig-ure 2 shows the basin topography and the urban area along with the stations in the MCMA. All times in this paper are
Fig. 1. Map of Mexico showing locations of radiosonde obser-vations: Mexico City (GSMN), Manzanillo (MANZ), Acapulco (ACAP), Veracruz (VER) and Brownsville, Texas (BRO). Also shown are the surface stations Ciudad Constitucion (CDCO) and Matamoros (MATA) and the limits of the 3 MM5 domains.
stated as local time, per field campaign guidelines, which is Central Daylight savings Time (CDT=UTC–5 h).
The basin circulation is simulated using the Pennsylvania State University/National Center for Atmospheric Research Mesoscale Model (MM5, Grell et al., 1995) version 3.7.2 us-ing three nested grids with one-way nestus-ing. The grid resolu-tion used is 36, 12 and 3 km, with 40×50, 55×64 and 61×61 grid cells for domains 1, 2 and 3, respectively. The simula-tion procedure is described in detail in de Foy et al. (2006) and makes use of high resolution satellite remote sensing for initialising the land surface parameters. Nine simulations of 4 days duration were used to cover the entire field campaign, with the following two modifications. The initialisation pe-riod was increased from 18 to 42 h, yielding better results for the first simulation day.
The previous modelling study used soil moisture values from the Air Force Weather Agency’s (AFWA) Agricultural Meteorology modelling system (AGRMET). Due to an un-verified moistening of the soil in the AGRMET model half-way during the campaign, the soil moisture field was aver-aged over the first part of the month and held constant in time during the episode. This method fails to capture the variation of the soil moisture during the field campaign. Furthermore, satellite soil moisture products were not found to be satis-factory for estimating the surface heat budget (de Foy et al., 2006).
An alternative was therefore obtained by relating the soil moisture to the diurnal range of the skin temperature mea-sured by MODIS on the AQUA platform. 8-day average val-ues were used for the months of March–May 2003. An em-pirical relationship was devised to produce fields of similar magnitudes to those from AGRMET. Soil temperature differ-ences in the range of 15 K to 45 K were linearly mapped to
Fig. 2. Map of the Mexico City basin with topography repre-sented by shading and the MCMA urban area (as of 1995) in beige. Campaign supersite was at CENICA. Circles denote SMN stations. Black line A-B is the cross-section used in Fig. 8.
soil moistures of 0.18 to 0.08 m3/m3for the surface layer, 0.22 to 0.12 for layer 2 and 3 and 0.3 to 0.2 for layer 4 (i.e. points with the largest diurnal temperature range have the driest soils). Gaussian smoothing was applied to all the fields; one pass for layers 1 and 2, two passes for layers 3 and 4. Initial fields were interpolated in time from the 8-day estimated values, and were held constant in the MM5 simu-lation.
This scheme improves the simulation of the diurnal tem-perature range and also captures some soil moisture varia-tion during the campaign. The eight day smoothing on the soil temperature however leads to an under estimation of the soil moisture variability. This could be an important factor in the simulation of the Cold Surge episodes which would merit further analysis.
3 Synoptic conditions
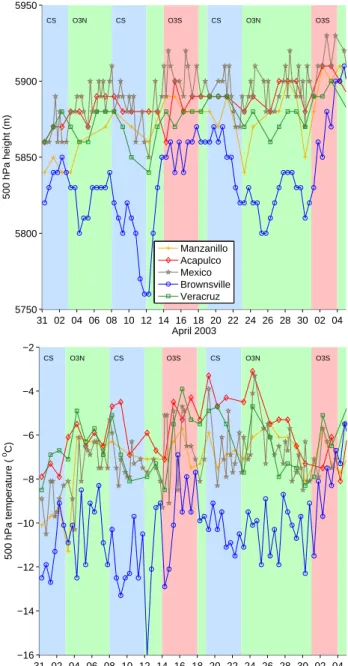
Synoptic weather charts for the 3 episode types were shown in de Foy et al. (2005). Cold Surge episodes are due to a surface high over Texas with a low pressure system aloft. O3-South episodes occur when a anti-cyclone is over Mex-ico and O3-North when low pressure systems move north of the MCMA forcing the sub-tropical jet southward. In or-der to compare all the days of the campaign with the synop-tic charts, Fig. 3 shows the evolution of the 500 hPa height and temperature at radiosonde locations on the coasts and in Mexico City.
31 02 04 06 08 10 12 14 16 18 20 22 24 26 28 30 02 04 5750 5800 5850 5900 5950 April 2003 500 hPa height (m)
CS O3N CS O3S CS O3N O3S
Manzanillo Acapulco Mexico Brownsville Veracruz 31 02 04 06 08 10 12 14 16 18 20 22 24 26 28 30 02 04 −16 −14 −12 −10 −8 −6 −4 −2 April 2003 500 hPa temperature ( oC)
CS O3N CS O3S CS O3N O3S
Fig. 3. 500 hPa height and temperature from radiosonde obser-vations during MCMA-2003. Background shading corresponds to episode types: red for O3-South, green for O3-North and blue for Cold Surge.
The most variability occurs at Brownsville where the high pressure for O3-South days can be clearly seen. O3-North episodes are characterised by a north–south pressure gradient which drives the westerlies aloft and Cold Surge episodes by falling pressure at most of the stations. The temperature at 500 hPa is high and rising for O3-South days, constant with a stronger north–south gradient for O3-North days and decreasing for Cold Surge days.
31 02 04 06 08 10 12 14 16 18 20 22 24 26 28 30 02 04 1000 1005 1010 1015 1020 1025 April 2003
Surface Pressure (hPa)
CS O3N CS O3S CS O3N O3S
Cd. Constitucion (Baja California) Acapulco (Pacific Coast) Matamoros (Gulf Coast North) Veracruz (Gulf Coast)
31 02 04 06 08 10 12 14 16 18 20 22 24 26 28 30 02 04 16 18 20 22 24 26 28 30 April 2003 Surface Temperature ( o C)
CS O3N CS O3S CS O3N O3S
Fig. 4. Daily averaged surface pressure and temperature on the Pa-cific and Gulf coasts from SMN stations. Shading as for Fig. 3.
Daily average surface pressure and temperature are shown in Fig. 4. High surface pressures at Matamoros and Ver-acruz during Cold Surge episodes force cold northerly sur-face flows. O3-South days have minimal pressure gradients between the two coasts with increasing surface temperatures. On O3-North days the pressure on the Gulf coast tends to be lower than on the Pacific Coast.
From this, it is clear that the three Cold Surge episodes fol-low the pattern described by Schultz et al. (1998), with vary-ing intensities. Both the O3-South and O3-North episodes, with the exception of the transition periods, have well defined
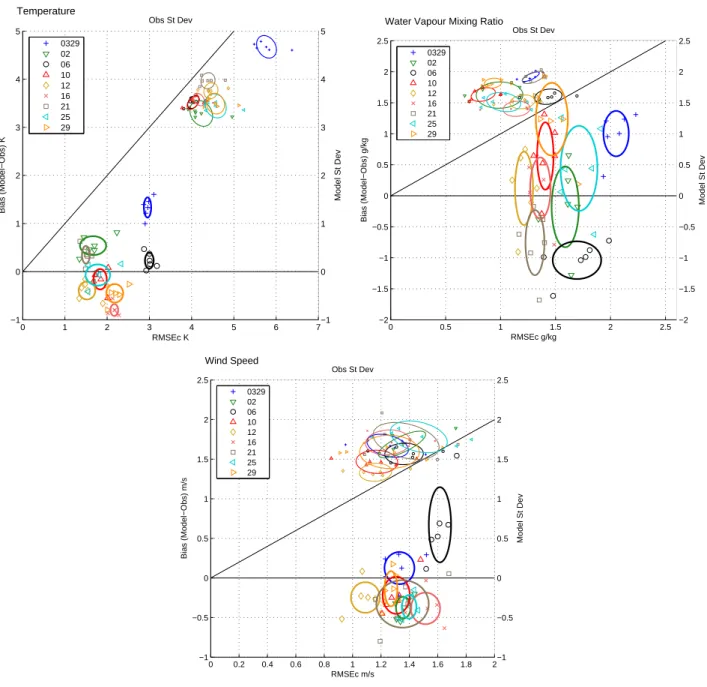
−1 0 1 2 3 4 5 Obs St Dev Model St Dev 0 1 2 3 4 5 6 7 −1 0 1 2 3 4 5 RMSEc K Bias (Model−Obs) K Temperature 0329 02 06 10 12 16 21 25 29 −2 −1.5 −1 −0.5 0 0.5 1 1.5 2 2.5 Obs St Dev Model St Dev 0 0.5 1 1.5 2 2.5 −2 −1.5 −1 −0.5 0 0.5 1 1.5 2 2.5 RMSEc g/kg Bias (Model−Obs) g/kg
Water Vapour Mixing Ratio
0329 02 06 10 12 16 21 25 29 −1 −0.5 0 0.5 1 1.5 2 2.5 Obs St Dev Model St Dev 0 0.2 0.4 0.6 0.8 1 1.2 1.4 1.6 1.8 2 −1 −0.5 0 0.5 1 1.5 2 2.5 RMSEc m/s Bias (Model−Obs) m/s Wind Speed 0329 02 06 10 12 16 21 25 29
Fig. 5. Statistics diagrams for temperature, water vapour mixing ratio and wind speed comparing the fine MM5 domain with the 5 SMN surface stations in the basin. Larger symbols show the model bias versus the centred root mean square error (RMSEc), which should be as small as possible. Smaller symbols show the model standard deviation versus that of the observations, which should be of similar magnitude. Statistics are calculated for each 4 day simulation period for each station. Periods are labelled by starting day (April except for 0329), and ellipses are drawn to show the average performance and the spread in agreement between the stations for each episode.
synoptic characteristics that vary little across the different days.
4 Model results
Model statistics were calculated for each simulation for the SMN weather stations in the basin. Figure 5 shows statis-tics diagrams described in de Foy et al. (2006) for
tempera-ture, humidity and wind speed. The bias is plotted versus the centred root mean square error (RMSEc) for each station for each simulation run. The model standard deviation is then plotted versus the observed standard deviation. All four vari-ables plotted have the same units as the observed variable. In order to compare the different simulation runs, ellipses are drawn centred on the average of the statistics with radii cal-culated from the standard deviation of the results from the
individual stations. In this way, the diagram conveys both the overall accuracy of the model and the variability in model agreement at different stations. Ideally, both the bias and the RMSEc are low with corresponding ellipses close to the ori-gin. The model standard deviation should be similar to that of the observations, with corresponding ellipses along the y=x line.
Temperature biases are less than 1 K with the exception of the first Cold Surge episode. RMSEc are within 2 K with the exception of the first two Cold Surge episodes. For water mixing ratio, the biases are within 1.5 g/kg and the RMSEc in the range of 1 to 2 g/kg, although the first Cold Surge episode is too moist and has larger errors than the other sim-ulations. Wind speed performance is similar for all the simu-lations with the exception of the second Cold Surge episode when the winds are too strong and the errors largest. Overall, this suggests that the simulation performance for the whole campaign is similar to that of the O3-South episode described in de Foy et al. (2006). The Cold Surge episodes are an ex-ception to this however and would need further refinement. Sensitivity tests were not carried out for these episodes al-though candidate factors would be the cloud parameterisa-tion and the soil moisture field. The latter can have moist spikes lasting just a few days following heavy rainfall, an ef-fect that was disabled in the current simulations by holding the soil moisture field constant over the individual simulation periods.
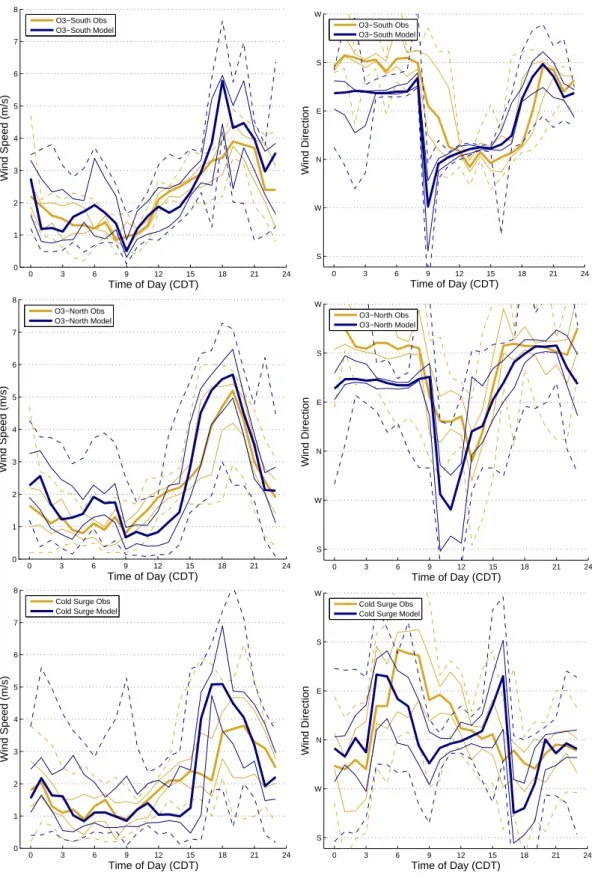
Continuous time series for the field campaign were ob-tained by collating the results from the nine simulations. Fig-ure 6 shows the comparison of the diurnal variation of the observed and simulated winds at CENICA by episode. For each episode, the median is shown by a bold line, the inter-quartile range by thin lines and the total range by dotted lines. The winds are southeasterly and below 2 m/s in the early morning turning to northerly during the day and then back to southerly in the range of 4 to 6 m/s by sunrise. This shows that the main features are well represented by the model. The main differences are in the timing and level of the afternoon wind peak. O3-South events have the correct wind speed in-crease in the morning, but O3-North and Cold Surge have a delayed increase into the mid-afternoon. The peak itself is well simulated for O3-North events. Both O3-South and Cold Surge have similar peaks in the model even though they are weaker in reality.
In terms of wind directions, the main feature of the obser-vations is the afternoon wind shift which takes place around 15:00 for O3-North, around 18:00 for O3-South and around 04:00 for Cold Surge. The model simulates this although the difference between O3-North and O3-South is not as stark. In the morning there is a sharp transition from southeasterly to northwesterly whereas the observations show a more grad-ual turning via the east. In the afternoon there is a large vari-ability in the Cold Surge winds with a southerly component which the observations do not show. The Cold Surge episode type contains the greatest variation of circulation patterns and
in addition is the least well simulated of the three types. Nev-ertheless, the afternoon wind direction is better simulated at stations further from the Chalco gap in the southeast, both in the city and to the east of the basin at Chapingo. This suggests that the poor performance is due to inaccuracies in simulating the gap flow intensity.
5 Gap winds
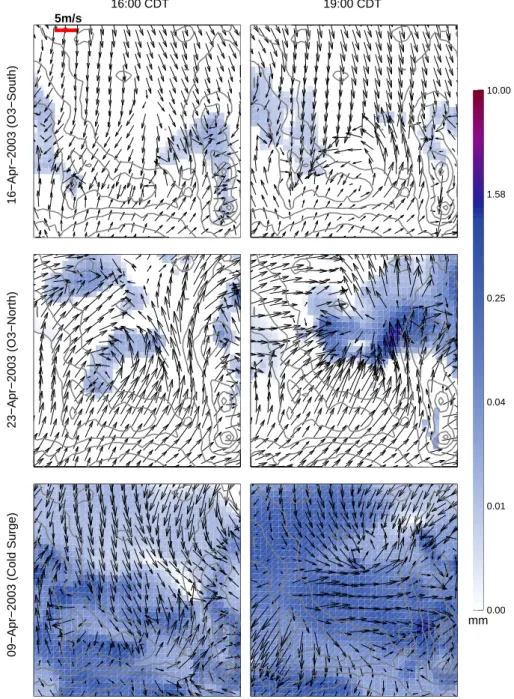
The wind shifts observed at CENICA are part of the gap wind that passes through the Chalco passage, as described in Whiteman et al. (2000). Figure 7 shows the surface winds in the basin for selected days of the three episode types at 16:00 and 19:00, along with total cloud water predicted by the model.
O3-South days such as 16 April have weaker northerly winds and a gap flow influencing the southeast of the city in the early evening. 23 April, an O3-North day, has a gap flow that is already influencing the whole eastern half of the basin by 16:00. It meets with westerly winds coming over the basin rim leading to a convergence line in the middle of the city. This is pushed further north as the afternoon progresses. On this particular day, the convergence leads to strong con-vection and cloud formation causing highly variable surface winds. On 9 April, a Cold Surge day, strong northerly flows are forced into the gap and are followed by a shift to westerly winds throughout the basin.
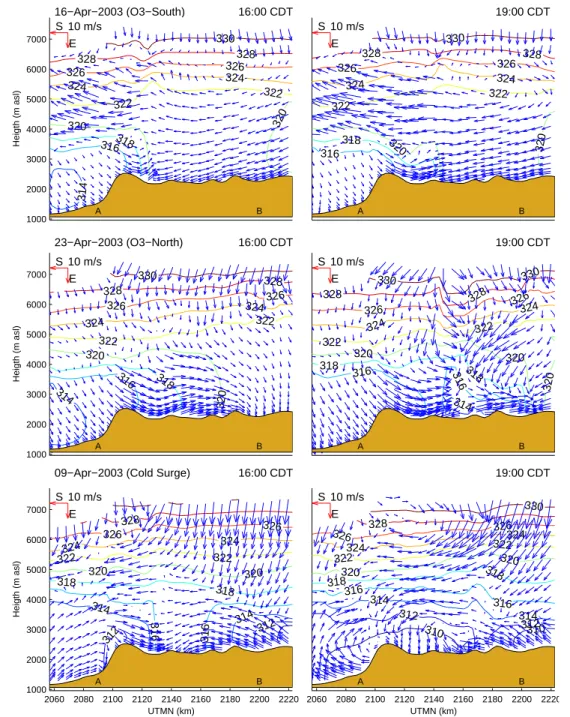
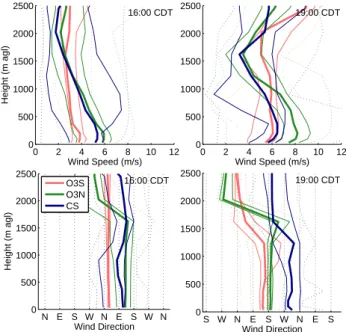
North–south cross-sections through the Chalco gap in Fig. 8 show the horizontal winds and contours of potential temperature. Vertical profiles of wind speed and direction are shown at Tenango del Aire (TEDA) in the Chalco passage, in Fig. 9 and at CENICA in Fig. 10 for 16:00 and 19:00 CDT. These are boxplots segregated by episode type using profiles from every day of the campaign. The extent of the jet heights can be clearly seen, with jet heights estimated visually as the height of the wind minimum.
On O3-South days the winds aloft are weaker. Wester-lies above 6000 m give way to northerly winds below. A strong temperature gradient forms between the basin and the Cuautla valley to the south. The associated pressure dif-ference drives a low level jet less than 1000 m thick which brings in cold air. The jet progresses gradually through the basin turning to easterly as it meets the northerly flow in the basin.
The profiles at TEDA show that for O3-South events the jet is purely southerly and quite thick at 16:00 with a wind min-imum at 1500 ma.g.l.. At 19:00, the median profile shows a decrease in heights to approximately 500 m. At CENICA, there is no effect of the gap winds at 16:00 for O3-South episodes but the winds have shifted by 19:00. The influx of southerly air leads to a layer of increased winds up to around 1500 m.
On O3-North days, the winds aloft are still from the west, but stronger and with no layer of northerlies below. The
0 3 6 9 12 15 18 21 24 0 1 2 3 4 5 6 7 8 Time of Day (CDT) Wind Speed (m/s) O3−South Obs O3−South Model 0 3 6 9 12 15 18 21 24 S W N E S W Time of Day (CDT) Wind Direction O3−South Obs O3−South Model 0 3 6 9 12 15 18 21 24 0 1 2 3 4 5 6 7 8 Time of Day (CDT) Wind Speed (m/s) O3−North Obs O3−North Model 0 3 6 9 12 15 18 21 24 S W N E S W Time of Day (CDT) Wind Direction O3−North Obs O3−North Model 0 3 6 9 12 15 18 21 24 0 1 2 3 4 5 6 7 8 Time of Day (CDT) Wind Speed (m/s)
Cold Surge Obs Cold Surge Model
0 3 6 9 12 15 18 21 24 S W N E S W Time of Day (CDT) Wind Direction
Cold Surge Obs Cold Surge Model
Fig. 6. Comparison of observed and simulated diurnal variation of wind speed (left) and direction (right) at CENICA by episode type: O3-South (top), O3-North (middle), Cold Surge (bottom). Thick line indicates median values, thin lines show the 25 and 75 percentile and dotted lines show minimum and maximum data range.
16−Apr−2003 (O3−South)
23−Apr−2003 (O3−North)
09−Apr−2003 (Cold Surge)
16:00 CDT 19:00 CDT 5m/s 0.00 0.01 0.04 0.25 1.58 10.00 mm
Fig. 7. Horizontal surface (10 m) wind vectors in the Mexico City basin for 16 April (O3-South), 19 April (O3-North) and 9 April (Cold Surge) at 16:00 and 19:00 CDT. Model output with alternate vectors shown only, contour lines of terrain elevation (500 m interval). Shading represents millimetres of cloud water (note log colour scale).
potential temperature difference between the basin and the valley to the south, at 6 K, is the same as 16 April. The low level jet however is much stronger and deeper. By 16:00 it is more than 1000 m thick and extends all the way to the north-ern edge of the basin. By 19:00, horizontal convergence of winds leads to strong convective activity and the formation of cumulus clouds in the north of the basin.
The profiles at TEDA are similar to the O3-South events for 16:00, but the jet is markedly stronger at 19:00 with a
depth of 1500 m. At CENICA, the winds have already shifted at 16:00 with maximum speeds at the surface. By 19:00 there is a well defined jet flow below 1500 m.
Cold Surge days have strong westerly winds aloft with northeasterlies entering the basin from the Gulf coast. At 16:00 the model simulates a limited low level jet which meets the moist Gulf air leading to westerly winds into the early evening. The model simulates a similar vertical structure of the gap flow at TEDA and CENI as for O3-North episodes.
16−Apr−2003 (O3−South)
23−Apr−2003 (O3−North)
09−Apr−2003 (Cold Surge)
16:00 CDT 16:00 CDT 16:00 CDT 19:00 CDT 19:00 CDT 19:00 CDT 1000 2000 3000 4000 5000 6000 7000 314 316318 320 320 322 322 324 324 326 326 328 328 330 10 m/s E S A B Heigth (m asl) 316 318 320 320 322 322 324 324 326 326 328 328 330 10 m/s E S A B 1000 2000 3000 4000 5000 6000 7000 314 316 318 320 320 322 322 324 324 326 326 328 328 330 10 m/s E S A B Heigth (m asl) 314 316 316 318 318 320 320 320 322 322 324 324 326 326 328 328 330 330 10 m/s E S A B 2060 2080 2100 2120 2140 2160 2180 2200 2220 1000 2000 3000 4000 5000 6000 7000 312 312 314 314 316 316 318 318 320 320 322324 322 324 326 326 328 10 m/s E S A B UTMN (km) Heigth (m asl) 2060 2080 2100 2120 2140 2160 2180 2200 2220 310 310 312 312 314 314 316 316 318 318 320 320 322 322 324 324 326 328 326 330 10 m/s E S A B UTMN (km)
Fig. 8. Vertical cross-section through the Chalco gap and the east side of the basin (line A-B, Fig. 2). Horizontal winds and potential temperature contours (K) depicted for the same times as Fig. 7. Arrows pointing left are westerlies (going East), those pointing down are northerlies (going south, out of the page).
By 19:00, the situation has changed markedly however with westerly winds in the surface layer. There is a jet pattern in the vertical profile of velocity at CENICA, but none at TEDA.
6 Wind convergence
6.1 Convergence patterns from model simulations
Convergence zones form in the basin at the interface between southerly gap winds and northerly plateau flows. On the re-gional scale, convergence zones are also formed due to the opposite flows from the sea breezes of the Pacific Ocean and of the Gulf of Mexico. These can be diagnosed by looking
0 2 4 6 8 10 12 0 500 1000 1500 2000 2500 Wind Speed (m/s) Height (m agl) 16:00 CDT 0 2 4 6 8 10 12 0 500 1000 1500 2000 2500 Wind Speed (m/s) 19:00 CDT N E S W N E S 0 500 1000 1500 2000 2500 Wind Direction Height (m agl) 16:00 CDT O3S O3N CS N E S W N E S W N 0 500 1000 1500 2000 2500 Wind Direction 19:00 CDT
Fig. 9. Profiles of wind speed and direction from model results at Tenango del Aire (TEDA) in the Chalco passage for 16:00 and 19:00 CDT. Boxplots of all the profiles segregated by episode types are shown, bold lines indicates the median, thin lines the 25 and 75 percentile and dotted lines the data range.
0 2 4 6 8 10 12 0 500 1000 1500 2000 2500 Wind Speed (m/s) Height (m agl) 16:00 CDT 0 2 4 6 8 10 12 0 500 1000 1500 2000 2500 Wind Speed (m/s) 19:00 CDT N E S W N E S W N 0 500 1000 1500 2000 2500 Wind Direction Height (m agl) 16:00 CDT O3S O3N CS S W N E S W N E S 0 500 1000 1500 2000 2500 Wind Direction 19:00 CDT
Fig. 10. Profiles of wind speed and direction from model results at CENICA for 16:00 and 19:00 CDT, as for Fig. 9.
at vertical velocities above a given threshold, chosen to be 0.5 m/s. For each column, the values at sigma level 17 were chosen as this corresponds to roughly 1300 m above ground
level. With mixing heights ranging from 1000 m to 4000 m, this level corresponds to a height were vertical velocities due to local convergence are well established.
Figures 11 to 13 show such plots for the medium and fine domains for the three episode types, with convergence zones for a whole day coloured by time of day. O3-South days have weak synoptic forcing and a much clearer signature of terrain induced flow. On the regional scale, convergence lines are formed from the meeting of the sea breezes from the Pacific and the Gulf. These are relatively stationary moving south-west only slightly during the afternoon. The combination of terrain blocking from the east-west range of volcanoes form-ing the south of the basin and the flat Mexican plateau to the north of the basin leads to an advance of the convergence line which now passes through the MCMA. On the basin scale, the low level jet coming from the Chalco passage forms a very clear signature, starting at 15:00 and sweeping through the whole city by 22:00. Similar jets can be seen through Toluca to the west and past Puebla on the east, due to the same terrain elevation differential between the plateaus to the north and the low-lying Cuautla valley to the south.
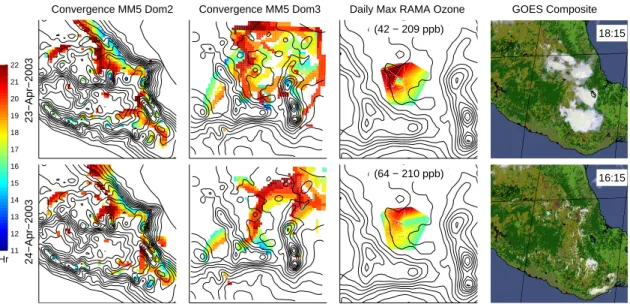
On O3-North days, the regional convergence line is now at the edge of the Sierra Madre Oriental, due to the strength of the westerlies. In the basin, the low level jet is much stronger and leads to an early convergence zone that runs north–south through the centre of the city. On 23 April, the meeting point of the gap flow and the winds coming over the basin rim ex-hibits some meandering in the northwest of the basin. In addition, later afternoon convection can be seen as east-west lines across the basin. Cloud formation in the model can be seen in Fig. 7 along the convergence lines. For 24 April however there were no clouds and the convergence line is quite stationary. Three air masses can be seen pushing into the basin: the gap flow from Chalco, the westerlies over the Toluca pass to the west and the flow over the Ajusco moun-tain to the south.
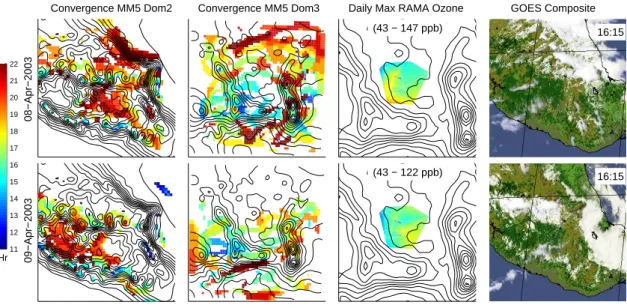
For 8 April, strong cold northerly winds from the Gulf lead to up-slope flows on the edge of the Sierra Madre Oriental. The winds then continue over the Mexican plateau and high-lands meeting in a convergence zone nearer to the Pacific coast. In the basin, the situation is complicated with strong convective activity in the basin and slope flows on the basin edge. On 9 April, drier conditions lead to reduced convec-tion compared with 8 April and a clearer convergence zone along the southwest of the country. In the basin, we now see the convergence lines due to the low level jet radiating from the Chalco passage. There is still substantial cloudiness over the MCMA however as can be seen in both Figs. 7 and 13. These are limited in both time and space however, with late afternoon convergence above the mountains.
6.2 Verification with surface ozone and cloud imagery Verification of the convergence lines is difficult to achieve by comparisons with instantaneous observed winds. Their
15−Apr−2003
16−Apr−2003
Convergence MM5 Dom2 Convergence MM5 Dom3 Daily Max RAMA Ozone GOES Composite
(40 − 146 ppb) 16:15 (10 − 180 ppb) 11 12 13 14 15 16 17 18 19 20 21 22 Hr 16:15
Fig. 11. Convergence lines for O3-South, 15 and 16 April for the medium and fine domain. Each convergence line is coloured by time of day per the colourbar. Surface RAMA ozone concentrations in the basin are shown going from blue to red (highest). GOES cloud imagery for an area similar to the medium domain courtesy of GOES Biomass Burning Monitoring Team, UW-Madison, Cooperative Institute for Meteorological Satellite Studies (CIMSS).
23−Apr−2003
24−Apr−2003
Convergence MM5 Dom2 Convergence MM5 Dom3 Daily Max RAMA Ozone GOES Composite
(42 − 209 ppb) 18:15 (64 − 210 ppb) 11 12 13 14 15 16 17 18 19 20 21 22 Hr 16:15
Fig. 12. Convergence lines, ozone and cloud imagery for O3-North, 23 and 24 April, see Fig. 11.
impact on the basin circulation can be seen however by look-ing at the transport of pollutants and water vapour. The max-imum daily ozone measured by RAMA in the MCMA along with a GOES visible image taken in the afternoon are shown alongside the convergence patterns in Figs. 11 to 13.
O3-South days have high ozone peaks in the southwest, as would be predicted from the convergence patterns. In par-ticular, ozone is higher on 16 April than on 15 April due to the delayed gap flow. The Goes image shows very clearly the low level clouds on the Gulf coast plains due to the sea
breeze. Scattered cloud formation is limited to the high vol-canoes due to the dry prevailing conditions.
On O3-North days the ozone peak is in the northwest of the city, due to the gap flow pushing all the pollutants back through the basin to the northwest. The peaks are equiva-lent for 23 and 24 April, but on the 23 the spatial extent is larger and on the 24 the peak is further to the east. This is in accordance with the convergence lines that are meandering over the northwest on the first day, and oriented towards the northeast with stronger westerlies flushing the basin on the
08−Apr−2003
09−Apr−2003
Convergence MM5 Dom2 Convergence MM5 Dom3 Daily Max RAMA Ozone GOES Composite
(43 − 147 ppb) 16:15 (43 − 122 ppb) 11 12 13 14 15 16 17 18 19 20 21 22 Hr 16:15
Fig. 13. Convergence lines, ozone and cloud imagery for Cold Surge, 8 and 9 April, see Fig. 11.
Table 1. Froude numbers based on model Brunt-V¨ais¨al¨a frequency and representative mean velocity for mountain heights of 1000 m, representing the western ridge and 1500 m representing the volca-noes to the east.
U Nbv λ=2π UNbv Froude No. =λh
m/s s−1 m h=1000 m h=1500 m
0.005 12 500 12.5 8.4
10 0.01 6300 6.3 4.2
0.015 4200 4.2 2.8
second day. There is much less cloudiness on the plains from gulf breezes, but there is convection on the edge of the Sierra Madre Oriental, as suggested by the convergence lines that are very sharply located over the ridge. Afternoon convec-tion in the basin can be clearly see on 23 April, whereas 24 April has clear skies.
Cold Surge days have low ozone levels with maxima in the south of the basin, confirming wind transport to the south. On 8 April, ozone peaks are in the southwest in accordance with early afternoon convergence resulting from northerly flow meeting the Ajusco mountain. On 9 April, the peak is to the southeast which is where a small gap flow is forming ow-ing to the clearer sky conditions on this day. Cloud transport to the eastern flanks of the Sierra Madre Oriental shows the northerly flows, followed by strong convection over the Mex-ican plateau and above the basin once the winds pass over the mountain edge.
7 Discussion
The Froude number determines the impact of complex ter-rain on wind circulation. The Brunt-V¨ais¨al¨a frequency was calculated from model output and found to be in the range of 0.005 to 0.015 s−1over the basin. Taking a mean free ve-locity of 10 m/s as representative of the conditions near the mountain tops, and distances of 1000 and 1500 m as repre-sentative of the mountain ridge heights above basin level on the eastern and western side yielded Froude numbers in the range of 2.8 to 12.5, see Table 1. Because these are always greater than one, the wind flow can be expected to be over the mountain tops with limited mountain waves. The primary ef-fect of the mountains is therefore due more to the generation of up-slope and drainage flows rather than to the disruption of the mean tropospheric flow.
During the IMADA campaign, the jet forming in the Chalco passage was directly measured by a wind profiler. Radiosonde profiles of temperature and humidity were made at 4 locations in the basin and one on the southern basin rim at several times during the day. A low level jet was defined as taking place when winds in the bottom 337 m were above 6 m/s with a 4 m/s reduction below 1000 ma.g.l.. Jets were observed on 20 of the 29 study days and further split into 3 categories based on strength.
The jet strength was then shown to correlate with two dif-ferent temperature difdif-ferentials across the basin. The first was the average temperature difference in the range of 2800 to 3200 m a.s.l. between the Tres Marias site on the south-ern basin rim and the average of 3 radiosondes in the basin at 13:30 CST. The second was the average difference in tem-perature in the range of 2250 to 3150 m a.s.l. between the Mexico City and Acapulco radiosondes at 18:00 CST. Based
on this correlation, it was suggested that thermal forcing is the main cause of the jets.
During MCMA-2003, there were no direct observations of the wind profiles in the Chalco passage and no radiosonde observations from which to get a thermal balance across the basin rim. A wind flow indicator would therefore need to be based on routine surface observations in the basin. Because convergence zones were simulated on most days of the cam-paign, an indicator was sought that would represent the influx of southerly air into the basin for all days of MCMA-2003.
A simple metric was devised based on the southerly com-ponent of velocity in the basin above a threshold of 1 m/s. The excess velocity above the threshold was summed be-tween 12:00 and 24:00 and divided by an average estimated influx time length of 6 hours. The average was then taken over the 5 SMN stations in the basin: GSMN, PIME, ENCB, AERO, TEZO. This yields a number that can be roughly in-terpreted as an excess southerly flow sweeping through the basin and will be referred to as “influx strength”. The aver-age time of the southerly flow was obtained by averaging the time of day weighted by the influx strength for every hour at each station, yielding an “influx time”. It should be noted that Doran and Zhong (2000) ensured that their analysis cov-ered lower level jets through the Chalco passage specifically. The influx indicators are not able to narrow down the anal-ysis in this way and are, of necessity, a broader measure of air movements in the basin. They are nonetheless of direct relevance to air quality studies. The threshold velocity was selected based on the minimum wind speed in the basin, so that the influx strength would represent an excess velocity. Sensitivity analysis showed that the results were not sensi-tive either to the particular choice of threshold speed or to the selection of stations used in the average.
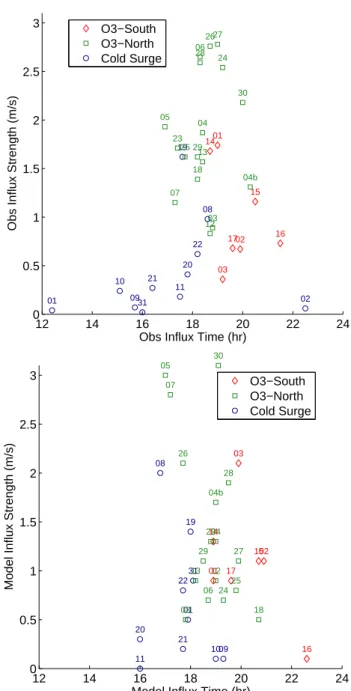
Figure 14 shows the influx strength versus the influx time for the observations and for the model simulations for each day of the campaign. The three episode types are clearly segregated into three separate categories. Weak and early southerly flows for Cold Surge days, weak and later flows for O3-South days and strong flows peaking around 18:00 for O3-North. The model reproduced this pattern although the O3-North days tend to be weaker and the O3-South and Cold Surge days too strong. Individual timing of the southerly flow can be off by up to 3 h or more, but overall the simula-tions are within 1 to 2 h of the observasimula-tions.
A temperature gradient exists between the Mexico City basin and the Cuautla valley to the south. Doran and Zhong (2000) had radiosonde observations of the difference be-tween the basin floor and the southern rim, and found it to vary from −3 to 4 K. In the present study, the average tem-perature difference was calculated between CENICA, which is near the geographic centre of the basin, and Cuautla just to the south of the Chalco passage for the vertical interval from 2250 to 3250 m a.s.l.) at 15:00, as shown in Fig. 15. The sim-ulated values were around 5±1 K and showed less variation than the observations during the IMADA campaign.
12 14 16 18 20 22 24 0 0.5 1 1.5 2 2.5 3 31 01 02 03 04 05 06 07 08 09 10 11 12 13 14 15 16 17 18 19 20 21 22 23 24 25 2627 28 29 30 01 02 03 04b
Obs Influx Time (hr)
Obs Influx Strength (m/s)
O3−South O3−North Cold Surge 12 14 16 18 20 22 24 0 0.5 1 1.5 2 2.5 3 31 01 03 04 05 06 07 08 09 10 11 12 13 14 15 16 17 18 19 20 21 22 23 24 25 26 27 28 29 30 01 02 03 04b
Model Influx Time (hr)
Model Influx Strength (m/s)
O3−South O3−North Cold Surge
Fig. 14. Influx strength versus influx time for observations and sim-ulations, labelled by day. Symbols correspond to episode types (04b is 4 May, others are unambiguously April or May).
This temperature differential can be explained from the fact that the Mexico City basin has surface wind speeds be-low 1 m/s during the early morning leading to very stagnant air masses. Because the basin is at low latitude and high alti-tude, solar heating is intense and develops rapidly after sun-rise, leading to a rapid growth of the boundary layer. The val-ley to the south of the basin, at an elevation of 1000 m a.s.l., is 1200 m below the basin level. The first effect of this is that in the bottom 2000 m layer of the atmosphere there are roughly 1400 kg/m2 of air at CENICA but 1720 kg/m2 at
0 0.5 1 1.5 2 2.5 3 −6 −4 −2 0 2 4 6 01 02 03 05 06 07 08 10 11 12 14 16 17 18 19 21 22 24 25 26 28 29 30 01 02 03
Obs Influx Strength (m/s)
Obs Δ T 19:00 − 07:00 CDT GSMN, 2250−3250 m asl (K) O3−South O3−North Cold Surge 0 0.5 1 1.5 2 2.5 3 1 2 3 4 5 6 7 31 01 02 03 04 05 06 07 08 09 10 11 12 13 14 15 16 17 18 19 20 21 22 23 24 25 26 27 28 29 30 01 02 03 04b
Obs Influx Strength (m/s)
Model Δ T CENICA − Cuautla 15:00, 2250−3250 m asl (K) O3−South O3−North Cold Surge
Fig. 15. Temperature differences in the bottom 1000 m versus influx strength. (a) Temperature difference at GSMN between 19:00 and 07:00 measured by radiosonde. (b) Model temperature differences between CENICA and Cuautla, to the south of the gap at 15:00. Lines of best fit from Table 2 shown.
Cuautla. For equivalent surface heating, this leads to an av-erage diurnal temperature variation at CENICA of 5 K and at Cuautla of 3.5 K. Because this leads to lower mixing heights at Cuautla, the temperature at equivalent heights is higher at CENICA, leading to temperature gradients between CENICA and Cuautla in the 2250 to 3250 m a.s.l. range of around 5 K.
Table 2. Least squares fit (y=mx+c) for correlation of influx strength with temperature gradient across the basin rim and wind direction aloft by episode type, with 95% confidence bound on m and correlation coefficient of the fit.
1T vs. Influx Strength WD vs. Influx Strength
O3-South O3-North O3-South O3-North
m 0.23 −.01 −55 −7
95% bounds on m −0.4, 0.8 −0.5, 0.5 −82, −28 −25, 11
c 5.1 5.3 24 −88
r2 0.16 0.00 0.84 0.05
The other temperature differential used by Doran and Zhong (2000) was between the GSMN and Acapulco sound-ings at 19:00. This later sounding was not available during MCMA-2003. Analysing previous soundings shows how-ever that there is little difference in temperature at that height range between the 07:00 and 19:00 soundings. Furthermore, there is little difference between the Acapulco and Mexico City soundings for this same height range at 07:00. The tem-perature difference between GSMN and Acapulco at 19:00 is therefore a proxy for the heating in the Mexico City basin during the day. Figure 15a plots the influx strength versus the temperature difference in the bottom 1000 m layer above ground level at GSMN between the 07:00 and 19:00 sound-ings. Substantial heating takes place on nearly all of the days. There is a clear difference between the Cold Surge days with small temperature differences and the O3-South days with larger differences. Overall however there is no clear pattern between the influx strength and the temperature difference.
Figure 15b plots the model simulated temperature dif-ference between CENICA and Cuautla versus the influx strength. Table 2 shows the parameters for a linear fit to the data by episode. For O3-South episodes there is a slight pos-itive correlation of temperature gradient and influx strength with an r2of 0.16, but 95% confidence interval so large as to be meaningless. For O3-North days there is no correlation at all.
Because the temperature differentials in the model do not vary very much, it was hypothesised that the wind direction aloft would influence the influx strength. Banta and Cot-ton (1981) describe the influence of this on basin winds in South Park, Colorado. The mixing layer causes momentum exchange between the synoptic flow and the surface layer leading to “afternoon westerlies” in the basin. The influx strength was therefore plotted versus average wind direction at the top of the boundary layer (4250 to 6250 m a.s.l.) for the 07:00 sounding, as shown in Fig. 16. For the 4 cases where the 07:00 sounding was missing, data was taken from the 13:00 or 19:00 sounding depending on availability. An alternative to the wind direction would have been to use the
meridional wind velocity. This gave very similar results al-though the scatter was larger, possibly because the wind di-rection includes some measure of the influence of the zonal flow.
For O3-South days, this shows a clear negative correlation with northerly winds aloft causing weaker influx and wester-lies causing stronger sweeping flows through the basin. The
r2is now 0.84 with 95% confidence bounds both suggesting a negative correlation. For O3-North days there is little vari-ation in the wind direction and a slight negative correlvari-ation with an r2of 0.05. This suggests that the winds aloft and the location of the regional convergence zone will have a pre-dictable impact on the balance between the different flows into the Mexico City basin for certain episodes.
On O3-South days, the regional convergence line passes through the basin starting on the east side and moves to the west side in the afternoon. This leads to air masses from the Mexican plateau entering the basin in the morning giv-ing way to Gulf air as the convergence line moves west. The weak westerlies aloft give way to an intermediate layer of northerly flow. As the basin air heats up relative to sur-rounding air masses, the gap flow from the Cuautla valley enters the basin pushing back the northerlies, with the lo-cation of the convergence line between the two determined by the balance between the momentum down-mixing and the thermally-induced pressure low.
On O3-North days, the regional convergence is to the east of the basin on the edge of the Sierra Madre Oriental. This leads to stronger westerlies aloft and surface northerlies from the Mexican plateau in the morning. In the afternoon, the gap flow coming from the southeast meets with air masses that are pushed over the southern and western edges of the basin rim by the westerlies aloft. There is still a thermal gradient across the basin rim for this episode type, but the gap flow is now strongly influenced by wind channelling through the passes and over the basin rims. The combination of these winds lead to sweeping flows through the basin that flush out the air to the northeast.
Cold Surge days are characterised by high surface pres-sures to the north and strong westerlies aloft. This leads to strong, cold, surface northerlies which are held back early in the day behind the Sierra Madre Oriental and then move through the Mexican plateau leading to regional convergence lines southwest of the basin. In the basin, the northerlies sweep through the MCMA and move south into the Chalco gap. Despite the cold temperatures and increased cloudiness, a weak afternoon low level jet still develops on most days. It does not progress through the basin however, turning west instead at east-west convergence lines. Convection develops along these lines with associated afternoon rainfall.
8.3[t] 0 0.5 1 1.5 2 2.5 3 E SE S SW W NW N NE E 31 01 02 03 04 05 06 07 08 09 10 11 12 13 14 15 16 17 18 19 20 21 22 23 24 25 26 27 28 29 30 01 02 03 04b
Obs Influx Strength (m/s)
Obs Wind Dir GSMN, 07:00, 4250−6250 m asl
O3−South O3−North Cold Surge
Fig. 16. Wind direction at GSMN at 07:00 averaged between 4250 and 6250 m above sea level versus influx strength. Lines of best fit from Table 2 shown.
8 Conclusions
Wind circulation in the Mexico City basin is characterised by a gap wind coming through the mountain pass in the south-east and extending into the basin. This takes place nearly ev-ery day, with varying strength and depth. Doran and Zhong (2000) focussed on distinct low level jets and found them to correlate with the thermal imbalance between the hot air in the basin and the cooler air in the low-lying valley to the south. During the MCMA-2003, this did not vary much from day to day and was found to be a poor predictor of the sweep-ing flows through the basin and the location of the conver-gence zone. Wind direction aloft was shown to be a bet-ter predictor of the influx strength for O3-South days due to the importance of momentum down-mixing in balancing the thermal gradients. However, both temperature gradients and wind directions are very similar for all O3-North days and are therefore not able to account for the influx strength which in these cases results from the combination of the momentum and thermal forces. Identifying determining factors of the strength and timing of the flows will require further analysis of the synoptic conditions and vertical mixing in the basin.
MM5 simulations were carried out for the whole campaign using high resolution satellite remote sensing of the land sur-face. Soil moisture fields were derived from the diurnal range of the ground temperature, leading to a spatially and tempo-rally varying field. Statistically, the model simulations were found to have low biases in surface temperature, humidity and wind speeds and errors in accordance with the episode discussed in de Foy et al. (2006).
Wind convergence patterns over Mexico can be clearly identified by plotting the vertical velocity above a given threshold near the top of the surface layer. Combining these for every hour of the afternoon into a single map shows the development of the convergence zones. The Mexico City basin circulation was shown to depend on the interaction of two convergence zones: those resulting from the sea breezes from the Pacific Ocean and the Gulf of Mexico, and those formed from the interaction of gap winds with northerly day-time flows in the basin. The resulting basin convergence patterns fit into the three episode types proposed in de Foy et al. (2005). O3-South days have a convergence lines radi-ating northwards from the Chalco gap, moving through the basin in the late afternoon and early evening. O3-North days have north–south convergence lines through the middle of the MCMA due to the meeting of the gap flow with surface westerlies over the southern and western edges of the basin. Cold Surge days have east-west convergence line across the basin leading to cumulus convection and rainfall.
Verification of the convergence patterns was made pos-sible by analysing surface ozone patterns in the basin and cloud formation observed by satellite. The spatial distribu-tion of surface ozone can be clearly linked to the locadistribu-tion of the afternoon convergence lines. Cloud patterns act as clear indicators of sea-breeze fronts and moist air movements over the mountains as well as convection lines in the basin. These were shown to correspond to the model simulated conver-gence lines on both the regional and local scale. An improved understanding of the transport processes in the Mexico City basin will improve air quality forecasts in the MCMA and facilitate the evaluation of the regional impact of the MCMA plume. The increased understanding of the chemical regimes of the urban atmosphere will improve the evaluation of pollu-tion control policies and the mitigapollu-tion of health effects suf-fered by the people of the MCMA.
Acknowledgements. The analysis contained in this paper was made
possible by the collaborative efforts of many people involved in field measurements, both during the campaign and over longer periods of time. We are indebted to the staff of CENICA who hosted the cam-paign and would like to thank B. C´ardenas, S. Blanco, A. Sanchez, O. Fentanes, J. Zaragoza, A. P. Ocampo, C. Cruz, C. Aguirre, R. Romo, A. Pino, R. Casta˜neda, R. Rodr´ıguez, P. Escamilla as well as R. Ramos, A. Retama and the operators and analyst personnel of the “Red Autom´atica de Monitoreo Atmosf´erico del Gobierno del Distrito Federal” for their contribution in administering and gather-ing the data used in this manuscript. We are grateful to M. Rosen-gaus, J. L. Razo, J. Olalde and P. Garc´ıa of the Mexican National Meteorological Service for providing the EHCA and Radiosonde data.
MM5 is made publicly available and supported by the Mesoscale and Microscale Meteorology division at the National Center for At-mospheric Research. Their dedication and hard work is gratefully acknowledged. The satellite data used in this study were acquired as part of the NASA’s Earth Science Enterprise. The algorithms were developed by the MODIS Science Teams. The data were processed
by the MODIS Adaptive Processing System (MODAPS) and God-dard Distributed Active Archive Center (DAAC), and are archived and distributed by the Goddard DAAC.
We thank A. Garc´ıa and A. Jazcilevich of the Universidad Nacional Aut´onoma de M´exico, A. Soler and F. Hernandez of the Secretar´ıa del Medio Ambiente, Gobierno del Distrito Federal, M´exico and J. Fast of Pacific Northwest National Laboratory for helpful
discussions. The reviews from two anonymous referees were
particularly helpful in clarifying the discussion and improving the quality of the paper. The financial support from the US National Science Foundation (Award ATM-0511803), the US Department of Energy (Award DE-FG02-05ER63980), the Alliance for Global Sustainability and the Molina Center for Strategic Studies in Energy and the Environment for this work is gratefully acknowledged. Edited by: C. E. Kolb
References
Banta, R. and Cotton, W. R.: An analysis of the structure of local wind systems in a broad mountain basin, J. Appl. Meteorol., 20, 1255–1266, 1981.
Banta, R. M., Darby, L. S., Fast, J. D., Pinto, J. O., Whiteman, C. D., Shaw, W. J., and Orr, B. W.: Nocturnal low-level jet in a mountain basin complex. part I: Evolution and effects on local flows, J. Appl. Meteorol., 43, 1348–1365, 2004.
Bossert, J. E.: An investigation of flow regimes affecting the Mex-ico City region, J. Appl. Meteorol., 36, 119–140, 1997. de Foy, B., Caetano, E., Maga˜na, V., Zit´acuaro, A., C´ardenas, B.,
Retama, A., Ramos, R., Molina, L. T., and Molina, M. J.: Mexico City basin wind circulation during the MCMA-2003 field cam-paign, Atmos. Chem. Phys., 5, 2267–2288, 2005.
de Foy, B., Molina, L. T., and Molina, M. J.: Satellite-derived land surface parameters for mesoscale modelling of the Mexico City basin, Atmos. Chem. Phys., 6, 1315–1330, 2006.
Doran, J. C. and Zhong, S.: Thermally driven gap winds into the Mexico City basin, J. Appl. Meteorol., 39, 1330–1340, 2000. Doran, J. C., Abbott, S., Archuleta, J., Bian, X., Chow, J., Coulter,
R. L., de Wekker, S. F. J., Edgerton, S., Elliott, S., Fernandez, A., Fast, J. D., Hubbe, J. M., King, C., Langley, D., Leach, J., Lee, J. T., Martin, T. J., Martinez, D., Martinez, J. L., Mercado, G., Mora, V., Mulhearn, M., Pena, J. L., Petty, R., Porch, W., Russell, C., Salas, R., Shannon, J. D., Shaw, W. J., Sosa, G., Tellier, L., Templeman, B., Watson, J. G., White, R., Whiteman, C. D., and Wolfe, D.: The IMADA-AVER boundary layer experiment in the Mexico City area, Bull. Amer. Met. Soc., 79, 2497–2508, 1998. Doran, J. C., Fast, J. D., and Horel, J.: The VTMX 2000 campaign,
Bull. Amer. Met. Soc., 83, 537–551, 2002.
Fast, J. D. and Zhong, S. Y.: Meteorological factors associated with inhomogeneous ozone concentrations within the Mexico City basin, J. Geophys. Res.-Atmos., 103, 18 927–18 946, 1998. Grell, G. A., Dudhia, J., and Stauffer, D. R.: A Description of the
Fifth-Generation Penn State/NCAR Mesoscale Model (MM5), Tech. Rep. NCAR/TN-398+STR, NCAR, 1995.
Jazcilevich, A. D., Garc´ıa, A. R., and Ruiz-Suarez, L. G.: A study of air flow patterns affecting pollutant concentrations in the Central Region of Mexico, Atmos. Environ., 37, 183–193, 2003.
Jazcilevich, A. D., Garcia, A. R., and Caetano, E.: Locally induced surface air confluence by complex terrain and its effects on air pollution in the valley of Mexico, Atmos. Environ., 39, 5481– 5489, 2005.
Kimura, F. and Kuwagata, T.: Thermally-induced wind passing from plain to basin over a mountain-range, J. Appl. Meteorol., 32, 1538–1547, 1993.
Kossmann, M. and Fiedler, F.: Diurnal momentum budget analy-sis of thermally induced slope winds, Meteorology Atmospheric Phys., 75, 195–215, 2000.
Kossmann, M., Sturman, A. P., Zawar-Reza, P., McGowan, H. A., Oliphant, A. J., Owens, I. F., and Spronken-Smith, R. A.: Anal-ysis of the wind field and heat budget in an alpine lake basin during summertime fair weather conditions, Meteorol. Atmos. Phys., 81, 27–52, 2002.
Liu, M., Westphal, D. L., Holt, T. R., and Xu, Q.: Numerical sim-ulation of a low-level jet over complex terrain in southern Iran, Mon. Weather Rev., 128, 1309–1327, 2000.
Mayr, G. J., Armi, L., Arnold, S., Banta, R. M., Darby, L. S., Durran, D. D., Flamant, C., Gabersek, S., Gohm, A., Mayr, R., Mobbs, S., Nance, L. B., Vergeiner, I., Vergeiner, J., and Whiteman, C. D.: Gap flow measurements during the Mesoscale Alpine Programme, Meteorol. Atmos. Phys., 86, 99–119, 2004.
Molina, L. T. and Molina, M. J. (Eds.): Air Quality in the Mexico Megacity, Kluwer Academic Publishers, 2002.
Regmi, R. P., Kitada, T., and Kurata, G.: Numerical simulation of late wintertime local flows in Kathmandu valley, Nepal: Implica-tion for air polluImplica-tion transport, J. Appl. Meteorol., 42, 389–403, 2003.
Rife, D. L., Davis, C. A., Liu, Y. B., and Warner, T. T.: Predictability of low-level winds by mesoscale meteorological models, Mon. Wea. Rev., 132, 2553–2569, 2004.
Schultz, D. M., Bracken, W. E., and Bosart, L. F.: Planetary- and synoptic-scale signatures associated with central American cold surges, Mon. Wea. Rev., 126, 5–27, 1998.
Stensrud, D. J.: Importance of low-level jets to climate: a review, J. Climate, 9, 1698–1711, 1996.
Whiteman, C. D., Zhong, S., Bian, X., Fast, J. D., and Doran, J. C.: Boundary layer evolution and regional-scale diurnal circulations over the Mexico Basin and Mexican Plateau, J. Geophys. Res.-Atmos., 105, 10 081–10 102, 2000.
Z¨angl, G., Chimani, B., and H¨aberli, C.: Numerical Simulations of the Foehn in the Rhine Valley on 24 October 1999 (MAP IOP 10), Mon. Wea. Rev., 132, 368–389, 2004.