HAL Id: hal-00301899
https://hal.archives-ouvertes.fr/hal-00301899
Submitted on 2 Nov 2005HAL is a multi-disciplinary open access
archive for the deposit and dissemination of sci-entific research documents, whether they are pub-lished or not. The documents may come from teaching and research institutions in France or abroad, or from public or private research centers.
L’archive ouverte pluridisciplinaire HAL, est destinée au dépôt et à la diffusion de documents scientifiques de niveau recherche, publiés ou non, émanant des établissements d’enseignement et de recherche français ou étrangers, des laboratoires publics ou privés.
Isoprene oxidation products are a significant
atmospheric aerosol component
S. N. Matsunaga, C. Wiedinmyer, A. B. Guenther, J. J. Orlando, T. Karl, D.
W. Toohey, J. P. Greenberg, Y. Kajii
To cite this version:
S. N. Matsunaga, C. Wiedinmyer, A. B. Guenther, J. J. Orlando, T. Karl, et al.. Isoprene oxida-tion products are a significant atmospheric aerosol component. Atmospheric Chemistry and Physics Discussions, European Geosciences Union, 2005, 5 (6), pp.11143-11156. �hal-00301899�
ACPD
5, 11143–11156, 2005 Isoprene oxidation products in the aerosols S. N. Matsunaga et al. Title Page Abstract Introduction Conclusions References Tables Figures J I J I Back CloseFull Screen / Esc
Print Version Interactive Discussion
EGU Atmos. Chem. Phys. Discuss., 5, 11143–11156, 2005
www.atmos-chem-phys.org/acpd/5/11143/ SRef-ID: 1680-7375/acpd/2005-5-11143 European Geosciences Union
Atmospheric Chemistry and Physics Discussions
Isoprene oxidation products are a
significant atmospheric aerosol
component
S. N. Matsunaga1,2, C. Wiedinmyer2, A. B. Guenther2, J. J. Orlando2, T. Karl2, D. W. Toohey3, J. P. Greenberg2, and Y. Kajii1
1
Applied Chemistry Division, Faculty of Engineering, Tokyo Metropolitan University, 1-1 Minami-Ohsawa, Hachioji, Tokyo, 192-0397, Japan
2
Atmospheric Chemistry Division, National Center for Atmospheric Research, 1850 Table Mesa Drive, Boulder, CO 80305, USA
3
Program in Atmospheric and Oceanic Sciences and Program in Environmental Studies, University of Colorado, Stadium 255, 311 UCB, Boulder, CO 80309, USA
Received: 5 September 2005 – Accepted: 19 October 2005 – Published: 2 November 2005 Correspondence to: S. N. Matsunaga ([email protected])
ACPD
5, 11143–11156, 2005 Isoprene oxidation products in the aerosols S. N. Matsunaga et al. Title Page Abstract Introduction Conclusions References Tables Figures J I J I Back CloseFull Screen / Esc
Print Version Interactive Discussion
EGU
Abstract
Glycolaldehyde, hydroxyacetone, and methylglyoxal, which are known isoprene oxida-tion products, were collected during two field experiments using an annular denuder sampling system and compared to a model calculation. The compounds in gas and aerosol phases were determined during both experiments. Global variation and dis-5
tribution of the aerosol mass contribution of the compounds were predicted using the measurements, the box model results, and gas-phase concentrations and humidity simulated by a global 3-D model. Here we report the estimates of a global annual contribution of 35 (10–120) Tg of aerosol organic matter from isoprene.
1. Introduction 10
Isoprene is released in large quantities from the biosphere (Guenther et al., 1995). Due to its high emission rate and reactivity, isoprene is one of the most important hydrocar-bons in the atmosphere and has a substantial impact on tropospheric oxidants (Trainer et al., 1987). It has generally been accepted that isoprene does not contribute to sec-ondary organic aerosol unlike most other biogenic terpenoid compounds (Kavouras et 15
al., 1998). The major oxidation products of isoprene (glycolaldehyde; GA, hydroxyace-tone; HA, and methylglyoxal; MG) have not been considered to be significant aerosol constituents due to their relatively high vapour pressure and the difficulty in measuring these compounds.
2. Experiment 20
Gaseous and particulate water soluble organic compounds (WSOC), including iso-prene oxidation products, were collected during two field experiments using an annular denuder sampling system (ADSS: Gundel et al., 1995; Matsunaga et al., 2004). The experiments were conducted from 9 to 12 July 2003 in Duke Forest, Chapel Hill, NC,
ACPD
5, 11143–11156, 2005 Isoprene oxidation products in the aerosols S. N. Matsunaga et al. Title Page Abstract Introduction Conclusions References Tables Figures J I J I Back CloseFull Screen / Esc
Print Version Interactive Discussion
EGU USA and from 9 to 17 June 2004 in a poplar plantation near Boardman, OR, USA.
Aerosol partition ratios (APRs) of these compounds ([Particle]/([Gas]+[Particle])%) var-ied from 10 to 60%. Concentrations of other volatile organic compounds (VOCs, includ-ing isoprene, methacrolein [MACR] and methyl vinyl ketone [MVK]), oxides of nitrogen (NOx), ozone (O3), light intensity, and meteorological conditions were also measured 5
during the Duke Forest study. Production yields of the oxidation products from iso-prene at Duke Forest were estimated using a chemical box model, the NCAR Master Mechanism (NMM: Bey et al., 1997; Aumont et al., 2000). Global variation and dis-tribution of the aerosol mass condis-tribution from GA, HA, and MG were predicted using the measurements, the box model results, and gas-phase concentrations and humid-10
ity simulated by the global Model for OZone and Related chemical Tracers (MOZART: Horowitz et al., 2003).
2.1. Sampling and analytical procedure
The WSOCs in gas and aerosol phases were collected by the ADSS. The ADSS mainly consists of two multi channel annular denuder tubes and a quartz fiber filter. The 15
denuder tube is followed by the filter and a backup denuder. The inner walls of these denuder tubes are coated with an adsorbent (XAD-7) and O-benzylhydroxylammonium as a derivatization reagent. Gaseous compounds were trapped onto and derivatized on the inner wall of the denuder tube (URG-2000-30×242-3CSS). Particulate compounds went through the tube and were collected on the filter and in the backup denuder. The 20
derivatives were extracted from the denuder tubes by methanol in situ and analyzed with a GC/FID. The WSOCs on the filters were extracted and analyzed in the laboratory. The flow rate for the air sampling was 10 L min−1 and it was controlled by a mass flow controller. Sampling times were about 2 h at daytime and 4 h at night time. Details about the ADSS and analytical technique are described in Matsunaga et al. (2004) and 25
ACPD
5, 11143–11156, 2005 Isoprene oxidation products in the aerosols S. N. Matsunaga et al. Title Page Abstract Introduction Conclusions References Tables Figures J I J I Back CloseFull Screen / Esc
Print Version Interactive Discussion
EGU 2.2. Production of the GA, HA and MG
GA, HA, and MG are second generation isoprene oxidation products that are produced by oxidation of the first generation isoprene oxidation products MACR and MVK (Tu-azon and Atkinson, 1989, 1990; Atkinson, 1990). The relationship between isoprene emission and these products is clearly demonstrated by the results of the Boardman 5
study. Here, the poplar plantation has extremely high isoprene emissions and is sur-rounded by a region of desert shrubland and irrigated crops with relatively low biogenic and anthropogenic hydrocarbon emissions. Air samples were simultaneously collected inside and outside of the plantation. The observed concentrations of GA, HA, and MG were highest at the downwind edge of the plantation and lowest at the upwind edge 10
of the plantation. These results strongly suggest that the measured GA, HA, and MG were derived from the oxidation of isoprene emitted by the plantation’s poplar trees. The observations also indicate that these compounds exist in aerosol phase outside of the tree plantation.
3. Results and discussion 15
3.1. Box model calculation
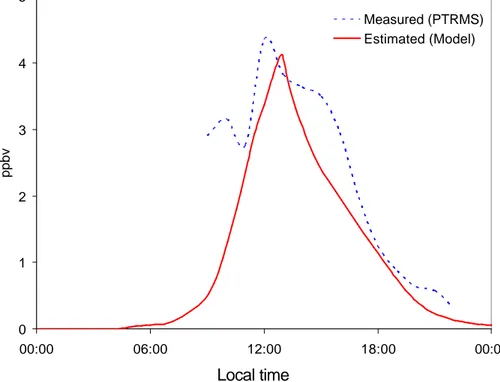
3.1.1. Comparison of the concentration between the model and the measurement Figure 1 presents a comparison of the sum of MACR and MVK concentrations ob-served and simulated for Duke Forest on 10 July 2003. The modelled values were calculated with a zero dimensional chemical reaction model, NMM, which includes 20
detailed chemical reactions of important alkanes, alkenes, and aromatics. The com-parison in Fig. 1 indicates that the NMM box model, which was constrained by the observations of isoprene, NOx and ozone, accurately re-produced the concentration and diurnal variation of MACR and MVK, which are the precursors of GA, HA, and MG.
ACPD
5, 11143–11156, 2005 Isoprene oxidation products in the aerosols S. N. Matsunaga et al. Title Page Abstract Introduction Conclusions References Tables Figures J I J I Back CloseFull Screen / Esc
Print Version Interactive Discussion
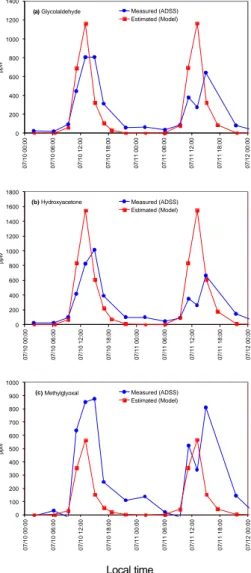
EGU Figure 2a–c shows comparisons of the observed and NMM estimated total
concentra-tions of GA, HA, and MG for the same time period. Estimated concentraconcentra-tions of GA and HA were higher than measured values, probably due to an underestimation of their deposition rates. All of the observed GA and HA at Duke Forest could be explained by isoprene oxidation. GA is also produced by oxidation of methylbutenols; however, 5
methylbutenols were minor constituents at the Duke Forest site. Modelled MG con-centrations were almost half of the measured concon-centrations. This suggests that MG has precursors other than isoprene, which is supported by a previous study (Atkinson, 1989, 2000). Around half of the measured MG is assumed to be derived from isoprene.
3.1.2. Aerosol mass contributions of the GA, HA and MG by the oxidation of isoprene 10
The yields of these compounds (YGA, YHA, and YMG) from isoprene oxidation were estimated with the NMM results (e.g. GA):
YGA = (d[GA]/dt)/(−d[Isoprene]/dt) (1)
Estimates of the contribution of GA, HA, and MG to aerosol mass (aerosol mass con-tribution; AMC) require not only the total chemical yield (calculated with Eq. 1), but 15
also the aerosol partition ratios (APRs) for each compound. The APRs of GA, HA, and MG are determined by the ADSS measurements. The APRs of the WSOCs such as GA, HA, and MG have been found to be highly dependent on relative humidity (RH: Matsunaga et al., 2004). Although Henry’s law constants of these compounds are very large (104–106mol kg−1atm−1), their aerosol partition ratios can not be explained only 20
by Henry’s law. Polymerization and/or other transformation of these compounds in the aerosol phase may support the observed partitioning (Jang and Kamens, 2001). It is most likely that the polymerized WSOC molecules decompose back to their original structure during the analytical process used for this study. In their polymerized form, these compounds could explain part of the humic-like substances that have recently 25
been observed in laboratory experiments investigating the contribution of isoprene ox-idation to secondary organic aerosol composition (Limbeck et al., 2003). Similar
poly-ACPD
5, 11143–11156, 2005 Isoprene oxidation products in the aerosols S. N. Matsunaga et al. Title Page Abstract Introduction Conclusions References Tables Figures J I J I Back CloseFull Screen / Esc
Print Version Interactive Discussion
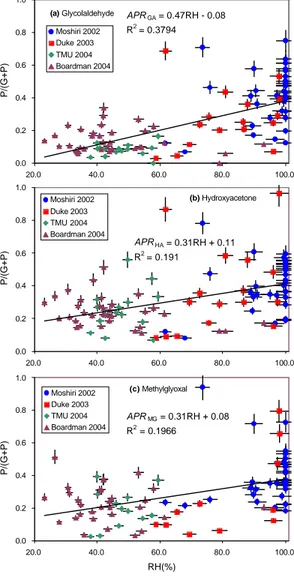
EGU merization by glyoxal has also been observed (Liggio et al., 2005). As seen in Fig. 3a–
c, a linear relationship between the APR and humidity was confirmed by the Duke Forest (this study) and Boardman experiments (this study) and by two previous exper-iments in Japan, although these experexper-iments have been conducted in largely different conditions. The experiments in Japan were conducted at Moshiri, Hokkaido Island in 5
Japan on August, 2002 and at Tokyo Metropolitan University in Hachioji, Tokyo, Japan on May, 2004. These two experiments are described in Matsunaga et al.(2004, 2005), respectively. Empirically obtained equations for each APR are given below:
AP RGA= 0.47RH − 0.08 (2a)
AP RHA= 0.31RH + 0.11 (2b)
10
AP RMG= 0.31RH + 0.08 (2c)
Due to analytical uncertainly and r2values < 1, APRs estimated by the equations are expected to have errors. The errors associated with the APRs (due to the dispersion of the APRs from the regression line and uncertainties in the analytical and measurement procedures) are estimated to be 75% (GA), 62% (HA), and 71% (MG).
15
The aerosol mass contribution (AMC) of the isoprene oxidation products are calcu-lated with the following equation (e.g. GA):
AMCGA = Fisoprene∗ YGA∗ AP RGA (3)
where, AMCGA is the aerosol mass contribution of GA per unit area and time, and
Fisopreneis isoprene flux. The variables YGA and APRGA are non-dimensional.
20
3.2. Global contributions of the oxidation products
To estimate the global AMC from GA, HA, and MG, Eq. (3) was applied using global estimates of isoprene emissions and other controlling variables. The chemical produc-tion yields of GA, HA, and MG for various condiproduc-tions were estimated using the results
ACPD
5, 11143–11156, 2005 Isoprene oxidation products in the aerosols S. N. Matsunaga et al. Title Page Abstract Introduction Conclusions References Tables Figures J I J I Back CloseFull Screen / Esc
Print Version Interactive Discussion
EGU of a sensitivity study with the NMM. The yields were found to be significantly impacted
by changes in the concentrations of NOx, O3, and isoprene. For this study, the NOx, O3, and isoprene were varied in the NMM, and the chemical yields of GA, HA, and MG were simulated. Concentrations of NOx, O3, and isoprene for the model simula-tions ranged from 0.010–5.0, 10–100, and 0.050–4.0 ppbv, respectively. Calculated 5
yields based on the NMM (Eq. 1) of GA, HA, and MG were 0.020–0.094, 0.027–0.12, and 0.014–0.084, respectively. A multiple regression for these 25 model runs deter-mined strong correlations between the yields and the concentrations of NOx, O3, and isoprene. Statistically obtained equations parameterize the NMM output yields:
YGA = 8.49 × 10⁻²[NOx]0.15+ 2.64 × 10⁻³[Isoprene]−1.70 × 10⁻⁴[O3]−9.20 × 10⁻³(4a) 10
YHA= 8.26 × 10⁻²[NOx]0.2−4.38 × 10⁻³[Isoprene]−1.30 × 10⁻⁴[O3]+ 2.37 × 10⁻²(4b)
YMG = 5.68 × 10⁻²[NOx]0.1+ 1.07 × 10⁻²[Isoprene]+ 3.60 × 10⁻⁴[O3]−3.54 × 10⁻²(4c) Global distributions of the monthly mean concentrations of NOx, O3, and isoprene were simulated with MOZART on a Gaussian grid with approximately 2.3◦ resolution. MOZART is a 3-dimensional global chemistry and transport model used to examine the 15
chemical and physical processes that control distributions of atmospheric constituents such as O3 and related trace compounds. Global distributions of the yields and the
APRs of GA, HA, and MG were calculated for each month using monthly-averaged
MOZART output and the regression results from the NMM. The global aerosol mass contribution of each of the isoprene oxidation products was then calculated using 20
Eq. (3). The AMCs were multiplied by the area of each global grid to determine the aerosol mass derived from isoprene oxidation products. Deviations between the yields predicted by the Eqs. (4a)–(4c) and calculated by the NMM ranged from 13% (HA) −18% (GA). Uncertainties in the isoprene flux (Fisoprene) and in the concentrations of NOx, O3and isoprene were estimated to be <200%. As a result, assumed errors for 25
ACPD
5, 11143–11156, 2005 Isoprene oxidation products in the aerosols S. N. Matsunaga et al. Title Page Abstract Introduction Conclusions References Tables Figures J I J I Back CloseFull Screen / Esc
Print Version Interactive Discussion
EGU uncertainties of the AMCs are estimated to be 250% (AMCGA), 240% (AMCHA) and
230% (AMCMG).
Table 1 presents estimated annual AMC of these compounds derived only from iso-prene. Total annual AMCs from the isoprene oxidation products GA, HA, and MG were estimated to be 35 (10–120) Tg yr−1 [16 (4.7–55) TgC yr−1]. This accounts for a large 5
part of estimated global biogenic secondary organic aerosol (30–270 Tg yr−1: Andreae and Crutzen, 1997) and is comparable to the aerosol mass derived from monoterpenes (5–60 Tg yr−1: Kanakidou et al., 2005; Griffin et al., 1999).
The impact of isoprene oxidation in the atmosphere could be substantially larger than previously estimated (Claeys et al., 2004). Our former work (Matsunaga et al., 2003) 10
estimated the global AMC to be 0.19–0.68 Tg yr−1by GA and 0.29–1.1 Tg yr−1 by HA. This is an order of magnitude lower than the estimate from this study. The difference in the results of the two studies is primarily due to the fact that the previous study related the isoprene flux to monoterpenes and assumed that the ratio of monoterpene and iso-prene fluxes was globally constant. This assumption results in a large underestimation 15
of isoprene emissions particularly in tropical regions. Finally, these isoprene oxidation products are highly water soluble; therefore, aerosols containing these compounds should be effective cloud condensation nuclei. This indicates that isoprene may have a significant role in the processes that control the global climate.
4. Conclusions 20
Aerosol mass contributions of isoprene oxidation products have been estimated based on field measurements, chemical box model and 3-D global chemical model calcu-lation, and the estimated values were 35 (10–120) Tg yr−1 [16 (4.7–55) TgC yr−1]. This result indicates isoprene should be regarded as a significant precursor of organic aerosol composition.
25
Acknowledgement. We thank T. Saito for valuable discussions and also thank for G. Petron
ACPD
5, 11143–11156, 2005 Isoprene oxidation products in the aerosols S. N. Matsunaga et al. Title Page Abstract Introduction Conclusions References Tables Figures J I J I Back CloseFull Screen / Esc
Print Version Interactive Discussion
EGU
Japan Society for the Promotion of Science (No. 08799), U.S. Environmental Protection Agency and the National Center for Atmospheric Research which is sponsored by National Science Foundation.
References
Andreae, M. O. and Crutzen, P. J.: Atmospheric aerosols: Biogeochemical sources and role in
5
atmospheric chemistry, Science, 276, 1052–1058, 1997.
Atkinson, R.: Kinetics and mechanisms of the gas-phase reactions of the hydroxyl radical with organic compounds, J. Phys. Chem. Ref. Data, 1, 1–246, 1989.
Atkinson, R.: Gas-Phase Tropospheric Chemistry of Organic Compounds: A Review, Atmos. Environ., 24A, 1–41, 1990.
10
Atkinson, R.: Atmospheric chemistry of VOCs and NOx, Atmos. Environ., 34, 2063–2101,
2000.
Aumont, B., Madronich, S., Bey, I., and Tyndall, G. S.: Contribution of secondary VOC to the composition of aqueous atmospheric particles: A model approach, J. Atmos. Chem., 35, 59–75, 2000.
15
Bey, I., Aumont, B., and Toupance, G.: The nighttime production of OH radicals in the continen-tal troposphere, Geophys. Res. Lett., 24, 1067–1070, 1997.
Claeys, M., Graham, B., Vas, G., et al.: Formation of secondary organic aerosols through photooxidation of isoprene, Science, 303, 1173-1176, 2004.
Griffin, R. J., Cocker III, D. R., Seinfeld, J. H., and Dabdub, D.: Estimate of global atmospheric
20
organic aerosol from oxidation of biogenic hydrocarbons, Geophys. Res. Lett., 26, 2721– 2724, 1999.
Guenther, A., Hewitt, C. N., Erickson, D., et al.: A global model of natural volatile organic compound emissions, J. Geophys. Res., 100, 8873–8892, 1995.
Gundel, L. A., Lee, V. C., Mahanama, K. R. R., et al.: Direct determination of the phase
dis-25
tributions of semi-volatile polycyclic aromatic hydrocarbons using annular denuders, Atmos. Environ., 29, 1719–1733, 1995.
Horowitz, L. W., Walters, S., Mauzerall, D. L., et al.: A global simulation of tropospheric ozone and related tracers: Description and evaluation of MOZART, version 2, J. Geophys. Res., 108, 4784, doi:10.1029/2002JD002853, 2003.
30
ACPD
5, 11143–11156, 2005 Isoprene oxidation products in the aerosols S. N. Matsunaga et al. Title Page Abstract Introduction Conclusions References Tables Figures J I J I Back CloseFull Screen / Esc
Print Version Interactive Discussion
EGU
reactions of aldehydes in the presence of a sulfuric acid aerosol catalyst, Environ. Sci. Tech-nol., 35, 4758–4766, 2001.
Kanakidou, M., Seinfeld, J. H., Pandis, S. N., et al.: Organic aerosol and global climate model-ing: a review, Atmos. Chem. Phys., 5, 1053–1202, 2005,
SRef-ID: 1680-7324/acp/2005-5-1053.
5
Kavouras, I. G., Mihalopoulos, N., and Stephanou, E. G.: Formation of Atmospheric Particles from Organic acids Produced by Forests, Nature, 395, 683–686, 1998.
Liggio, J., Li, S.-M., and McLaren, R.: Heterogeneous reactions of glyoxal on particulate matter: Identification of acetals and sulfate esters, Environ. Sci. Technol., 39, 1532–1541, 2005. Limbeck, A., Kulmala, M., and Puxbaum, H.: Secondary organic aerosol formation in the
atmo-10
sphere via heterogeneous reaction of gaseous isoprene on acidic particles, Geophys. Res. Lett., 30, doi:10.1029/2003GL017738, 2003.
Matsunaga, S. and Kawamura, K.: Determination of α- and β-Hydroxycarbonyls and dicar-bonyls in snow and rain samples by GC/FID and GC/MS employing benzyl hydroxyl oxime derivatization, Anal. Chem., 72, 4742–4746, 2000.
15
Matsunaga, S., Mochida, M., and Kawamura, K.: Growth of organic aerosols by semi-volatile carbonyls in the forestal atmosphere, Atmos. Environ., 35, 2045–2050, 2003.
Matsunaga, S., Mochida, M., and Kawamura, K.: Variation on the atmospheric concentra-tions of biogenic carbonyl compounds and their removal processes in the northern forest at Moshiri, Hokkaido Island, Japan, J. Geophys. Res., 109, 4302, doi:10.1029/2003JD004100,
20
2004.
Matsunaga, S., Kato, S., Yoshino, A., Greenberg, J. P., Kajii, Y., and Guenther, A. B.: Gas-aerosol partitioning of semi volatile carbonyls in polluted atmosphere in Hachioji, Tokyo, Geophys. Res. Lett., 32, L11805, doi:10.1029/2004GL021893, 2005.
Trainer, M., Williams, E. J., Parrish, D. D., et al.: Models and observations of the impact of
25
natural hydrocarbons on rural ozone, Nature, 329, 705–707, 1987.
Tuazon, E. C. and Atkinson, R.: A Product Study of the Gas-Phase Reaction of Methyl Vinyl
Ketone with the OH Radical in the Presence of NOx, Int. J. Chem. Kinet., 21, 1141–1152,
1989.
Tuazon, E. C. and Atkinson, R.: A Product Study of the Gas-Phase Reaction of methacrolein
30
ACPD
5, 11143–11156, 2005 Isoprene oxidation products in the aerosols S. N. Matsunaga et al. Title Page Abstract Introduction Conclusions References Tables Figures J I J I Back CloseFull Screen / Esc
Print Version Interactive Discussion
EGU
Table 1. Annual aerosol mass contributions (AMCs) of isoprene oxidation products on a global
scale. The ranges assigned to each value represent the total uncertainties.
AMCGA AMCHA AMCMG WSOCs Total
Tg yr−1 14 (3.9–47) 12 (3.5–40.6) 9.7 (2.9–32) 35 (10–120)
TgC yr−1 5.4 (1.5–19) 5.8 (1.7–20) 4.9 (1.5–16) 16 (4.7–55)
ACPD
5, 11143–11156, 2005 Isoprene oxidation products in the aerosols S. N. Matsunaga et al. Title Page Abstract Introduction Conclusions References Tables Figures J I J I Back CloseFull Screen / Esc
Print Version Interactive Discussion
EGU
Figure 1 Matsunaga et al.
0 1 2 3 4 5 00:00 06:00 12:00 18:00 00:00 ppbv Measured (PTRMS) Estimated (Model) Local time
Fig. 1. Comparison of the measured concentrations (dashed line) of methacrolein (MACR) and
methyl vinyl ketone (MVK) and simulated concentrations from the box model (solid line). MACR and MVK are the first generation oxidation products from isoprene and are precursors of gly-colaldehyde, hydroxyacetone and methylglyoxal on 10 July. The measurement for MACR and MVK has been made with a proton transfer reaction mass spectrometer (PTR-MS). Because these two compounds are isomers, the concentrations of MACR and MVK were obtained as total concentrations.
ACPD
5, 11143–11156, 2005 Isoprene oxidation products in the aerosols S. N. Matsunaga et al. Title Page Abstract Introduction Conclusions References Tables Figures J I J I Back CloseFull Screen / Esc
Print Version Interactive Discussion
EGU
Figure 2 Matsunaga et al.
(a) Glycolaldehyde 0 200 400 600 800 1000 1200 1400 07/10 00:00 07/10 06:00 07/10 12:00 07/10 18:00 07/11 00:00 07/11 06:00 07/11 12:00 07/11 18:00 07/12 00:00 pptv Measured (ADSS) Estimated (Model) (b) Hydroxyacetone 0 200 400 600 800 1000 1200 1400 1600 1800 07/10 00:00 07/10 06:00 07/10 12:00 07/10 18:00 07/11 00:00 07/11 06:00 07/11 12:00 07/11 18:00 07/12 00:00 pptv Measured (ADSS) Estimated (Model) (c) Methylglyoxal 0 100 200 300 400 500 600 700 800 900 1000 07/10 00:00 07/10 06:00 07/10 12:00 07/10 18:00 07/11 00:00 07/11 06:00 07/11 12:00 07/11 18:00 07/12 00:00 pptv Measured (ADSS) Estimated (Model) Local time
Fig. 2. Comparison of the
mea-sured concentrations (blue
cir-cles and lines) of (a)
glyco-laldehyde (GA),(b)
hydroxyace-tone (HA) and(c) methylglyoxal
(MG) between the measure-ments and the simulated con-centrations from the box model
(red squares and lines). The
measurements were made with an annular denuder sampling system (ADSS) which can mea-sure gaseous and particulate
compounds. The measured
concentrations in these plots represent the sum of those com-pounds in the gaseous and par-ticulate phases.
ACPD
5, 11143–11156, 2005 Isoprene oxidation products in the aerosols S. N. Matsunaga et al. Title Page Abstract Introduction Conclusions References Tables Figures J I J I Back CloseFull Screen / Esc
Print Version Interactive Discussion
EGU
Figure 3 Matsunaga et al. (a) Glycolaldehyde APR
GA = 0.47RH - 0.08 R2 = 0.3794 0.0 0.2 0.4 0.6 0.8 1.0 20.0 40.0 60.0 80.0 100.0 P/(G+P) Moshiri 2002 Duke 2003 TMU 2004 Boardman 2004 (b) Hydroxyacetone APRHA = 0.31RH + 0.11 R2 = 0.191 0.0 0.2 0.4 0.6 0.8 1.0 20.0 40.0 60.0 80.0 100.0 P/(G+P) Moshiri 2002 Duke 2003 TMU 2004 Boardman 2004 (c) Methylglyoxal APRMG = 0.31RH + 0.08 R2 = 0.1966 0.0 0.2 0.4 0.6 0.8 1.0 20.0 40.0 60.0 80.0 100.0 RH(%) P/(G+P) Moshiri 2002 Duke 2003 TMU 2004 Boardman 2004
Fig. 3. Relationship between
the aerosol partition ratio
(P/(G+P)) and relative humidity
for(a) GA, (b) HA, and (c) MG
obtained from four different
field experiments: Moshiri, (a
remote cold mountain forest in Japan), Duke (a temperate forest in a relatively polluted area in the U.S.), TMU (cam-pus at the Tokyo Metropolitan
University in Tokyo, Japan
(polluted)), and Boardman
(a remote poplar plantation
surrounded by a desert in the
U.S.). Vertical and horizontal
bars indicate uncertainties of the values based on analytical error of the WSOCs and error of hygrometer, respectively.