HAL Id: hal-00328364
https://hal.archives-ouvertes.fr/hal-00328364
Submitted on 12 May 2004
HAL is a multi-disciplinary open access
archive for the deposit and dissemination of
sci-entific research documents, whether they are
pub-lished or not. The documents may come from
teaching and research institutions in France or
abroad, or from public or private research centers.
L’archive ouverte pluridisciplinaire HAL, est
destinée au dépôt et à la diffusion de documents
scientifiques de niveau recherche, publiés ou non,
émanant des établissements d’enseignement et de
recherche français ou étrangers, des laboratoires
publics ou privés.
relationships with environmental factors
A. Marinoni, Paolo Laj, K. Sellegri, Gilles Mailhot
To cite this version:
A. Marinoni, Paolo Laj, K. Sellegri, Gilles Mailhot. Cloud chemistry at the Puy de Dôme:
vari-ability and relationships with environmental factors. Atmospheric Chemistry and Physics, European
Geosciences Union, 2004, 4 (3), pp.728. �hal-00328364�
www.atmos-chem-phys.org/acp/4/715/
SRef-ID: 1680-7324/acp/2004-4-715
Chemistry
and Physics
Cloud chemistry at the Puy de Dˆome: variability and relationships
with environmental factors
A. Marinoni1, 2, P. Laj1, K. Sellegri1, and G. Mailhot3
1Laboratoire de M´et´eorologie Physique, Universit´e Blaise Pascal, OPGC/CNRS, Clermont-Ferrand, France 2Dipartimento di Scienze dell’Ambiente e del Territorio, Universit`a degli Studi di Milano Bicocca, Italy 3Laboratoire de Photochimie Mol´eculaire et Macromol´eculaire, Universit´e Blaise Pascal, UMR CNRS 6505, Clermont-Ferrand, France
Received: 18 November 2003 – Published in Atmos. Chem. Phys. Discuss.: 5 February 2004 Revised: 27 April 2004 – Accepted: 6 May 2004 – Published: 12 May 2004
Abstract. The chemical composition of cloud water was investigated during the winter-spring months of 2001 and 2002 at the Puy de Dˆome station (1465 m above sea level, 45◦4602200N, 2◦5704300E) in an effort to characterize clouds in the continental free troposphere. Cloud droplets were sam-pled with single-stage cloud collectors (cut-off diameter ap-proximately 7 µm) and analyzed for inorganic and organic ions, as well as total dissolved organic carbon. Results show a very large variability in chemical composition and total solute concentration of cloud droplets, ranging from a few mg l−1to more than 150 mg l−1. Samplings can be classified in three different categories with respect to their total ionic content and relative chemical composition: background con-tinental (BG, total solute content lower than 18 mg l−1), an-thropogenic continental (ANT, total solute content from 18 to 50 mg l−1), and special events (SpE, total solute content higher than 50 mg l−1). The relative chemical composition shows an increase in anthropogenic-derived species (NO−3, SO2−4 and NH+4)from BG to SpE, and a decrease in dis-solved organic compounds (ionic and non-ionic) that are as-sociated with the anthropogenic character of air masses.
We observed a high contribution of solute in cloud water derived from the dissolution of gas phase species in all cloud events. This was evident from large solute fractions of ni-trate, ammonium and mono-carboxylic acids in cloud water, relative to their abundance in the aerosol phase. The compar-ison between droplet and aerosol composition clearly shows the limited ability of organic aerosols to act as cloud conden-sation nuclei. The strong contribution of gas-phase species limits the establishment of direct relationships between cloud water solute concentration and LWC that are expected from nucleation scavenging.
Correspondence to: A. Marinoni
1 Introduction
The fundamental role of cloud droplets as media for chem-ical reactions has long been recognized (Jacob et al., 1986; Chameides and Davis, 1983; Calvert et al., 1986; Liang and Jacobson, 1999; Laj et al., 1997a; M¨oller et al., 1996; Collett et al., 1999). Chemical and physical processes in multiphase systems significantly influence the transport, vertical redis-tribution, chemical transformation, and removal of chemical species from the atmosphere, and hence impact on the life-time of both aerosols and gases. As many of the existing chemical species formed in the gas phase can dissolve and react efficiently in the liquid phase, aqueous-phase reactions potentially act either as a sink or source for atmospheric trace compounds, depending on the physical and chemical charac-teristics of cloud droplets (Warneck, 1986). In addition, due to their high concentration of solutes, fogs and clouds play a crucial role in the deposition of pollutants. Clouds and fogs can significantly affect terrestrial and aquatic ecosys-tems, acting on a regional scale as a primary source of nutri-ents to ecosystems and as a potential source of toxic chemi-cals (Glotfelty et al., 1987).
The chemical composition of cloud droplets is determined by chemical and physical processes that include (i) the dy-namics of cloud formation, (ii) the composition and concen-tration of aerosols that are dissolved in the droplets from both nucleation and impaction scavenging, (iii) the transfer of volatile species across the air/water interface during the lifetime of the cloud, and (iv) the chemical reactions that can take place in the liquid phase. Since each of these pro-cesses can modify the original solute concentration of cloud droplets, the chemical composition of cloud droplets results from a combination of all three major processes.
Assessing the importance of multiphase chemical pro-cesses in the global atmospheric chemical cycle is rather complicated, given the variety of condensed matter and gaseous species that can participate in such reactions. For
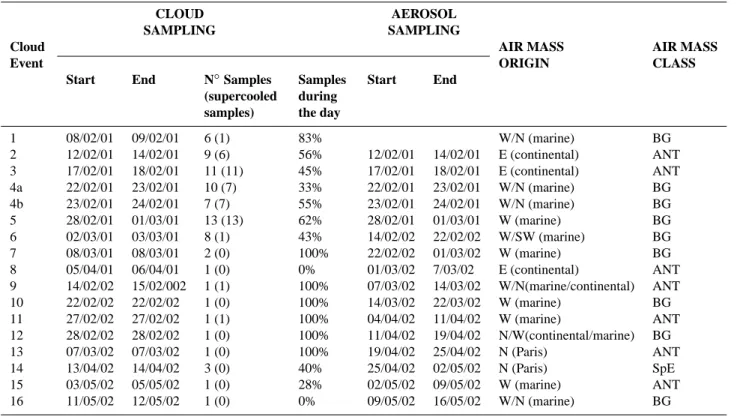
Table 1. Description of sampling conditions at PDD during winter/spring 2001 and 2002 for the cloud events used in the present study.
Corresponding aerosol sampling is indicated when available as well as air mass origin derived by HYSPLIT transport and dispersion model.
CLOUD AEROSOL
SAMPLING SAMPLING
Cloud AIR MASS AIR MASS
Event ORIGIN CLASS
Start End N◦Samples Samples Start End
(supercooled during samples) the day
1 08/02/01 09/02/01 6 (1) 83% W/N (marine) BG 2 12/02/01 14/02/01 9 (6) 56% 12/02/01 14/02/01 E (continental) ANT 3 17/02/01 18/02/01 11 (11) 45% 17/02/01 18/02/01 E (continental) ANT 4a 22/02/01 23/02/01 10 (7) 33% 22/02/01 23/02/01 W/N (marine) BG 4b 23/02/01 24/02/01 7 (7) 55% 23/02/01 24/02/01 W/N (marine) BG 5 28/02/01 01/03/01 13 (13) 62% 28/02/01 01/03/01 W (marine) BG 6 02/03/01 03/03/01 8 (1) 43% 14/02/02 22/02/02 W/SW (marine) BG 7 08/03/01 08/03/01 2 (0) 100% 22/02/02 01/03/02 W (marine) BG 8 05/04/01 06/04/01 1 (0) 0% 01/03/02 7/03/02 E (continental) ANT 9 14/02/02 15/02/002 1 (1) 100% 07/03/02 14/03/02 W/N(marine/continental) ANT 10 22/02/02 22/02/02 1 (0) 100% 14/03/02 22/03/02 W (marine) BG 11 27/02/02 27/02/02 1 (1) 100% 04/04/02 11/04/02 W (marine) ANT 12 28/02/02 28/02/02 1 (0) 100% 11/04/02 19/04/02 N/W(continental/marine) BG 13 07/03/02 07/03/02 1 (0) 100% 19/04/02 25/04/02 N (Paris) ANT 14 13/04/02 14/04/02 3 (0) 40% 25/04/02 02/05/02 N (Paris) SpE 15 03/05/02 05/05/02 1 (0) 28% 02/05/02 09/05/02 W (marine) ANT 16 11/05/02 12/05/02 1 (0) 0% 09/05/02 16/05/02 W/N (marine) BG
example, liquid phase mechanisms linked to the process of acidification of precipitation are well understood, espe-cially for sulphur and nitrogen compounds (Warneck, 1986; Jaeschke, 1986; Lelieveld and Crutzen, 1991). On the con-trary, it is only recently that attention has focused on the cen-tral role of clouds in the alteration of the oxidizing capacity of the atmosphere, through reactions involving both free rad-icals (Lelieveld and Crutzen, 1991; Lawrence and Crutzen, 1998) and/or organic species (Aneja, 1993; Khwaja et al., 1995; Fuzzi and Zappoli, 1996; Krivacsy et al., 2000; Hitzen-berger et al., 2000).
The inorganic fraction of cloud composition has been stud-ied extensively (Chandler et al., 1988a, b; Collett et al., 1993, 1995; Erel et al., 1993; Fuzzi et al., 1992, 1998; Hegg and Hobbs, 1986). While data on the organic content are sparse, it is clear that organic content can constitute a significant fraction of the solute mass (Aneja, 1993; Fuzzi and Zappoli, 1996; Novakov and Penner, 1993; Hadi et al., 1995). The nature of the organic compounds present in cloud droplets is highly variable, and the number of chemical species that have been identified at present is extremely high (Herckes et al., 2002; Decesari et al., 2001; Cappiello et al., 2003).
Given the dispersed nature of aerosol particles, gases, and the environmental conditions leading to the formation of clouds, the chemistry of liquid atmospheric phase is highly variable. The Liquid Water Content (LWC) is one of the ma-jor factors that control the concentration in the liquid phase
(Junge, 1963; Elbert et al., 2000; M¨oller et al., 1996). As expected, concentrations of dissolved species often display an inverse relationship with LWC (Pili´e et al., 1975; Munger et al., 1983; Jacob, 1984; F¨uhrer, 1986; Fuzzi, 1986; Ger-vat et al., 1984; Aneja et al., 1990), but other parameters can locally complicate the relationship between droplet con-centrations and cloud microphysics. For example, the initial chemical composition of cloud water appears to be driven largely by the composition of the aerosol particles that serve as Cloud Condensation Nuclei (CCN). Finally, the contribu-tion of ambient soluble gases can significantly change the chemical composition of droplets (Jacob et al., 1986, 1987). These factors are not adequately treated in present-day atmo-spheric models, where solute concentration is simply com-puted on the basis of scavenging efficiency and Henry’s law of equilibrium.
A better knowledge of relationships that relate solute con-centration in cloud water to environmental parameters, as well as more data on the temporal variation of chemical con-centration of cloud water, would clearly contribute to the construction of cloud chemistry models that possess better constraints. The goal of this paper is to provide information on atmospheric chemistry in the liquid phase in relation to the chemical and physical properties of aerosol particles and to the microphysics of clouds. We investigate cloud chem-istry and present statistics that are based on the monitoring of sixteen cloud events during the winter/spring periods in two
consecutive years. The chemical investigation includes mea-surements of inorganic compounds, as well as dissolved total organic carbon that includes speciation of organic carbon for many carboxylic acids. These measurements can provide the requisite data-set for the construction of models concerning cloud effects in the arena of tropospheric chemistry.
2 Experimental
2.1 Study area and experimental set-up
Experimental studies were carried out at the Puy de Dˆome (PDD) station (48◦N, 2◦E; 1465 m a.s.l.), in the Massif Cen-tral Region (France). It is a strategic point from which to observe warm and mixed clouds that are present 50% of the time between November and March. Clouds are frequently formed at the top of the site, either during advection of frontal systems or by the orographic rising of moist air. During the winter/spring months, the station lies in the free troposphere, as indicated by the low particle number concentration, and air masses are usually exempt from the influence of local pollu-tion. Road access to the site was restricted to authorized per-sonnel during all sampling periods; cars were stopped 5 km before the summit at 850 m a.s.l. to prevent local contami-nation. A small military base is located to the north of the station, but fuel combustibles are limited exclusively to win-ter storm events.
Meteorological parameters are monitored at the station and include wind speed and direction, temperature, pres-sure, and relative humidity (RH). In addition, monitoring of a variety of atmospheric gas concentrations (O3, NOx, SO2, CO2), black carbon (BC, measured by a Magee Scientific æthalometer, AE1-series), and total particle number concen-trations (NCPC, measured in the range from 10 nm to 3 µm by a Condensation Particle Counter Model 3010, product by TSI) occurs throughout the year. The station is equipped for cloud microphysical measurements. However, in this study we only have measurements of LWC and effective ra-dius (Re) of droplets as obtained with a Gerber PVM-100 probe. An overall description of measurements performed at the station can be found at http://www.obs.univ-bpclermont. fr/observ/chimie/pdd listedata.html.
2.2 Cloud droplets and aerosol particle sampling
In addition to the routine monitoring described above, cloud sampling was performed between 8 February and 6 April 2001 (68 samples during 8 different events), and between 14 February and 12 May 2002 (10 samples during 8 different events) (see Table 1). The air mass origin, computed by back-trajectory analysis, is indicated for each cloud event. The sampling periods included both warm and super-cooled con-ditions for cloud droplets. Sampling was restricted to non-precipitating clouds.
Cloud droplets were sampled with single-stage cloud col-lector similar to that described by Kruisz et al. (1993). Droplets are sampled at a flow rate of approximately 80 m3h−1 and collected by impaction onto a 10 cm2 rect-angular plate. The cloud droplets either freeze upon impact (super-cooled conditions) or are collected directly in the liq-uid phase. The droplet sampling efficiency is enhanced with the utilization of a large stagnation plate close to the collector inlet. Laboratory tests have shown that the cut-off diameter of the collector is approximately 7 µm. Changes in the cut-off diameter due to building of ice onto the impaction plate are expected to be small given the limited volume of col-lected sample.
Averaged droplet size distributions measured by a Forward Scattering Spectrometer Probe show that this cut-off is suffi-cient to collect more than 80% of the cloud liquid water mass (Dupuy et al., 2002). The sampling intervals (40 min up to 2 h) varied and were dependent on the LWC. Previous experi-ments have shown that the LWC is measured with a precision of approximately 20% (Mertes et al., 2001).
We concurrently used two collectors for sample analysis by ion chromatography and carbon. The difference between the samplers is in the material used for the impaction plates and the liquid water collectors, as well as the cleaning pro-cedures. The sampler used for ion chromatography analysis and pH measurements was made of aluminium. The second sampler, used for total carbon (TC) and organic carbon (OC) analyses, was made of stainless-steel. Cleaning procedures were similar to those described by Sellegri et al. (2003b).
The samples for ion chromatography and carbon analyses were frozen immediately after collection, stored in glass bot-tles (Schott), and thawed in a clean room just before the anal-ysis. IC and TC/OC measurements were performed within three days after collection.
Aerosol particles were sampled using 2 cascade impactors almost simultaneously with the collection of cloud water (see Table 1). Data are discussed by Sellegri et al. (2003a, b). Sampling is performed through a whole air inlet that collects both cloud droplets and interstitial particles. The sampling time required for aerosol collection is generally longer than the cloud sampling period for which an operator in needed. In addition, aerosol sampling is also performed in the ab-sence of cloud. This explains the small differences in the sampling time of aerosols and clouds listed in Table 1. Gas phase concentrations of several species (HNO3, SO2, NH3, CH3COOH, HCOOH) measured by mist chambers are also available for 2001 samples and are discussed by Sellegri et al. (2003c).
2.3 Chemical analyses
Aerosol and cloud samples were analysed for the determi-nation of major ionic compounds, as well as total organic carbon concentrations. The preparation and analyses of the cloud and aerosol samples were performed under a class 100
Table 2. Detection limits (µg l−1)for the chemical species measured by IC and for DOC under the analytical procedures used in this study, calculated like three times the standard deviation of field blank.
Fluorure Lactate Acetate Glycolate Propionate Formate Glyoxylate MSA
0.63 1.21 3.21 1.14 0.65 0.41 0.36 0.34
Nitrate Glutarate Succinate Maleate Malonate Tartrate Sulphate Oxalate
0.11 0.56 0.98 0.64 1.01 0.26 0.66 0.98
Chloride Sodium Ammonium Potassium Magnesium Calcium DOC
1.29 0.82 1.34 0.57 0.36 3.96 50
laminar flow bench to minimize possibility of contamination from external sources. Data quality was controlled utilizing two field blanks for each cloud event and one blank filter for every impactor.
2.3.1 Ion chromatography
Ion chromatographic analyses were performed in a clean room (class 10 000). Cloud water was injected directly with-out filtration to avoid further contamination. Working condi-tions are similar to those detailed by Jaffrezo et al. (1998), who employed a DIONEX 100 chromatograph equipped with a CS12 column for the cations, and a DIONEX 500 with an AS11 column for the anions. CH3COO−, HCOO−, Cl−, NO−3, SO2−4 , C2O2−4 , Na+, NH+4, K+, Mg2+and Ca2+are the ions analysed in 2001. At the end of 2001 and in 2002, additional mono and di-carboxylic acids were measured: lac-tic, glycolic, propionic, glyoxylic, glutaric, succinic, maleic, malonic and tartaric. Detection limits were calculated from a mean blank plus one standard deviation. The accuracy of ion chromatographic analyses is typically 10% for samples 10 times the detection limit, and approximately 50% for sam-ples twice the detection limit. Detection limits are provided in Table 2.
2.3.2 Dissolved organic carbon
Dissolved Organic Carbon (DOC) measurements in the liq-uid phase were obtained with a Total Organic Carbon (TOC) analyzer Shimadzu model TOC-5O5OA on filtered samples. The Shimadzu TOC-5O5OA is capable of performing Total Carbon (TC) analyses by combustion and Inorganic Carbon (IC) analyses by oxidation. TOC measurements were ob-tained by calculating the difference between TC and IC mea-surements.
The instrument works with a TC combustion tube, which is filled with a TC catalyst and heated to 680◦C. When the cloud water sample is introduced into the TC combustion tube, the carbon is combusted/oxidized to form CO2. The carrier gas (purified air) and the combustion product (CO2) pass through a sample cell of the Non-Dispersive Infrared Detector (NDIR), where CO2 is detected. For IC
measure-ments, the sample is introduced into the IC reaction ves-sel (containing H3PO425%), through which the carrier gas flows in the form of tiny bubbles. Only the IC component in the sample is decomposed to form CO2,which is detected upon reaching the NDIR. In these conditions, Carbon in the form of carbonates and hydrogen carbonates are the only species measured as IC. Calibration curves within the range 0–15 mg l−1were obtained by using potassium hydrogen ph-thalate and sodium hydrogen carbonate as representatives of organic and inorganic carbon respectively. Detection limits are provided in Table 2.
3 Results
3.1 Chemical composition of the liquid phase 3.1.1 Inorganic substances
The chemical analyses and microphysics data are reported in Table 3. We found large differences in the chemical compo-sition of cloud water between events, both in relative com-position and in total ionic content leading to concentration differences exceeding a factor of 100 for some compounds when comparing minimum and maximum values. This is not seen, however, within a single cloud event: half of the events are composed of more than one sample (Table 1) and no large variation in solute concentration is observed amongst sam-ples of a same event.
The variations in solute concentrations are not due to vari-ations in LWC (R2TIC/LWC=0.09). Because of limited vari-ation of LWC, the cloud water loading (CWL) shows a simi-lar behaviour to that of total ionic content (TIC).
The total ionic content (TIC) ranged from 0.7 to 199 mg l−1, with a median of 11 mg l−1and a standard devi-ation of 27 mg l−1. The frequency distribution of total ionic content is shown in Fig. 1. The TIC average (18 mg l−1)
is driven by a few highly concentrated samples that reach 200 mg l−1, while the majority of samples have a TIC lower than 10 mg l−1. These low concentrations are character-istic of European high-altitude sites, far from local pol-lution sources, such as Sonnblick (3106 m a.s.l., Austria,
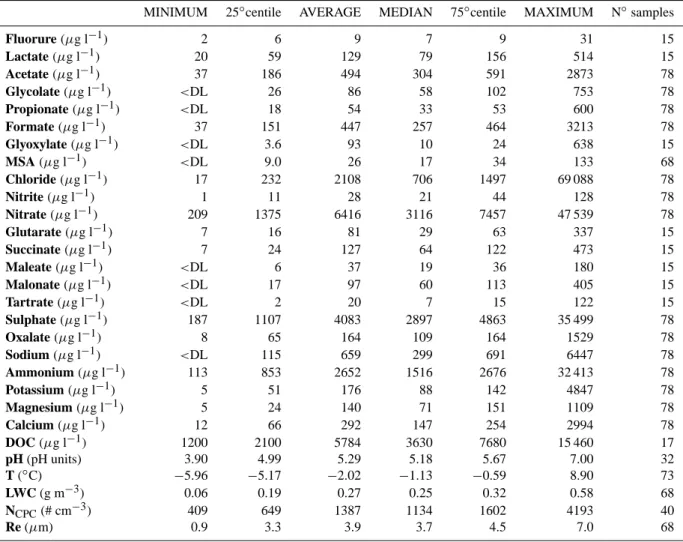
Table 3. Minimum, average, median, 25◦and 75◦ percentile, and maximum of the chemical, physical and microphysical parameters measured at PDD station (Re: effective radius of droplets; NCPC: number of particles). Statistical parameters are calculated on all data set
(78 samples).
MINIMUM 25◦centile AVERAGE MEDIAN 75◦centile MAXIMUM N◦samples
Fluorure (µg l−1) 2 6 9 7 9 31 15 Lactate (µg l−1) 20 59 129 79 156 514 15 Acetate (µg l−1) 37 186 494 304 591 2873 78 Glycolate (µg l−1) <DL 26 86 58 102 753 78 Propionate (µg l−1) <DL 18 54 33 53 600 78 Formate (µg l−1) 37 151 447 257 464 3213 78 Glyoxylate (µg l−1) <DL 3.6 93 10 24 638 15 MSA (µg l−1) <DL 9.0 26 17 34 133 68 Chloride (µg l−1) 17 232 2108 706 1497 69 088 78 Nitrite (µg l−1) 1 11 28 21 44 128 78 Nitrate (µg l−1) 209 1375 6416 3116 7457 47 539 78 Glutarate (µg l−1) 7 16 81 29 63 337 15 Succinate (µg l−1) 7 24 127 64 122 473 15 Maleate (µg l−1) <DL 6 37 19 36 180 15 Malonate (µg l−1) <DL 17 97 60 113 405 15 Tartrate (µg l−1) <DL 2 20 7 15 122 15 Sulphate (µg l−1) 187 1107 4083 2897 4863 35 499 78 Oxalate (µg l−1) 8 65 164 109 164 1529 78 Sodium (µg l−1) <DL 115 659 299 691 6447 78 Ammonium (µg l−1) 113 853 2652 1516 2676 32 413 78 Potassium (µg l−1) 5 51 176 88 142 4847 78 Magnesium (µg l−1) 5 24 140 71 151 1109 78 Calcium (µg l−1) 12 66 292 147 254 2994 78 DOC (µg l−1) 1200 2100 5784 3630 7680 15 460 17 pH (pH units) 3.90 4.99 5.29 5.18 5.67 7.00 32 T (◦C) −5.96 −5.17 −2.02 −1.13 −0.59 8.90 73 LWC (g m−3) 0.06 0.19 0.27 0.25 0.32 0.58 68 NCPC(# cm−3) 409 649 1387 1134 1602 4193 40 Re (µm) 0.9 3.3 3.9 3.7 4.5 7.0 68
Hitzenberger et al., 2000; Kasper-Giebl et al., 2000) and Jungfraujoch (3450 m a.s.l, Switzerland, Baltensperger et al., 1998). Most cloud samples with low concentration were sampled during winter (January–February) and showed a strong decoupling between free-tropospheric and boundary layer air masses, even at the relatively low altitude of PDD. This is confirmed by the low concentration of particle num-ber at the station in winter/spring time (more than 72% of the time the number of particles cm−3is below 2000).
As shown by the frequency distribution in Fig. 1, a sistent fraction of cloud samples have consistent solute con-centrations between 18 and 50 mg l−1. These concentra-tions are slightly lower than ionic concentraconcentra-tions measured at mountain sites under the influence of medium range pol-lution, such as Great Dun Fell (23 mg l−1 just for sulphate, Laj et al., 1997b), Aubure in the Vosges Mountains (east-ern France; 66 mg l−1 measured by Herckes et al., 2002), Whiteface Mountain (60 mg l−1 Khwaja et al., 1995) and
the eastern part of United States (Weathers al., 1988). This also corresponds to the range of concentrations found dur-ing the CIME campaign, and to levels measured by Voisin et al. (2000) at PDD. The long-range transport of atmospheric pollutants, mostly from northern Europe, can have a substan-tial impact on the chemistry of clouds during several events. Finally, the presence of highly concentrated samples is surprising for such a non-industrialized area. These concen-trations are in fact similar to those found in the much polluted regions of the Po Valley (211 mg l−1, Fuzzi et al., 1988) and the Czech Krusne Hory plateau (120 mg l−1, Bridges et al. 2002). Similar elevated levels were already encountered at PDD during a cloud event of the CIME campaign (59 mg l−1, Flossmann, 2000).
Variation of cloud TIC is paralleled with variation in the concentration of the relative chemical components of cloud water. As expected, nitrate, sulphate and ammonium are the most abundant ions in cloud water at the PDD site. NO−3
mg l-1 0 20 40 60 80 100 120 140 160 180 200 F re q u e n c y 0 5 10 15 20 25
Fig. 1. Frequency distribution of Total Ionic Content in cloud water
samples.
is the most important anion with an average contribution to the TIC of 37%; concentrations range from 0.2 mg l−1 to 47 mg l−1, with a median of 3.1 mg l−1. The second most abundant anion is SO2−4 (22%, ranging from 0.2 mg l−1 to 35 mg l−1 with a median of 2.9 mg l−1), followed by chlo-ride (9%, ranging from 0.02 mg l−1to 69 mg l−1with a me-dian of 0.7 mg l−1) and organic acids (9%, ranging from 0.1 mg l−1to 11 mg l−1with a median of 0.8 mg l−1). NH+4 is the most abundant cation (13%, ranging from 0.1 mg l−1to 32 mg l−1with a median of 1.5 mg l1), followed by sodium (4%, ranging from 0.01 mg l−1 to 6.4 mg l−1 with a me-dian of 0.3 mg l−1)and minor contributions from the others cations.
A striking difference between the cloud chemistry mea-sured at PDD and that of previous studies at other locations is the predominant contribution of nitrate to the TIC. For ex-ample, sulphate is on average 32 times more concentrated in the Po Valley than at PDD, while nitrate is just 12 times more concentrated, despite the presence of important nitro-gen emissions. The remoteness from local sources and the efficient oxidation of NOxmake nitrate a key substance that drives the chemistry of clouds at the PDD site.
Consequently, the acidity of cloud water is controlled by both nitrate and sulphate. The pH of cloud water was not measured in every sample, but it can be estimated by the ionic balance. The liquid phase often shows cation-to-anion ratios that are below unity, indicating that these samples are quite acidic. The average ratio is 0.87 (in equivalents), with lowest values occurring in the most concentrated events: #3 (0.65), #14 (0.69) and #5 (0.74), with two samples of the latter also having the lowest measured pH values (4.1 in event #3 and 4.8 in event #5). In contrast, in samples at low concentrations NH+4 present in solution is sufficient to neutralize the acidity from both HNO3and H2SO4. The presence of relatively high ammonia/ammonium concentrations appears consistently at
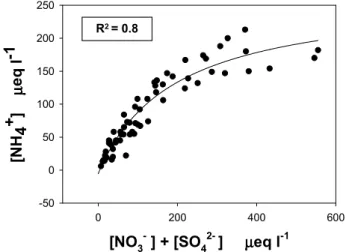
[NO3- ] + [SO42- ] µµµµeq l-1
0 200 400 600 [NH 4 + ] µµµµ eq l -1 -50 0 50 100 150 200 250 R2 = 0.8
Fig. 2. Correlation between ionic concentration of the major
acidi-fying species (NO−3 and SO2−4 )and ammonium in cloud water.
PDD, even during wintertime. The average (NH3+NH4+) concentration monitored for the 2001 samples is of the or-der of 1 µg m−3(Sellegri et al., 2003c). A large fraction of NH+4 arises from the dissolution of gaseous NH3(Sellegri et al., 2003c; Laj et al., 2001). The acidity of cloud water in the background continental free troposphere is influenced by emissions from agricultural activities on the regional scale. Background NH3levels are not sufficient to neutralize cloud water during advection of anthropogenic air masses.
The progressive decrease of the contribution of NH+4 to TIC as a function of the anthropogenic character of air-masses (SO2−4 +NO−3) is illustrated in Fig. 2. Nitrate and sulphate are significantly correlated with NH+4 (R2=0.80), but the acidic behaviour of air masses is controlled by NO−3. The average nitrate to sulphate equivalent ratio is 1.28, and is higher than ratios obtained for cloud water samples col-lected at Whiteface Mountain (Khwaja et al., 1995) or at var-ious sites in the United States (Weathers et al., 1988), where the ratio ranged from 0.13 to 0.53. However, a similar ra-tio of 1.1 was found by L¨oflund et al. (2002) at Mount Rax (Austria, 1400 m a.s.l.). The nitrate to sulphate ratio has been used as an indicator of the remoteness of a site by Weathers et al. (1988); indeed a value of 0.53 was found in the Czech Krusne Hory plateau (Bridges et al., 2002), 0.6 in the Vos-ges Mountains (Herckes et al., 2002) and 0.72 at Jungfrau-joch (Baltensperger et al., 1998): the nitrate to sulphate ratio clearly increases with remoteness of the sampling site. This is not the case at PDD, where high nitrate fractions are asso-ciated with anthropogenic air masses. Sellegri et al. (2003a) reached similar conclusions from the aerosol composition at PDD. A ratio of 0.94 was also measured by the CIME exper-iment during a highly polluted episode (Flossmann, 2000). The predominance of nitrate over sulphate in the acidification of aerosols has already been observed over Europe (Schaap et al., 2002), and might indicate an evolution of the sources of
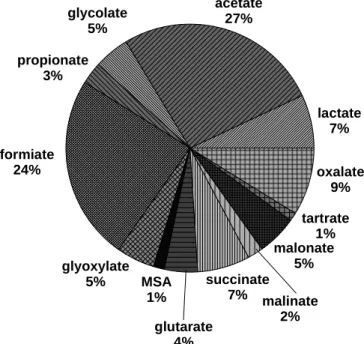
lactate 7% acetate 27% glutarate 4% propionate 3% formiate 24% glyoxylate 5% glycolate 5% succinate 7% malinate 2% malonate 5% tartrate 1% oxalate 9% MSA 1%
Fig. 3. Contribution of different carboxylic acids to the cloud droplets composition (average on 16 events).
pollution. The data considered from Europe are more recent than that from the USA, and may indicate both a change in emission characteristics and differences in rate of emissions between Europe and the USA.
3.1.2 Organic species
Dissolved Organic Carbon (DOC) was measured on 7 sam-ples in 2001 and 10 samsam-ples in 2002. The concentration of DOC ranges from 1.2 mg l−1to 8.9 mg l−1(15.4 mg l−1 for event #14), with a median of 3.6 mg l−1. These values are similar to levels measured in clouds at Mount Rax (L¨oflund et al., 2002). The correlation between DOC and TIC is significant (R2=0.78), although the relationship is charac-terized by significant scattering. Among the three major ionic species, the strongest correlation (R2=0.86) is found with NH+4, that derives from both anthropogenic and nat-ural emissions, the weakest correlation occurs with NO−3 (R2=0.73). However, no significant correlation is found with BC, a tracer for anthropogenic air masses; this is contrary to the findings of L¨oflund et al. (2002) who found that an in-crease in BC concentrations coincided with elevated organic acid concentrations of various acids, especially during sev-eral events. On the other hand, very high levels of DOC can be found in clouds in the presence of polluted air masses, accompanied by a characteristic high TIC (up to 15 mg l−1)
and high levels of NCPC. These results may indicate that a fraction of the DOC is not associated with the long-range transport of anthropogenic air masses, but rather with
non-Table 4. HCOO−/SO2−4 , CH3COO−/SO2−4 and C2O2−4 /SO2−4
ra-tios during daytime and nighttime.
Formate/ Acetate/ Oxalate/ sulphate sulphate sulphate
Daytime 0.21 0.22 0.06 Nighttime 0.10 0.14 0.03
urban sources that are possibly biogenic or agricultural in origin. We estimate this background level at the PDD to be between 2 and 3 mg l−1, and it is quite constant in all low concentrated clouds. In the case of polluted events, a fur-ther anthropogenic source of organic carbon can be super-imposed on the background level. This is confirmed by the correlation between DOC and NCPC that is weak (R2=0.37) on whole data set, but it becomes significant in polluted air masses (R2=0.8 during event #14). Unfortunately, data cor-relating BC and DOC have not been available for polluted air masses for some time.
A significant fraction of the DOC is measured with ion chromatography. Overall, the carboxylic acids contribution to the DOC ranges from 18% to 71%, with an average of 36%. Khwaja et al. (1995) attributed 7–15% of the DOC to acetic, formic, oxalic, malonic and pyruvic acids in cloud water on Whiteface Mountain.
A large fraction of the CA are monocarboxylic acids: the mono-carboxylic acids (MCA: formic, acetic, lactic, gly-colic, glyoxylic, propionic) are present in larger concentra-tions (71% of the CA concentration) than the dicarboxylic acids (DCA: oxalic, glutaric, succinic, maleic, malonic and tartaric) (29% of the CA concentration). The oxalic acid (9%) is the most abundant DCA. As shown in Fig. 3, the most abundant carboxylic acids are acetic (27%) and formic (24%). This is in agreement with Chebbi and Carlier (1996) who showed that formic and acetic acids are the predominant CA in the tropospheric aqueous phase.
However, the contribution of organic acids to the total so-lute content remains low compared to the contribution of major ions, varying from 2% to 25% and showing an av-erage of 10%. This corresponds to concentrations ranging from 0.1 mg l−1to 5.3 mg l−1, with a median of 0.7 mg l−1 and a noteworthy maximum concentration in event #14 of 11 mg l−1. The acetic, formic and oxalic acid concentrations are twice those measured at PDD by Voisin et al. (2000), but in the same range as those recorded at Mount Rax (L¨oflund et al., 2002) and Mount Sonnblick (Brantner et al., 1994; Lim-beck and Puxbaum, 2000).
The contribution of organic acids to ionic composition de-creases with an increase in the anthropogenic character of the air mass. It varies from more than 20% in samples with solute content <18 mg l−1to less than 5% for heavily con-centrated samples. As seen by Sellegri et al. (2003c), the
! " ! # $ % ! & ' () ) * + ! " ! # $ % ! * !,- ) * . + ! " ! . # $ % !
Fig. 4. Cloud water composition (in mg l−1)for ionic and organic compounds for the three different types of cloud event at PDD.
most common CAs are originating principally from the gas-phase. The CA have pKa values that fall within typical pH
values for cloud water (acetic acid 4.75), and thus their dis-solution, depending upon pH, can be reduced by low pH dur-ing polluted events. This is in contrast to the dissolution of NH3which is not pH dependent when pH values are below 9 units. Although we cannot exclude, at this point, that low concentrations of CA are regulated by weaker solubilisation of CA at low pH, we propose that similarities between CA and NH+4 indicate that a large fraction of both species orig-inates from non-urban sources. In addition, contrary to the findings of L¨oflund et al. (2002) at Mount Rax, a good corre-lation (R2=0.87) between DOC and the sum of organic acids is found at PDD. We can conclude that background CA levels in the continental free troposphere most likely originate from biogenic sources and they may be used as tracer components for the DOC in cloud water, and vice versa.
Several samples were taken during night-time. An interesting feature of the cloud chemistry is that the HCOO−/SO2−4 , CH3COO−/SO2−4 and C2O2−4 /SO2−4 ratios appear consistently higher during the daytime than the night-time (Table 4). This is seen both when samples are consid-ered as independent variables or averaged on a per-event ba-sis. The daytime/night-time difference is significant at the 95% confidence level. This leads to the conclusion that a fraction of the carboxylic acids, including oxalate, are pro-duced via photochemical reactions, either in the gas or liquid phase of clouds, as proposed by Chebbi and Carlier (1996). 3.2 Composition of clouds in the continental free
tropo-sphere
Following the approach of Sellegri et al. (2003a), we have attempted a classification of clouds on the basis of their TIC to differentiate solute chemical composition for back-ground continental (BG), anthropogenic-influenced (ANT) and polluted conditions (SpE). Based on comparisons with previous studies performed in remote conditions and on the shape of the frequency distribution of Fig. 1, we have set
the TIC threshold for background continental conditions to 15 mg l−1. Based on the same arguments, the TIC thresh-old for anthropogenic-influenced cloud composition is set to 40 mg l−1.
Taking into account the organic fraction of dissolved mate-rial, the concentration thresholds for the different categories are:
• Background continental free troposphere: solute con-centration <18 mg l−1
• Anthropogenic-influenced: 18 mg l−1<solute concen-tration <50 mg l−1
• Polluted: solute concentration >50 mg l−1
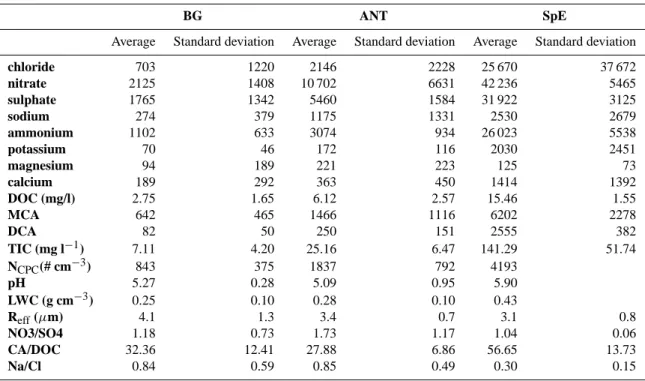
The overall composition comparison between the three cloud types leads to an average composition of cloud water for the three different air mass categories, as shown in Fig. 4. The average of the most important chemical species and the ratios discussed previously are shown in Table 5.
The major difference between the three categories is due to the decrease in the contribution of DOC to the solute concentration: 28% for background conditions, 21% for anthropogenic-influenced air masses, and 13% for polluted cases. The CA contribution to DOC also decreases as the anthropogenic influence increases. Marine species (Na+and Cl−)show the same behaviour as the organic compounds: they account for 11% in background conditions and decrease to only 4% in polluted cases. This is paralleled with an in-crease in the NO−3 contribution, from 24% in background conditions up to 35% for both polluted and anthropogenic influenced conditions. The high levels of NH+4 during pol-luted cases show that these events are associated with strong transport from the boundary layer where NH3 emissions take place. Regardless of the conditions, the contribution of SO2−4 remains lower than that of NO−3 and never exceeds 20%, except for the polluted event #14 where it reached 27%. The changes in chemical composition are followed by changes in cloud acidity, with a decrease in pH from a
Table 5. Averaged values for three different air mass categories (in µg l−1when not specified).
BG ANT SpE
Average Standard deviation Average Standard deviation Average Standard deviation
chloride 703 1220 2146 2228 25 670 37 672 nitrate 2125 1408 10 702 6631 42 236 5465 sulphate 1765 1342 5460 1584 31 922 3125 sodium 274 379 1175 1331 2530 2679 ammonium 1102 633 3074 934 26 023 5538 potassium 70 46 172 116 2030 2451 magnesium 94 189 221 223 125 73 calcium 189 292 363 450 1414 1392 DOC (mg/l) 2.75 1.65 6.12 2.57 15.46 1.55 MCA 642 465 1466 1116 6202 2278 DCA 82 50 250 151 2555 382 TIC (mg l−1) 7.11 4.20 25.16 6.47 141.29 51.74 NCPC(# cm−3) 843 375 1837 792 4193 pH 5.27 0.28 5.09 0.95 5.90 LWC (g cm−3) 0.25 0.10 0.28 0.10 0.43 Reff(µm) 4.1 1.3 3.4 0.7 3.1 0.8 NO3/SO4 1.18 0.73 1.73 1.17 1.04 0.06 CA/DOC 32.36 12.41 27.88 6.86 56.65 13.73 Na/Cl 0.84 0.59 0.85 0.49 0.30 0.15
value of 5.5 during background periods to a value of 5.1 for anthropogenic-influenced cases. The pH difference between polluted episodes and anthropogenic-influenced air masses is of the order of 0.4 pH units, and is primarily due to the addi-tion of HNO3. In the special event #14, nitrate and sulphate are the predominant ionic species but the pH remains fairly high (pH=5.9), suggesting the efficient neutralization of acid-ity by large amounts of ammonium from the gas phase.
Such chemical changes in the liquid phase chemistry of clouds are of obvious importance for the dissolution and re-action rates of many chemical species.
3.3 Relationship with the chemical composition of aerosol particles
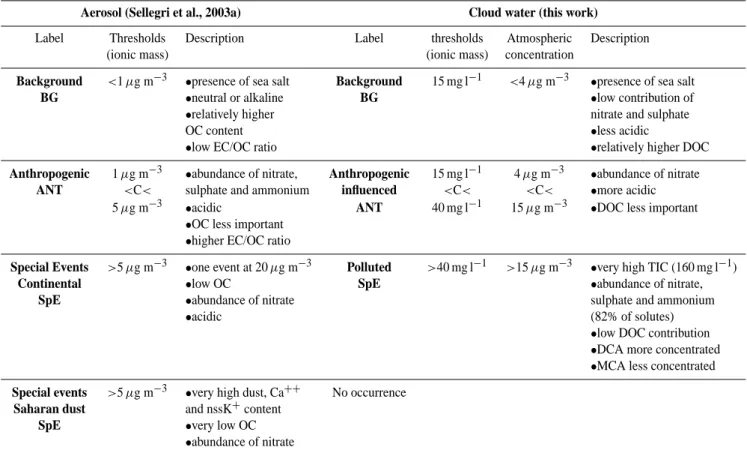
Sellegri et al. (2003a) have proposed a classification of the different aerosol types at PDD, giving an average aerosol composition for the three air mass types through the anal-ysis of aerosol chemistry. Here, we have compared the rela-tive composition of clouds and aerosols for the different air mass conditions. As aerosols and clouds are not always sam-pled simultaneously (the time integration of aerosol samples is much longer than that for clouds, and can take place during clear sky conditions), a comparison of average composition is not straightforward.
However, both classifications are performed on the basis of the ionic content of either cloud water or aerosols. We can check the consistency of the 2 classifications by convert-ing the liquid phase concentration into an atmospheric
con-centration (Cloud Water Load, CWL). This is simply com-puted using the average concentration of cloud water (LWC) as measured by the PVM probe:
[CWL]µg m−3=
[TIC]mg l−1[LWC]gm−3
ρwater
gl−1
(1)
The results of the comparison between the 2 classifications are shown in Table 6. Under the assumption that aerosol and cloud classes are referring to the same air masses (this is verified when cloud and aerosols are sampled simultane-ously), it is clear that atmospheric concentration derived from cloud water is higher than the corresponding aerosol concen-tration. On average, the concentration in cloud is three times higher than that observed in the aerosol phase. This can result from (i) the limited sampling of the largest and less concen-trated droplets that account for a non negligible fraction of the LWC, and (ii) the significant contribution from soluble gaseous compounds.
This last hypothesis is supported by a comparison of the average composition of cloud water and aerosol particles as shown in Fig. 5. The aerosol composition in this figure is derived from the results of Sellegri et al. (2003a). The most striking difference between aerosol and cloud compositions concerns the much larger contribution of organic carbon to the aerosol phase. On average, OC (including non-soluble OC) represents 45% of the total mass in the aerosol phase, while it accounts for just 23% in the aqueous phase. This difference is confirmed for the three air mass categories. As
Table 6. Classification of cloud water and aerosol particles in free troposphere at PDD summit.
Aerosol (Sellegri et al., 2003a) Cloud water (this work)
Label Thresholds Description Label thresholds Atmospheric Description (ionic mass) (ionic mass) concentration
Background <1 µg m−3 •presence of sea salt Background 15 mg l−1 <4 µg m−3 •presence of sea salt
BG •neutral or alkaline BG •low contribution of
•relatively higher nitrate and sulphate
OC content •less acidic
•low EC/OC ratio •relatively higher DOC
Anthropogenic 1 µg m−3 •abundance of nitrate, Anthropogenic 15 mg l−1 4 µg m−3 •abundance of nitrate
ANT <C< sulphate and ammonium influenced <C< <C< •more acidic 5 µg m−3 •acidic ANT 40 mg l−1 15 µg m−3 •DOC less important
•OC less important
•higher EC/OC ratio
Special Events >5 µg m−3 •one event at 20 µg m−3 Polluted >40 mg l−1 >15 µg m−3 •very high TIC (160 mg l−1)
Continental •low OC SpE •abundance of nitrate,
SpE •abundance of nitrate sulphate and ammonium
•acidic (82% of solutes)
•low DOC contribution
•DCA more concentrated
•MCA less concentrated
Special events >5 µg m−3 •very high dust, Ca++ No occurrence
Saharan dust and nssK+content
SpE •very low OC
•abundance of nitrate
shown by Sellegri et al. (2003b), the OC fraction of the aerosol is not scavenged efficiently by clouds. Moreover, both aerosol and cloud phases show a decrease in OC con-tribution with an increase in the degree of air mass pollution. Another indication of the reduced CCN properties of or-ganic aerosols is the fact that the contribution of ionic OC in the liquid phase is dominated by carboxylic acids, account-ing for 36% of DOC. However, carboxylic acids account for less than 3% of OC in the aerosol phase, which corresponds to 8% of the total solute concentration in droplets and 1.2% of the total mass in the aerosol phase.
Among organic acids, oxalic acid is the most abundant in the aerosol phase (22 ng m−3, 52% of total CA), followed by formic (11 ng m−3)and acetic (2 ng m−3), while formic and acetic acids are dominant in the cloud phase. Clearly, gas-phase CA contribute to a large fraction of the OC present in the droplets.
Similarly, marine species are more concentrated in the liq-uid phase (11% of the TIC) than in the aerosol phase (less than 5% of ionic mass). The high correlation coefficient be-tween Na+and Cl−(R2=0.98) and the molar ratio Na/Cl of 0.81 (very close to 0.86 of sea water) confirms the marine origin of these species. The major difference between the 2 reservoirs may be due to the presence of dissolved HCl in droplets, as shown by Sellegri et al. (2003c): the lack of Cl
in aerosol phase is due to evaporation of Cl in form of HCl and its solubilisation back in presence of liquid water.
Finally, as expected for species present in both the gas and aerosol phases, the contribution of NO−3 is higher in clouds (32%) than in aerosols (13%). An interesting feature is the fact that the contribution of gas-phase NO−3 to cloud water appears to be relatively higher for background samples than for anthropogenic samples. NO−3 cloud/NO−3 aerosol decreases gradually from 2.9 in background conditions to 1.7 in an-thropogenic samples, and to 1.0 in special events. The same trend from BG to ANT is exhibited for species that have a large gas phase fraction (NH+4 from 3 to 1.4; SO2−4 from 1.4 to 0.7; CA vary less widely from 3 in BG, 2.8 in ANT, and 2.7 in SpE), while the sum of the other ions display an inverse trend (from 1.2 in BG to 1.6 in ANT and SpE).
3.4 Relationship with cloud microphysics
M¨oller et al. (1996), Elbert et al. (2000) and Kasper-Giebl et al. (2000) provided experimental support for early theo-retical considerations concerning an inverse relationship be-tween ionic content in cloud or fog water and the respective LWC (Junge, 1963). This does not appear to be the case in our study of cloud climatology. The cloud LWC at PDD does not show significant fluctuation, either within a single
µµµµ ! " #$ %& µµµµ #µµµµ '' ' ( ' ! " ( ) * +#µµµµ ' ' ! " '
Fig. 5. Bulk aerosol composition (in µg m−3)for ionic and organic compounds for the three different types of aerosol at PDD (modified from Sellegri et al., 2003a).
0 10 20 30 µµµµ 2 3 4 5 6 7 8 0 1 2 3 4 µµµµ 2 3 4 5 6 7 8
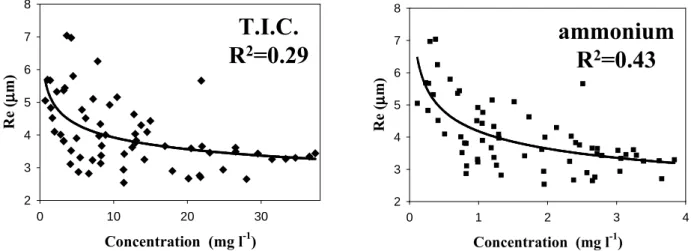
Fig. 6. Correlation between effective radius of droplets (Re) and concentrations of all ions and ammonium.
cloud event or between events. Overall LWC values range from 0.06 to 0.58 g m−3, with 50% of the values being in the range 0.19 to 0.32 g m−3. This variability is much less important than that measured by previous authors, who re-ported inverse correlation (still weak, R2=0.52 in M¨oller et al., 1996) that were driven mostly by events with very low and very high LWC.
The very high contribution of gas-phase species in PDD clouds limits the correlation between cloud water solute con-centration and LWC that is expected from nucleation scav-enging. To some degree, a weak relationship exists between total aerosol number measured by CPC (NCPC) and TIC (in µeq l−1) (R2=0.30) or CWL (R2=0.52). The chemical species that drives this correlation is sulphate, displaying the highest coefficient of correlation (R2=0.69). Higher NCPC leads to more, but smaller droplets, with the droplet radius being inversely proportional to the NCPC(R2=0.68).
The NCPCcorrelations are somewhat concordant with the findings of Elbert et al. (2000), who proposed the use of CWL, rather than TIC, as a diagnostic parameter for (i) the characterization of the local and regional degree of
an-thropogenic pollution, and (ii) the large-scale comparison of chemical components in cloudy environments. However, the weakness of the correlations within the measured range of LWC values results in a very high uncertainty associated with estimations of CWL (or TIC) that are only derived from aerosol parameters.
Instead, the liquid concentration is a power function of droplet radius (Re), with a correlation of R2=0.29; among the solutes, NH+4 has the highest correlation with Re (R2=0.43), followed by NO−3 (R2=0.33) (see Fig. 6). It is interesting to note that atmospheric concentrations are driven particularly by aerosol particle concentration, while liquid concentrations are affected by the droplet dimension due to the stronger ef-ficiency of gas transfer with the higher surface-to-volume ra-tio. In fact, NH+4 in cloud water originates predominantly from the gas phase, while the contribution of SO2−4 is high-est from aerosol particles (Sellegri et al., 2003c).
4 Conclusions
We have derived a representative data set for chemical com-position of clouds at PDD in winter/spring. Three differ-ent kinds of clouds were recognized and classified in the free continental troposphere: background continental (BG), anthropogenic influenced (ANT), and special events (SpE). This classification is consistent with the aerosol classifica-tion proposed by Sellegri et al. (2003a), whilst acknowledg-ing that the Saharan events detailed in the aforementioned study were not sampled during our sampling period.
• BG samples are characterized by low solute content (<18 mg l−1); these concentrations are similar to those of European high altitude sites that are far from local sources of pollution. The contribution of nitrate and sul-phate to the TIC (44%) is relatively limited, and does not confer a strong acidic character to cloud water. The contribution of Dissolved Organic Carbon to the solute concentration is surprisingly high (28%), due mostly to the presence of mono-carboxylic acids (9%). This kind of cloud is the most common during the wintertime.
• ANT samples have solute content values ranging from 18 mg l−1to 50 mg l−1; these concentrations are slightly lower than ionic concentrations measured at mountain sites under the influence of medium range pollution, such as Great Dun Fell, Aubure in the Vosges Moun-tains, Whiteface Mountain, and in the eastern part of the United States. These samples are more acidic than BG samples, due mainly to the higher levels of nitrate (36%). The presence of high levels of nitrate is also observed in the aerosol phase (Sellegri at al., 2003a). The contribution of DOC (21%) to solute concentration decreases from BG to ANT due to a decrease in the con-tribution of both DOC and carboxylic acids. The long-range transport of atmospheric pollutants, mostly from northern Europe, has a substantial impact on the chem-istry of continental clouds.
• SpE samples are infrequent, but they are found consis-tently at PDD. They are characterized by very high con-centrations, and exhibit TIC values up to 160 mg l−1. These very high concentrations are similar to those found in the much polluted regions of the Po Valley and the Czech Krusne Hory plateau, and are unexpected for samplings from a non-industrialized area. They are characterized not only by very high contributions of ni-trate and sulphate (63% overall), but also of ammonium (19%), which keeps the pH close to ANT levels (4.5– 5.5). The contribution of DOC in SpE samples is lim-ited to 13% of the solute concentration. These findings may be attributed to the long-range transport of polluted air masses coupled with strong vertical mixing from the boundary layer, where NH3emissions take place in the area of PDD.
Our results confirm the limited ability of organic compounds other than carboxylic acids to act as CCN. In addition, all cloud events are characterized by very high contributions from the gas phase to the liquid phase in cloud. This is evi-denced by the larger contributions of nitrate, ammonium and mono-carboxylic acids to the solute content of cloud water relative to their contribution to the aerosol phase. The strong contribution of gases limits the establishment of the corre-lation between cloud water solute concentration and cloud microphysics (in particular LWC) that is expected from pure nucleation scavenging. This is contrary to the conclusions of M¨oller et al. (1996), Elbert et al. (2000) and Kasper-Giebl et al. (2000), though these authors did consider a larger range of LWC values. Regardless, the correlations of TIC and CWL with NCPC in the present study confirm that CWL can be used (i) as a diagnostic parameter for the characterization of the local and regional degree of anthropogenic pollution, and (ii) for large-scale comparison of chemical components in cloudy environments. Such a proposal is supported by the research of Elbert et al. (2000).
Acknowledgements. This work was supported by CNRS-INSU un-der the National Program for Atmospheric Research (PNCA) and by the Minist`ere de la Recherche under ACI-Jeune Chercheur to PL and ACI-ORE-BEAM project. Authors acknowledge additional financial support from the scientific council of region Auvergne and from Observatoire de Physique du globe de Clermont-Ferrand (OPGC). A. Marinoni acknowledges the financial support of Con-siglio Nazionale delle Ricerche.
The authors gratefully acknowledge the NOAA Air Re-sources Laboratory (ARL) for the provision of the HYS-PLIT transport and dispersion model and/or READY website (http://www.arl.noaa.gov/ready.html) used in this publication.
Edited by: N. Mihalopoulos
References
Aneja, V. P., Claiborn, C. S., Bradow, R. L., Paur, R. J., and Baum-gardner, R. E.: Dynamic chemical characterisation of montain clouds, Atmos. Environ., 24A, 563–572, 1990.
Aneja, V. P.: Organic Compounds in Cloud Water and their Deposi-tion at a Remote Continental Site, Air & Waste, 43, 1239–1244, 1993.
Baltensperger, U., Schwikowski, M., Jost, D. T., Nyeki, S., G¨aggeler, H. W., and Poulida, O.: Scavenging of atmospheric constituents in mixed phase clouds at the high-alpine site Jungfraujoch, Part I: Basic concept and aerosol scavenging by clouds, Atmos. Environ., 32, 3975–3983, 1998.
Brantner, B., Fierlinger, H., and Puxbaum, H.: Cloud water chemistry in the subcooled droplet regime at Mount Sonnblich (3106 m a.s.l., Salzburg, Austria), Water, Air and Soil Pollution, 74, 363–384, 1994.
Bridges, K. S., Jickells, T. D., Davies, T. D., Zeman, Z., and Hunova, I.: Aerosol, precipitation and cloud water chemistry ob-servations on the Czech Krusne Hory plateau adjacent to a heav-ily industrialised valley, Atmos. Environ., 36, 353–360, 2002.
Calvert, J. G., Lazrus, A. L., Kok, G. L., Heikes, B. G., Walega, J. G., Lind, J., and Cantrell, C. A.: Chemical mechanisms of acid generation in troposphere, Nature, 317, (6032), 27–35, 1986. Cappiello, A., De Simoni, E., Fiorucci, C., Mangani, F., Palma, P.,
Trufelli, H., Decesari, S., Facchini, M. C., and Fuzzi, S.: Molecu-lar Characterization of the Water-Soluble Organic Compounds in Fogwater by ESIMS/MS, Environ. Sci. Technol., 37, (7), 1229– 1240, 2003.
Chameides, W. L. and Davis D. D.: Aqueous phase source of formic acid in clouds, Nature, 304, 427–429, 1983.
Chandler, A. S., Choularton, T. W., Dollard, G. J., Gay, M. J., Hill, T. A., Jones, A., Jones B. M. R., Morse, A. P., Penkett, S. A., and Tyler, B. J.: A field study of the cloud chemistry and cloud microphysics at Great Dun Fell, Atmos. Environ., 22, 683–694, 1988a.
Chandler A. S., Choularton, T. W., Dollard G. J., Eggleton, A. E. J., Gay, M. J., Hill, T. A., Jones, B. M. R., Tyler, B. A., Bandy, B. J., and Penkett, S. A.: Measurements of H2O2and SO2in cloud
and estimates of their reaction rate, Nature 336, 562–565, 1988b. Chebbi, A. and Carlier P.: Carboxylic acids in troposphere, occur-rence, sources and sinks: a review, Atmos. Environ., 23, 999– 1007, 1996.
Collett, J., Oberheolzer, B., and Staehlin, J.: Cloud chemistry at Mt. Rigi, Switzerland: dependence on drop size and relationship to precipitation chemistry, Atmos. Environ., 27A, 33–42, 1993. Collett, J., Iovinelli, R., and Demoz, B.: A three-stage cloud
im-pactor for size resolved measurement of cloud drop chemistry, Atmos. Environ., 29, (10), 1145–1154, 1995.
Collett, J. L., Hoag, K. J., Rao, X., and Pandis, S. N.: Internal acid buffering in San Joaquin Valley fog drops and its influence on aerosol processing, Atmos. Environ., 33, (29), 4833–4847, 1999. Decesari, S., Facchini M. C, Matta, E., Lettini, F., Mirccea, M., Fuzzi, S., Tagliavini, E., and Putaud, J.-P.: Chemical features and seasonal variation of fine aerosol water-soluble organic com-pounds in the Po Valley, Italy, Atmos. Environ., 35, 3691–3699, 2001.
Dupuy, R., Sellegri, K., and Laj, P.: Empirical relationship between aerosol number and cloud microphysical properties, in Atmo-spheric Chemistry within the Earth System: from regional pol-lution to global change, 7th Conference of the IGAC Heraklion, Crete, 18–25 September 2002.
Elbert, W., Hoffmann, M. R., Kr¨amer, M., Schmitt, G., and An-dreae, M. O.: Control of solute concentrations in cloud and fog water by liquid water content, Atmos. Environ., 34, 1109–1122, 2000.
Erel, Y., Pehkonen, S. O., and Hoffmann M. R.: Redox chemistry of iron in fog and stratus clouds, J. Geophys. Res., 98, (D10), 18 423–18 434, 1993.
Flossmann, A. I.: Cloud Ice Mountain Experiment (CIME), Fi-nal report of CEE, contract ENV4-CT95-0012, Aubi`ere, France Laboratoire de M´et´eorologie Physique, 112, 2000.
F¨uhrer, J.: Chemistry of fogwater and estimated rates of occult de-position in an agricultural area of Central Switzerland, Agric. Ecosyst. Environ., 1986.
Fuzzi, S.: Radiation fogchemistry and microphysics, in Chemistry of Multiphase Atmospheric Systems, edited by Jaeschke, W., Springer, Berlin, 213–226, 1986.
Fuzzi, S., Orsi, G., Nardini, G., Facchini, M. C., McLaren, S., McLaren, E., and Mariotti, M.: Heterogeneus processes in the Po
Valley radiation fog, J. Geophys. Res., 93, (D9), 11 141–11 151, 1988.
Fuzzi, S., Facchini, M. C., Orsi, G., Lind, J. A., Wobrok, W., Kessel, M., Maser, R., Jaeschke, W., Enderle, K. H., Arends, B. G., Berner, A., Solly, I., Kruisz, C., Reischl, G., Pahl, S., Kaminski, U., Winkler, P., Ogren, J. A., Noone, K., Hallberg, A., Grieser, J., Fierlinger-Oberlinninger, H., Puxbaum, H., Marzorati, A., Hans-son, H. C., Wiedensohler, A., SvenningsHans-son, I. B., MartinsHans-son, B. G., Schell, D., and Georgii, H. W.: The Po Valley Fog Exper-iment 1989, an overview, Tellus, 44B, 545–555, 1992.
Fuzzi, S. and Zappoli, S.: The organic component of fog droplets, in 12th International Conference on Clouds and Precipitation, 1996. Fuzzi, S., Laj, P., Facchini, M. C., Ricci, L., and Berner, A.: Size-dependant chemistry of fog and cloud droplets, in First Interna-tional conference on fog and fog collection, Vancouver, Canada, edited by Schemenauer, R. S. and Bridgam, H., 1998.
Gervat, G. P, Kallend, A. S., and Marsh, A. R. W.: Composition and origin of cloudwater solutes, in: Physico-Chemical behaviour of Atmospheric Pollutants, edited by Versino, B. and Angeletti, G., Reidel, Dordrecht, 506–516, 1984.
Glotfelty, D. E., Seiber, J. N., and Liljedahl, L. A.: Pesticides in fog, Nature, 325, 602–605, 1987.
Hadi, D. A., Crossley, A., and Cape, J. N.: Particulate and Dissolved Organic Carbon in cloud water in Southern Scotland, Environ. Pollut., 88, 299–306, 1995.
Hegg, D. A. and Hobbs, P. V.: Sulphate and nitrate chemistry in cumuliform clouds, Atmos. Environ., 20, 901–909, 1986. Herckes, P., Mirabel, P., and Wortham, H.: Cloud water deposition
at high-elevation site in the Vosges Mountains (France), Sci. To-tal Environ., 296, 59–75, 2002.
Herckes, P., Hannigan, M. P., Trenary, L., Lee, T., and Collett Jr., J. L.: The organic composition of radiation fogs in Davis (Califor-nia), Atmos. Res., 64, 99–108, 2002.
Hitzenberger, R., Berner, A., Kromp, R., Kasper-Giebl, A., Lim-beck, A., Tscherwenka, W., and Puxbaum, H.: Black car-bon and other species at a high-elevation European site (Mount Sonnblick, 3106 m, Austria): Concentrations and scavenging ef-ficiencies, J. Geophys. Res., 105, (D20), 24 637–24 645, 2000. Jacob, D. J.: Fogwater collector design and characterization,
Envi-ron. Sci. Technol., 18, 827–833, 1984.
Jacob, D. J., Munger J. W., Waldman J. M., and Hoffmann M. R.: The H2SO4, HNO3, NH3system at high humidities and in fogs: I. Spatial and temporal patterns in San Joaquin Valley of Califor-nia, J. Geophys. Res., 91, 1073–1088, 1986.
Jacob, D. J., Shair, F. H., Waldman, J. M., Munger, J. W., and Hoff-mann M. R.: Transport and oxidation of SO2in a stagnant foggy
valley, Atmos. Environ., 21, 1305–1315, 1987.
Jaeschke, W.: Chemistry of Multiphase Atmospheric Systems, Springer, Berlin, 1986.
Jaffrezo, J.-L., Calas, N., and Bouchet, M.: Carboxylic acid mea-surements with ionic chromatography, Atmos. Environ., 32, 2705–2708, 1998.
Junge, C. E.: Air Chemistry and Radioactivity, Academic Press, New York/London, 1963.
Kasper-Giebl, A., Koch, A., Heitzemberg, R., and Puxbaum, H.: Scavenging efficiency of “aerosol carbon” and sulphate in super cooled clouds at Mount Sonnblick (3106 m a.s.l., Austria), J. At-mos. Chem., 35, 33–46, 2000.
characteri-sation of three summer cloud episodes ay Witheface Mountain, Chemosphere, 31, (5), 3357–3381, 1995.
Krivacsy, Z., Kiss, G., Varga, B., Galambos, I., Sarvari, Z., Ge-lencser, A., Molnar, A., Fuzzi, S., Facchini, M. C., Zappoli, S., Andracchio, A., Alsberg, T., Hansson, H.-C., and Persson, L.: Study of humic-like substances in fog and interstitial aerosol by size-exclusion chromatography and capillary electrophoresis, Atmos. Environ., 34, 4273–4281, 2000.
Kruisz, C., Berner A., and Brantner, B.: A cloud water sampler for high wind speeds, Proceedings of the EUROTRAC Symposium 1992, edited by Borrell, P. M., SPB Acad., The hague Nether-lands, 523–525, 1993.
Laj, P., Fuzzi, S., Facchini, M. C., Orsi, G., Berner, A., Kruisz, C., Wobrock, W., Beswick, K. M., Gallagher, M. W., Colvile, R. N., Choularton, T. W., Nason, P., and Jones, B.: Experimental evidences for in-cloud production of aerosol sulphate, Atmos. Environ., 31, (16), 2503–2514, 1997a.
Laj, P., Fuzzi, S., Facchini, M. C., Lind, J. A., Orsi, G., Preiss, M., Maser, R., Jaeschke, W., Seyffer, E., Arends, B. G., M¨olls, J. J., Acker, K., Wieprecht, W., M¨oller, D., Colville, R. N., Gallagher, M. W. Beswick, K. M., Hargreaves, K. J., Storeton-West, R. L., and Sutton, M. A.: Cloud processing of soluble gas, Atmos. En-viron., 31, 2589–2592, 1997b.
Laj, P., Flossman, A. I., Wobrock, W., Fuzzi, S., Orsi, G., Ricci, L., Mertes, S., Swarzenbock, A., Heitzenberg, J., and Ten Brink, H.: Behaviour of H2O2, NH3, and black carbon in mixed-phase clouds during CIME, Atmos. Res., 58, 315–336, 2001.
Lanquette, A.-M., Pichon, J.-M., and Pointin, Y.: Physical-chemistry data of the Puy de Dˆome top station, http://www.obs. univ-bpclermont.fr/observ/chimie/pdd listedata.html, 2002. Lawrence, M. G. and Crutzen, P. J.: The impact of cloud
parti-cle gravitational settling on soluble trace gas distribution, Tellus, 50B, (3), 263–289, 1998.
Lelieveld, J. and Crutzen, P. J.: The role of clouds in tropospheric photochemistry, J. Atmos. Chem., 12, 229–267, 1991.
Liang, J. and Jacobson, M. Z.: A study of sulphur oxidation path-ways over a range of liquid water contents, pH values and tem-perature, J. Geophys. Res., 104, 13 749–13 769, 1999.
Limbeck, A. and Puxbaum, H.: Dependence of in-cloud scavenging of polar organic aerosol compounds on the water solubility, J. Geophys. Res., 105, 19 857–19 867, 2000.
L¨oflund, M., Kasper-Giebl, A., Schuster, B., Giebl, H., Heitzem-berg, R., and Puxbaum, H.: Formic, Acetic, Oxalic, Malonic and Succinic Acid Concentrations and their Contribution to Organic Carbon in Cloud Water, Atmos. Environ., 36, (9), 1553–1558, 2002.
Mertes, S., Schwarzenb¨ock, A., Laj, P., Wobrock, W., Pichon, J. M., Orsi, G., and Heintzenberg, J.: Changes of cloud microphysical properties during the transition from supercooled to mixed-phase conditions during CIME, Atmos. Res., 58, (4), 267–294, 2001. M¨oller, D., Acker, K., and Wieprecht, W.: A relationship between
liquid water content and chemical composition in clouds, Atmos. Res., 41, 321–335, 1996.
Munger, J. W., Jacob, D. J., Waldman, J. M., and Hoffmann, M. R.: Fogwater chemistry in a urban atmosphere, J. Geophys. Res., 88, 5109–5121, 1983.
Novakov, T. and Penner, J. E.: Large Contribution of Organic Aerosols to Cloud-Condensation-Nuclei Concentrations, Nature, 365, 823–826, 1993.
Pili´e, R. J., Mack, E. J., Koemond, W. C, Eadie, W. J., and Rogers, C. W.: The life cycles of valley fog, Part II: Fog microphysics, J. Appl. Meteorol., 14, 364–374, 1975.
Poulida, O., Schwikowski, M., Baltensperger, U., Staehelin, J., and Gaeggeler, H. W.: Scavenging of atmospheric constituents in mixed phase clouds at the high alpine site Jungfraujoch-Part II: influence of riming on the scavenging of particulate and gaseous chemical species, Atmos. Environ., 32, (23), 3985–4000, 1998. Pruppacher, H. R. and Jaenicke, R.: The processing of water vapour
and aerosols by atmospheric clouds, a global estimate, Atmos. Res., 38, 283–295, 1995.
Schaap, M., M¨uller, K., and Ten Brink, H. M.: Constructing the Eu-ropean aerosol nitrate concentration field from quality analysed data, Atmos. Environ., 36, (8), 1323–1335, 2002.
Sellegri, K., Laj, P., Peron, F., Dupuy, R., Legrand, M., Preunkert, S., Putaud, J.-P., Cachier, H., and Ghermandi, G.: Mass balance of free tropospheric aerosol at the Puy de Dˆome (France) in win-ter, J. Geophys. Res., 108, (D11), 4333, 2003a.
Sellegri, K., Laj, P., Dupuy, R., Legrand, M., Preunkert, S., and Putaud, J.-P.: Size-dependent scavenging efficiencies of multi-component atmospheric aerosols in clouds, J. Geophys. Res., 108, (D11), 4334, 2003b.
Sellegri, K., Laj, P., Marinoni, A., Dupuy, R., Legrand, M., and Preunkert, S.: Contribution of gaseous and particulate species to droplet solute composition and concentration, Atmos. Chem. Phys., 3, 479–519, 2003c.
Voisin, D., Legrand, M., and Chaumerliac, N.: Scavenging of acidic gases (HCOOH, CH3COOH, HNO3, HCl, and SO2)and
ammo-nia in mixed liquid-solid water clouds at the Puy de Dˆome moun-tain, J. Geophys. Res., 105, (D5), 6817–6836, 2000.
Warneck, P.: The equilibrium distribution if atmospheric gases be-tween the two phases of liquid water clouds, in Chemistry of the Multiphasic Atmospheric Systems, NATO ASI Series, Vol. G6, edited by Jaeschke, W., Springer, Berlin, 1986.
Weathers, K. C., Likens, G. E., Bormann, F. H., Bicknell, S. H., Bormann, B. T., Daube, B. C., Eaton, J. S., Galloway, J. N., Keene, W. C., Kimball, K. D., McDowell, W. H., Siccama, T. G., Smiley, D., and Tarrant, R. A.: Cloudwater Chemistry from Ten Sites in North America, Environ. Sci. Technol., 22, 1018–1026, 1988.
Wobrock, W., Schell, D., Maser, R., Jaeschke, W., Georgii, H.-W., Wieprecht, W., Arends, B. G., M¨ols, J. J., Kos, G. P. A., Fuzzi, S., Facchini, M. C., Orsi, G., Berner, A., Solly, I., Kruisz, C., Svenningsson, I. B., Wiedensohler, A., Hansson, H.-C., Ogren, J. A., Noone, K. J., Hallberg, A., Pahl, S., Schneider, T., Winkler, P., Winiwarter, W., Colvile, R. N., Choularton, T. W., Flossmann, A. I., and Borrmann, S.: The Kleiner Feldberg Cloud Experiment 1990, An overview, J. Atmos. Chem., 19, 3–35, 1994.