HAL Id: hal-00305623
https://hal.archives-ouvertes.fr/hal-00305623
Submitted on 17 Jan 2007HAL is a multi-disciplinary open access archive for the deposit and dissemination of sci-entific research documents, whether they are pub-lished or not. The documents may come from teaching and research institutions in France or abroad, or from public or private research centers.
L’archive ouverte pluridisciplinaire HAL, est destinée au dépôt et à la diffusion de documents scientifiques de niveau recherche, publiés ou non, émanant des établissements d’enseignement et de recherche français ou étrangers, des laboratoires publics ou privés.
P.-M. M. Schuwerack, M. Neal, C. Neal
To cite this version:
P.-M. M. Schuwerack, M. Neal, C. Neal. The Dart estuary, Devon, UK: a case study of chemi-cal dynamics and pollutant mobility. Hydrology and Earth System Sciences Discussions, European Geosciences Union, 2007, 11 (1), pp.382-398. �hal-00305623�
under a Creative Commons License.
The Dart estuary, Devon, UK: a case study of chemical dynamics
and pollutant mobility
P.-M.M. Schuwerack
1, M. Neal
2and C. Neal
2 1Britannia Royal Naval College, Dartmouth, Devon, TQ6 0HJ, UK2Centre for Ecology and Hydrology, Wallingford, Oxfordshire, OX10 8BB, UK
Email for corresponding author: MS@brnc.ac.uk
Abstract
Water, sediments and gill and digestive gland tissues of adult common shore crab (Carcinus maenas), collected at Noss Marina, Sandquay (Britannia Royal Naval College), the Dartmouth Pier, Warfleet Cove and Sugary Cove in the Dart estuary, Devon, UK, were analysed for major, minor and trace elements in spring 2004. Total acid-available measurements analysed included the truly dissolved component and acid-available sediments. Trace metal concentrations are associated largely with particulate and micro-particulate/colloidal phases, the latter being able to pass through standard filter papers. Wide ranges of chemical concentrations were found in the water, sediments and tissues at all the locations. In the water column, 48% of the variance is linked to the sea-salt component (Cl, Na, K, Ca, Mg, B, Li and Sr) and the sediment-associated acid-available fractions are linked to Fe-rich lithogenous materials (Ba, Co, Cu, Fe, Mn, V and Zn). In the sediments, trace elements of Cd, Co, Cr, Fe, Pb, Mn, Ni and V are correlated with the sea salts and associated with the fraction of fine sediments within the total sediment. In the gills and the digestive gland tissues of crabs, high concentrations of Al, Cu and Fe are found and there are correlations between acid-available trace metals of Cu, Cr, Fe, Mn, Ni, Sr and Zn. The relationships between trace metal contaminants, their site-specific concentrations, their temporal and spatial variability and the effects of human activities, such as moorland/agriculture with historic mining and recreational activities in the lower Dart estuary, are discussed.
Keywords: Dart, estuary, chemical dynamics, trace metals, aluminium, cadmium, copper, lead, zinc, sediments, uptake, bioaccumulation,
gills, digestive gland, common shore crab, Carcinus maenas, bioindicator.
Introduction
For over a century, the effects of pollution on estuarine organisms have been observed, and concerns have grown significantly, both nationally and globally, in recent years (Schuwerack, 1994; Linville et al., 2002; Matthiessen and Law, 2002). Severe oxygen depletion and increased inputs of untreated organic matter from urbanisation following the industrial revolution have had a deleterious effect on the aquatic biota (Neal, 2001; Burton, 2003). Notwithstanding the introduction of sewage treatment works (Clean Rivers (Estuaries and Tidal Waters) Act 1960; Control Pollution Act 1974), continuous and sporadic impacts on fish and invertebrates have persisted in many UK rivers and estuaries. Contaminants can exert toxic effects and sub-lethal changes in aquatic biota, and complex water-sediment-biota interactions occur on both micro and macro scales in the environment. Legislation has been produced in the UK and within the European Community as a driver for combating
ecological deterioration (e.g. the Environmental Protection Act 1990 and European Community Directive on Integrated Pollution, Prevention and Control (96/61/EEC)). Furthermore, to minimise the impacts on the aquatic environment, the concept of Integrated Pollution Control was introduced (Schratzberger et al., 2000; Matthiessen and Law, 2002; Schuwerack, 2002). Yet, in 1998, the National Monitoring Programme (NMP), in its first report, concluded that pollutant concentrations had decreased and rejected the link between pollutants and a decline in fisheries and wildlife (Matthiessen and Law, 2002). Indeed, estuary quality has been deemed to have improved over time with only nine UK estuaries still being classified as bad or poor. However, the classification scheme describing the water quality of an estuary is crude, based as it is only on dissolved oxygen concentrations, aesthetic quality and basic biological quality (EA, 1999; Matthiessen and Law, 2002). At the same time, the fishing industry, blamed for the decline in fish and
to 40% of the biomass in the North Sea (Parret, 1998; EA, 1999). This compounded the view that, because many contaminants had decreased since the industrial revolution, contaminant impact was minor when compared to that of fishing. Nonetheless, little consideration was given either to the diversity of riverine habitats or to the wide range of pollutant types within polluted rivers and estuaries.
Contamination within rivers and estuaries can relate to historic and contemporary sources (Neal, 2001). Indeed, for substances such as micro-organics, there may be a legacy of pollution, while some new compounds are environmentally problematic and for metals there are issues of leakage from spoil tips and decommissioned mines (Neal, 2001, 2003). Furthermore, the analysis was at best naïve owing to the complex interactions of the topography of the river and estuary and physico-chemical factors governing the bioavailability and the wide range of target species to be considered (Schuwerack et al., 2001; Matthiessen and Law, 2002). For example, in the more quiescent areas of a river and estuary, dissolved contaminants at high concentrations in the water column may be adsorbed in high concentrations to fine-grained sediments, while at low concentrations sediment-bound contaminants may enter the water column (Matthiessen and Law, 2002; Lakhan et al., 2003; Zhou et al., 2004; Wu et al., 2005). Routine monitoring of water quality and sediments may miss areas of particularly high contaminant concentrations, so that the overall classification may be inappropriate. Indeed, the EU Water Framework Directive, focused as it is on the catchment scale, does not consider sediment quality and quantity to be an issue (EA, 2005; Westrich and Förstner, 2005). Furthermore, the effects of bioturbation and diffusional gradients within the sediments. associated with diverse behaviours throughout the aquatic food chain such as scavengers and filter-feeders, often have not been considered (Paarlberg et al., 2005). Thus, measuring only dissolved contaminants excludes the fraction of trace contaminants adsorbed to sediments and may lead to erroneous conclusions over flux transfers, critical pathways and environmental risks (Long et al., 1998; Newman et al., 2002).
Contaminants, their bioavailability and their effects on aquatic communities or ecosystems may be identified by examining the responses of sedentary benthic species, the choice of which depends upon their availability, position and niches within the food web (Attrill and Depledge, 1997; Schuwerack et al., 2001). Macrobenthic invertebrates are suitable bioindicator species, due to the site fidelity of such benthic feeders (Warwick 1986, 1993; Gray et al., 1990). The uptake via food or water has been studied extensively
Schuwerack, 2002). However, uptake and accumulation of contaminants vary according to their availability, i.e. their speciation in the aquatic environment and the physiological state of the organism (Bryan, 1979; Engel et al., 1981; Schlekat et al., 2002; Schuwerack, 2002). Trace metal accumulation in the biota can often be highly variable from species to species and with diurnal and seasonal cycles (Bryan, 1979; Engel et al., 1981; Schuwerack, 2002). Metal uptake and accumulation may differ with the nutritional state, age, size and sex of the animal (Leung and Furness, 2000; Schuwerack, 2002), while metal fluctuations in crustaceans exhibit periodisms due to their moult cycle (Bryan, 1979; Engel and Brouwer, 1987; Taylor and Anstiss, 1999). Although the uptake of contaminants via food or water has been studied extensively in marine crustacean species (Eisler, 1987; Depledge and Rainbow, 1990), studies of bioaccumulation in UK estuaries must be advanced (Bryan and Langston, 1992; Matthiessen and Law, 2002) before serious environmental risks can be assessed and remediation strategies determined.
Multidisciplinary research on the effects of complex interactions between meteorological, physical, chemical and geological processes on the aquatic biota is currently limited and does not encompass sufficient environmental variables that interact with the biota. Ecotoxicological data are often variable and in the past, this variability has often been played down. However, in the 1990s, ranges of responses, as opposed to mean response, were used by some workers to explain the intra- and inter-specific variability in benthic organisms, but the cause remained unexplained. To date, few studies give insight into the processes integrated within aquatic systems or the mobility of trace metals and other chemicals and their combined effects on these ecosystems (Schuwerack, 2002; Matthiessen and Law, 2002; Gueiros
et al., 2003; Westrich and Forster, 2005).
This paper describes a case study of a major UK river estuary in S.W. England, the Dart. Its catchment comprises an upper half of steep sided topography with moorland draining granitic rocks and a lowland agricultural half on carboniferous shales and sandstones (IH, 1998). In the upper catchment, historical contamination from mining activity occurs and this was associated with mineralisation from the granite to the adjacent country rock (Duff, 1992). Subsequently, much of the mining spoils have been fluvially transported as suspended sediments. In addition to the ecosystem damage from mining, anthropogenic inputs from local communities, farming and recreational activity, such as moored boats in summer, are thought to be the prime source of the elevated concentrations of trace metals and other chemicals in the Dart. There have been few scientific
studies in the Dart and chemical analyses for water and sediments are patchy and outdated (Thain et al., 2004). Apart from the long-term deployment in situ of a remote data logging system, there is no clear evidence of the fate of these pollutants or of any pollution in the Dart estuary; information is limited to currents, tidal streams, grain size, topography of the riverbed and borders (Thain et al., 2004), or bioavailability and bioaccumulation in the Dart and its estuary. The present study examines the relationship of major, minor, trace elements and nutrients in the water and sediments as well as in the uptake and storage organs of the common shore crab, the benthic macro-invertebrate,
Carcinus maenas, in the lower Dart estuary.
Study area
The River Dart in South Devon rises on acidic moorland overlying granite on Dartmoor, almost 600 m a.s.l. Its catchment area overall is approximately 500 km2 and its
average annual rainfall is over 2000 mm yr1. The acidity of
the 250 km2 of moorland soils in the upper catchment may
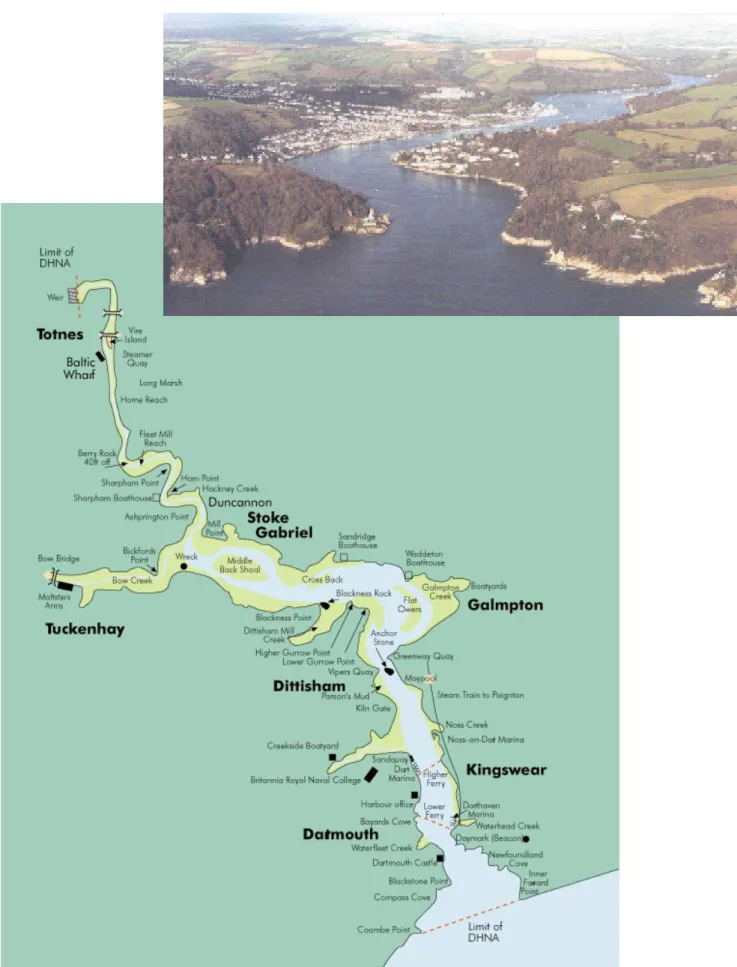
be exacerbated by atmospheric inputs (nitrogen and sulphur oxides) and by changes in land use (EA, 1998). The lower Estuary of the River Dart comprises a ria, formed during flooding of the Dart valley in the Holocene with subsidence of the landmass. (Kelly, 1982; Thain et al., 2004). In width, the Dart is less than 100 m near Totnes, 200 m at the steep-sided river estuary and 250350 m at its lowest reaches. The river is generally less than 14 m deep, with pools up to 25 m deep in the lower reaches near Dartmouth (Fig. 1) (Thain et al., 2004).
The tidal estuary extends inland as far as the weir at Totnes, 17 km from Castle point at the mouth of the Dart estuary. Mean flow velocity varies from less than 1 m3 sec1 to a mean
annual freshwater flood of 229.5 m3 sec1 at Austins Bridge
mid-way along the river. Annual rainfall and runoff are 1841 mm and 1410 mm, respectively, and the base flow index is 0.53 (IH, 1998). In summer, freshwater inflow to the estuary has been as low as 2 m3 sec1 and, in March,
flow rates have been typically 1520 m3 sec1(Thain et al.,
2004). The Dart has an asymmetric macro tidal regime with a spring and neap range of 5.2 m and 1.8 m, respectively. The duration of the flood tide is typically six and a half hours, with a characteristic flow velocity of 0.6 m s1 at
spring tides and 0.3 m s1 at neap tides. The ebb tide duration
is almost six hours and hence the flow exhibits marked ebb dominance (Thain et al., 2004). A v-shaped transient tidal intrusion front forms in the upper estuary during spring tides. This front may influence horizontal dispersion and residual circulation throughout the estuary and affect biological processes (Kuo et al., 1990; Thain et al., 2004).
Strong wave action at the entrance to the Darts estuary can occur with continuous strong southerly, south-easterly and easterly winds. Just above the estuary, the significant bends in the river limit the transmission of strong wave action although a longer wavelength swell regularly makes its way into the harbour. The bedrock of the Dart catchment consists largely of granite and Devonian slates. The shores in the estuary and the river are predominantly rocky and steep. The middle and inner parts of the estuary are characterised by intertidal mudflats, narrow shingle shores and some bedrock outcrops. Along Dartmouth and Kingswear up to Noss, the shores are almost all vertical man-made walls.
The river and its tributaries contain recent alluvium and gravel deposits and large amounts of sand, silt and clay derived from the breakdown of the catchments bedrock, the cliffs and the local seabed. Mineralised zones in the area are distributed in concentric belts around the granite intrusion in the upper part of the catchment. There is variation in the extent and nature of the mineralisation that is related to the thermal gradient at the time of the emplacement of the granite (Kelly, 1982). Percolating rainwater carrying carbon dioxide has caused secondary alterations of lode minerals above the water table and these zones have generally been eroded away or worked. While metalliferous mining and other mining activity at Whitecleaves Dolerite Quarry at Buckfastleigh have ceased, weathering of spoil tips of the ores of iron, copper, lead, zinc, tin, nickel and cobalt may release small amounts of metals into the drainage system (Kelly, 1982). However, Linhay Limestone Quarry at Ashburton still contributes high levels of suspended solids to local water sources (EA, 1998). Mean grain diameter correlates negatively with distance from the head of the estuary, indicating that the finer sediments were nearer the mouth of the Dart estuary (Kelly, 1982). Grain size distribution of clastic sediments is influenced by the physical processes of transportation and deposition. In riverine and estuarine sediments, with rapid shifts between erosion and deposition processes, variations in grain size are usually large. Increased trace metal sorption, often found with decreased grain size (Kelly, 1982, Lakhan
et al., 2003; Westrich and Förster, 2005), may not occur in
the Dart.
With the exception of Totnes, Dartmouth and some small villages, most of the land along the lower Dart is used for agricultural purposes (barley, maize and wheat to vines, orchards, cattle, sheep and pig grazing) with organic and inorganic fertilisers being used (Allen, 2001). The river and its estuary are used for recreational purposes, including sailing and other water sports, river cruising, fishing and crabbing (EA, 1997; Allen, 2001). Tributyltin (TBT)
pollution in the 1970s caused the closure of several oyster farms along the Dart and commercial growth of both oysters and mussels has had to be re-established in the last few years.
Materials and methods
Water, sediments and crabs were collected from mid-tide level (MTL) at five sites (Fig. 1) in the Dart estuary on two calm days, the 9th and 10th April 2004. Sites 1 to 3 are furthest
up river at Noss Marina (50°21.56N, 3°34.64W), Sandquay (50°20.56N, 3°34.7W) and Dartmouth Pier (50°21.65N, 3°34.6W), respectively. Warfleet, Site 4 (50°20.05N, 3°34.35W) and Sugary Cove, Site 5, (50°20.42N, 3°34.04W) lie within the river entrance to the estuary (Fig. 1).
Near the shore, water samples were collected 10 cm below the water together with 3 cm deep sediment cores from the surface of the riverbed. In addition, both female and male adult crabs (weight > 40 g, carapace width 5.0 ± 0.8 cm) were caught at the same locations, using small nets, baited with salmon and haddock fish pieces, attached to a fishing line. Sampling at each site was in triplicate. Background sediment and biology surveys were also made. The water, sediment and tissue sampled from the gills and digestive glands of the crabs were stored separately at 4°C in sterile polyethylene bottles for subsequent analyses. Each bottle was weighed to an accuracy of 0.1 mg prior to and after addition of water, sediments and tissues. Water samples were acidified to 1% v/v with concentrated Aristar grade nitric acid to allow acid leaching. The total acid-available fraction was determined. This fraction represents the truly dissolved, the microparticulate/colloidal component and the acid-available particulate fraction (Neal et al., 1997). Ten and 5 ml of 50:50 v/v ultra-pure water/concentrated Aristar grade nitric acid was added to each bottle containing, respectively, sediments and gill/digestive gland tissues. The samples were kept undisturbed in a cool place for several days to allow equilibration and the supernatant was subsequently analysed by inductively coupled plasma optical emission spectroscopy, using a Perkin-Elmer Dual View instrument to obtain major and minor element and trace metal concentrations. The instrument was calibrated with commercially available standards. Analytical quality control (AQC) samples were included at the beginning and end of each batch of samples, while other standards were run after every tenth sample to check for instrumental drift. The laboratory participates in several UK and international proficiency testing exercises such as that run by Aquacheck Ltd. For the sediments and tissues, concentrations are presented as g l1 or mg l1 wet weight respectively.
Results
The rocky shore of Sugary Cove (Site 5, Fig. 1), is biodiverse with a typically fucoid-dominated community and diverse types of green, red and brown algae, including Ulva,
Enteromorpha spp., Codium, Cladophora in the littoral zone
and Laminaria and Chorda spp. in the sub-littoral zone. Other predominant species in the littoral and supra-littoral zone included barnacle spp., chitons, sea anemones and snail spp.: Monodonta turbinata, Littorina spp. and Gibbula spp. A well-developed community of lichens was also present in the supra-littoral zone (Davies, 1991). The other four sites (Warfleet Cove, the Pier, Sandquay and Noss Marina; Fig. 1), are mudflats with a low species richness and a high biomass component.
The chemical analysis of water, sediments and tissues showed a high degree of variance in chemical concentrations (Tables 15).
CHEMICAL CONCENTRATIONS IN THE WATER OF THE LOWER DART ESTUARY
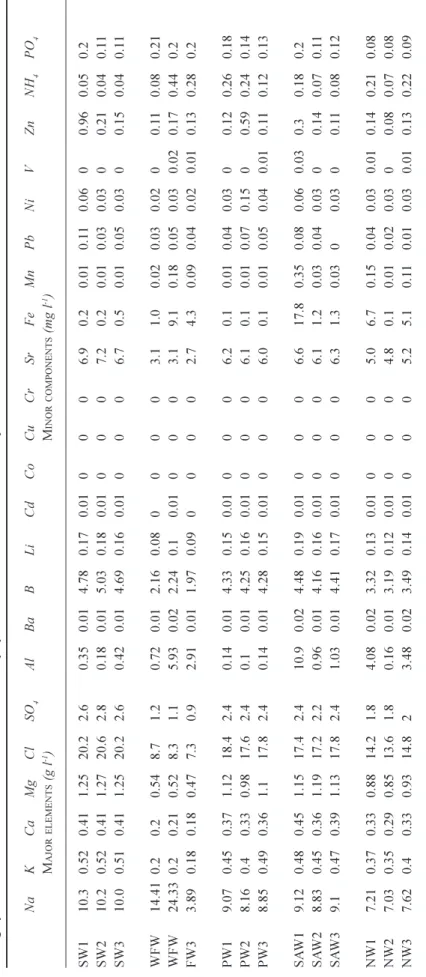
The total acid-available concentrations in the water column show high variability across all the sites (Table 1). Being estuarine waters, they are saline as reflected by the sea-salt components (Cl, Na, K, Ca, Mg, B, Li and Sr). The sea-salt concentrations generally decrease with distance from the river entrance due to dilution of the sea-water by the river water and their concentrations are highly correlated (p<0.001; Table 1). However, their concentrations were lowest at Warfleet cove (Site 4: Table 1). Factor analysis reveals that 48% of the variance is explained by the sea-salt components and, in all water samples, their concentrations vary systematically by a factor of three. Chloride concentrations, for example, vary between about 7.3 and 20.6 g l1 while the corresponding range for Na is 3.89 and
10.3 g l1 (Table 1). Sea-salt concentrations are
approximately normally distributed with the average and the median values being similar (Table 4).
In contrast to the sea-salts, the concentrations of the trace constituents are highly variable and the data are skewed, with median values typically much lower than the averages (Table 5). Aluminium and Fe have the highest averages, medians and ranges in concentration (2.1, 0.7 and 0.1 to 10.9 mg l1, and 3.2, 1.0 and 0.1 to 17.8 mg l1, respectively).
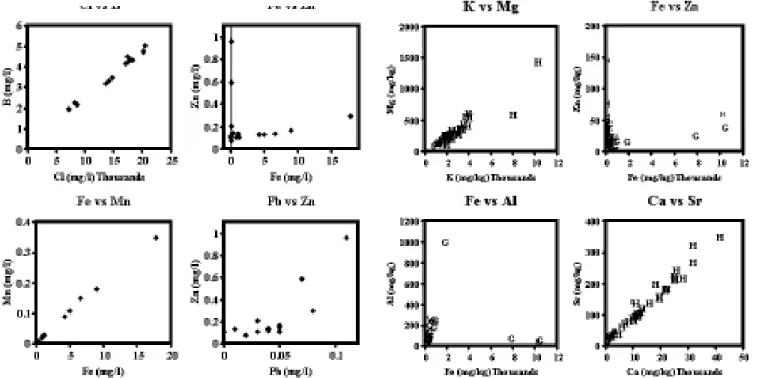
Strong linear relationships (p<0.001) occur between the trace metals that are associated with Fe and Al oxides in particulate matter (Al, Co, Cu, Fe, Mn, V: Fig. 2) and factor analysis indicates that 27% of the variance is explained by this group. There is correlation between the sea-salt and the trace metal groups (Fig. 2) and there are two distinct linear trends in the relationship. Among the trace metals, there is also a
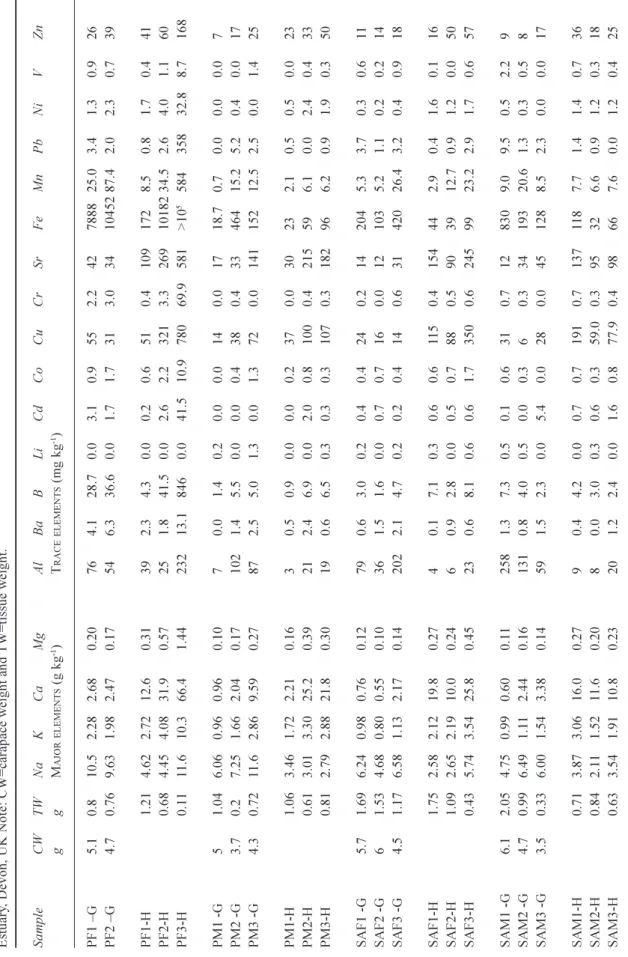
Table 1. Total acid available concentrations of elements in the water column of the lower Dart Estuary , Devon, UK: for NH 4 and PO 4 , the concentrations refer to dissolved forms. S=Sugary Cove; WF=W
arfleet Cove; P=Pier
, SA=Sandquay , N=Noss Marina; W1-3= water samples 1-3. Na K C a M g C l SO 4 Al Ba B Li C dC o C uC r Sr Fe M n Pb N i V Zn N H4 PO 4 M AJOR ELEMENTS (g l -1) M INOR COMPONENTS (mg l -1) SW 1 10.3 0.52 0.41 1.25 20.2 2.6 0.35 0.01 4.78 0.17 0.01 0 0 0 6.9 0.2 0.01 0.1 1 0.06 0 0.96 0.05 0.2 SW 2 10.2 0.52 0.41 1.27 20.6 2.8 0.18 0.01 5.03 0.18 0.01 0 0 0 7.2 0.2 0.01 0.03 0.03 0 0.21 0.04 0.1 1 SW 3 10.0 0.51 0.41 1.25 20.2 2.6 0.42 0.01 4.69 0.16 0.01 0 0 0 6.7 0.5 0.01 0.05 0.03 0 0.15 0.04 0.1 1 W FW 14.41 0.2 0.2 0.54 8.7 1.2 0.72 0.01 2.16 0.08 0 0 0 0 3.1 1.0 0.02 0.03 0.02 0 0.1 1 0.08 0.21 W FW 24.33 0.2 0.21 0.52 8.3 1.1 5.93 0.02 2.24 0.1 0.01 0 0 0 3.1 9.1 0.18 0.05 0.03 0.02 0.17 0.44 0.2 FW 3 3.89 0.18 0.18 0.47 7.3 0.9 2.91 0.01 1.97 0.09 0 0 0 0 2.7 4.3 0.09 0.04 0.02 0.01 0.13 0.28 0.2 PW1 9.07 0.45 0.37 1.12 18.4 2.4 0.14 0.01 4.33 0.15 0.01 0 0 0 6.2 0.1 0.01 0.04 0.03 0 0.12 0.26 0.18 PW2 8.16 0.4 0.33 0.98 17.6 2.4 0.1 0.01 4.25 0.16 0.01 0 0 0 6.1 0.1 0.01 0.07 0.15 0 0.59 0.24 0.14 PW3 8.85 0.49 0.36 1.1 17.8 2.4 0.14 0.01 4.28 0.15 0.01 0 0 0 6.0 0.1 0.01 0.05 0.04 0.01 0.1 1 0.12 0.13 SA W 1 9.12 0.48 0.45 1.15 17.4 2.4 10.9 0.02 4.48 0.19 0.01 0 0 0 6.6 17.8 0.35 0.08 0.06 0.03 0.3 0.18 0.2 SA W 2 8.83 0.45 0.36 1.19 17.2 2.2 0.96 0.01 4.16 0.16 0.01 0 0 0 6.1 1.2 0.03 0.04 0.03 0 0.14 0.07 0.1 1 SA W 3 9.1 0.47 0.39 1.13 17.8 2.4 1.03 0.01 4.41 0.17 0.01 0 0 0 6.3 1.3 0.03 0 0.03 0 0.1 1 0.08 0.12 N W 1 7.21 0.37 0.33 0.88 14.2 1.8 4.08 0.02 3.32 0.13 0.01 0 0 0 5.0 6.7 0.15 0.04 0.03 0.01 0.14 0.21 0.08 N W 2 7.03 0.35 0.29 0.85 13.6 1.8 0.16 0.01 3.19 0.12 0.01 0 0 0 4.8 0.1 0.01 0.02 0.03 0 0.08 0.07 0.08 N W 3 7.62 0.4 0.33 0.93 14.8 2 3.48 0.02 3.49 0.14 0.01 0 0 0 5.2 5.1 0.1 1 0.01 0.03 0.01 0.13 0.22 0.09
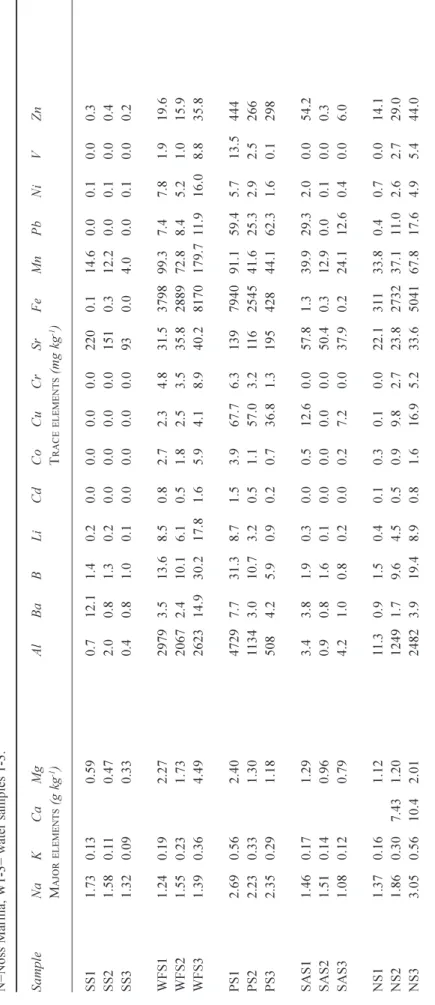
Table 2. T otal acid available concentrations of elements in the sediments in the lower Dart Estuary , Devon, UK. . S=Sugary Cove; WF=W ar fleet Cove; P=Pier , SA=Sandquay , N=Noss Marina; W1-3= water samples 1-3. Sa mp le Na K C a M g Al Ba B Li Cd Co Cu C r Sr Fe Mn Pb Ni V Zn M AJOR ELEMENTS (g kg -1) T RACE ELEMENTS (mg kg -1) SS1 1.73 0.13 0.59 0.7 12.1 1.4 0.2 0.0 0.0 0.0 0.0 220 0.1 14.6 0.0 0.1 0.0 0.3 SS2 1.58 0.1 1 0.47 2.0 0.8 1.3 0.2 0.0 0.0 0.0 0.0 151 0.3 12.2 0.0 0.1 0.0 0.4 SS3 1.32 0.09 0.33 0.4 0.8 1.0 0.1 0.0 0.0 0.0 0.0 93 0.0 4.0 0.0 0.1 0.0 0.2 WFS1 1.24 0.19 2.27 2979 3.5 13.6 8.5 0.8 2.7 2.3 4.8 31.5 3798 99.3 7.4 7.8 1.9 19.6 WFS2 1.55 0.23 1.73 2067 2.4 10.1 6.1 0.5 1.8 2.5 3.5 35.8 2889 72.8 8.4 5.2 1.0 15.9 WFS3 1.39 0.36 4.49 2623 14.9 30.2 17.8 1.6 5.9 4.1 8.9 40.2 8170 179.7 11.9 16.0 8.8 35.8 PS 1 2.69 0.56 2.40 4729 7.7 31.3 8.7 1.5 3.9 67.7 6.3 139 7940 91.1 59.4 5.7 13.5 444 PS 2 2.23 0.33 1.30 1134 3.0 10.7 3.2 0.5 1.1 57.0 3.2 116 2545 41.6 25.3 2.9 2.5 266 PS 3 2.35 0.29 1.18 508 4.2 5.9 0.9 0.2 0.7 36.8 1.3 195 428 44.1 62.3 1.6 0.1 298 SAS1 1.4 6 0.1 7 1.2 9 3.4 3.8 1.9 0.3 0.0 0.5 12 .6 0.0 57 .8 1.3 39 .9 29 .3 2.0 0.0 54 .2 SAS2 1.5 1 0.1 4 0.9 6 0.9 0.8 1.6 0.1 0.0 0.0 0.0 0.0 50 .4 0.3 12 .9 0.0 0.1 0.0 0.3 SAS3 1.0 8 0.1 2 0.7 9 4.2 1.0 0.8 0.2 0.0 0.2 7.2 0.0 37 .9 0.2 24 .1 12 .6 0.4 0.0 6.0 N S1 1.37 0.16 1.12 11 .3 0.9 1.5 0.4 0.1 0.3 0.1 0.0 22.1 31 1 33.8 0.4 0.7 0.0 14.1 N S2 1.86 0.30 7.43 1.20 1249 1.7 9.6 4.5 0.5 0.9 9.8 2.7 23.8 2732 37.1 11.0 2.6 2.7 29.0 N S3 3.05 0.56 10.4 2.01 2482 3.9 19.4 8.9 0.8 1.6 16.9 5.2 33.6 5041 67.8 17.6 4.9 5.4 44.0
Table 3a.
Chemical concentrations in gill (G) and
digestive gland (H) tissues of
female (F) and male (M)
Car
cinus
maenas
from Sugary Cove (S) and
W
arfleet Cove (WF), the
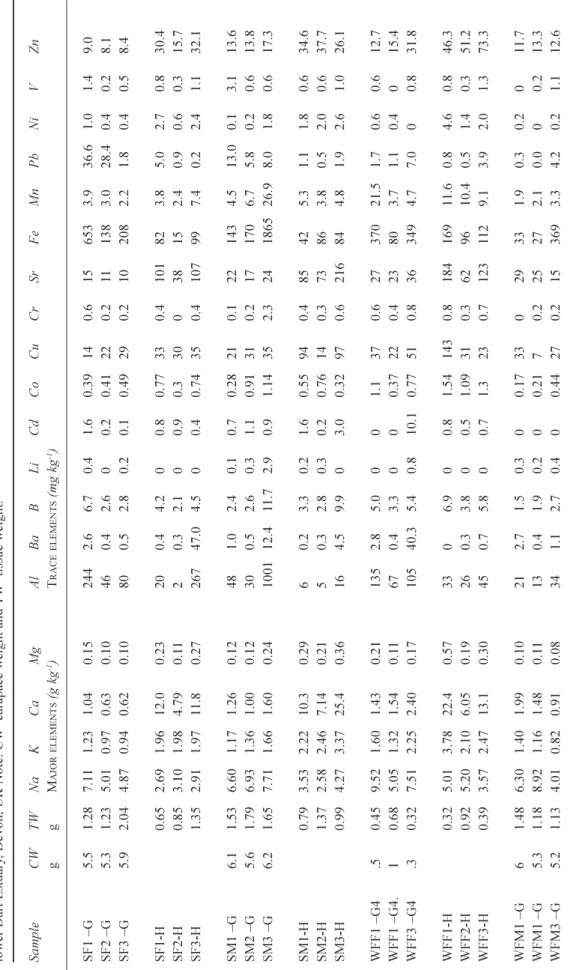
lower Dart Estuary , Devon, UK Note: CW=carapace weight and TW=tissue weight. Sa mp le C W TW Na K C a M g Al Ba B Li Cd Co Cu C r Sr Fe Mn Pb Ni V Zn gg M AJOR ELEMENT s (g kg -1) T RACE ELEMENTS (mg kg -1) SF1 G 5.5 1.2 8 7.1 1 1.2 3 1.0 4 0.1 5 24 4 2.6 6.7 0.4 1.6 0.3 9 14 0.6 15 65 3 3.9 36 .6 1.0 1.4 9.0 SF2 G 5.3 1.2 3 5.0 1 0.9 7 0.6 3 0.1 0 46 0.4 2.6 0 0.2 0.4 1 22 0.2 11 13 8 3.0 28 .4 0.4 0.2 8.1 SF3 G 5.9 2.0 4 4.8 7 0.9 4 0.6 2 0.1 0 80 0.5 2.8 0.2 0.1 0.4 9 29 0.2 10 20 8 2.2 1.8 0.4 0.5 8.4 SF1-H 0.65 2.69 1.96 12.0 0.23 20 0.4 4.2 0 0.8 0.77 33 0.4 101 82 3.8 5.0 2.7 0.8 30.4 SF2-H 0.85 3.10 1.98 4.79 0.1 1 2 0.3 2.1 0 0.9 0.3 30 0 38 15 2.4 0.9 0.6 0.3 15.7 SF3-H 1.35 2.91 1.97 11 .8 0.27 267 47.0 4.5 0 0.4 0.74 35 0.4 107 99 7.4 0.2 2.4 1.1 32.1 SM1 G 6.1 1.5 3 6.6 0 1.1 7 1.2 6 0.1 2 48 1.0 2.4 0.1 0.7 0.2 8 21 0.1 22 14 3 4.5 13 .0 0.1 3.1 13 .6 SM2 G 5.6 1.7 9 6.9 3 1.3 6 1.0 0 0.1 2 30 0.5 2.6 0.3 1.1 0.9 1 31 0.2 17 17 0 6.7 5.8 0.2 0.6 13 .8 SM3 G 6.2 1.65 7.71 1.66 1.60 0.24 1001 12.4 11.7 2.9 0.9 1.14 35 2.3 24 1865 26.9 8.0 1.8 0.6 17.3 SM1-H 0.79 3.53 2.22 10.3 0.29 6 0.2 3.3 0.2 1.6 0.55 94 0.4 85 42 5.3 1.1 1.8 0.6 34.6 SM2-H 1.37 2.58 2.46 7.14 0.21 5 0.3 2.8 0.3 0.2 0.76 14 0.3 73 86 3.8 0.5 2.0 0.6 37.7 SM3-H 0.99 4.27 3.37 25.4 0.36 16 4.5 9.9 0 3.0 0.32 97 0.6 216 84 4.8 1.9 2.6 1.0 26.1 WFF1 G4 .5 0.4 5 9.5 2 1.6 0 1.4 3 0.2 1 13 5 2.8 5.0 0 0 1.1 37 0.6 27 37 0 21 .5 1.7 0.6 0.6 12 .7 WFF1 G4 . 1 0.6 8 5.0 5 1.3 2 1.5 4 0.1 1 67 0.4 3.3 0 0 0.3 7 22 0.4 23 80 3.7 1.1 0.4 0 15 .4 WFF3 G4 .3 0.3 2 7.5 1 2.2 5 2.4 0 0.1 7 10 5 40 .3 5.4 0.8 10 .1 0.7 7 51 0.8 36 34 9 4.7 7.0 0 0.8 31 .8 WFF1-H 0.3 2 5.0 1 3.7 8 22 .4 0.5 7 33 0 6.9 0 0.8 1.5 4 14 3 0.8 18 4 16 9 11 .6 0.8 4.6 0.8 46 .3 WFF2-H 0.9 2 5.2 0 2.1 0 6.0 5 0.1 9 26 0.3 3.8 0 0.5 1.0 9 31 0.3 62 96 10 .4 0.5 1.4 0.3 51 .2 WFF3-H 0.3 9 3.5 7 2.4 7 13 .1 0.3 0 45 0.7 5.8 0 0.7 1.3 23 0.7 12 3 11 2 9.1 3.9 2.0 1.3 73 .3 WFM1 G 6 1.4 8 6.3 0 1.4 0 1.9 9 0.1 0 21 2.7 1.5 0.3 0 0.1 7 33 0 29 33 1.9 0.3 0.2 0 11 .7 WFM1 G 5.3 1.1 8 8.9 2 1.1 6 1.4 8 0.1 1 13 0.4 1.9 0.2 0 0.2 1 7 0.2 25 27 2.1 0.0 0 0.2 13 .3 WFM3 G 5.2 1.1 3 4.0 1 0.8 2 0.9 1 0.0 8 34 1.1 2.7 0.4 0 0.4 4 27 0.2 15 36 9 3.3 4.2 0.2 1.1 12 .6
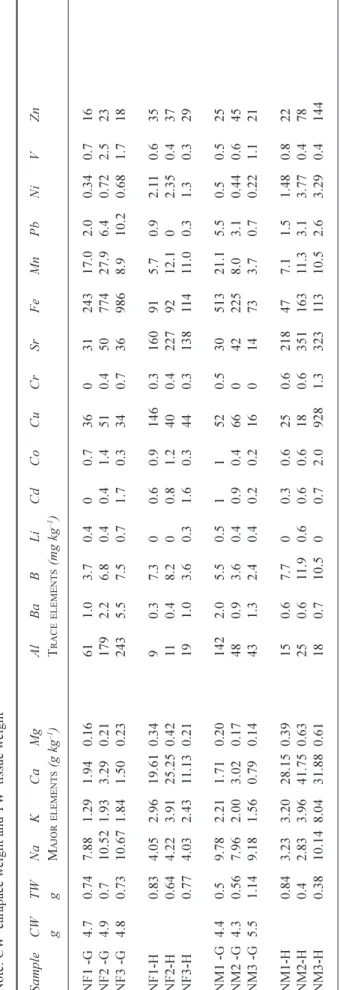
Ta ble 3b. Chemical concentrations in gill (G) and digestive gland (H) tissues of female (F) and male (M) Car cinus maenas from the Pier (P) and Sanquay (SA), the lower Dart Estuary , Devon, UK Note: CW
=carapace weight and TW=tissue
weight. Sa mp le C W TW Na K C a M g Al Ba B Li Cd Co Cu C r Sr Fe Mn Pb Ni V Zn gg M AJOR ELEMENTS (g kg -1)T RACE ELEMENTS (mg kg -1) PF1 G 5.1 0.8 10.5 2.28 2.68 0.20 76 4.1 28.7 0.0 3.1 0.9 55 2.2 42 7888 25.0 3.4 1.3 0.9 26 PF2 G 4.7 0.76 9.63 1.98 2.47 0.17 54 6.3 36.6 0.0 1.7 1.7 31 3.0 34 10452 87.4 2.0 2.3 0.7 39 PF1-H 1.21 4.62 2.72 12.6 0.31 39 2.3 4.3 0.0 0.2 0.6 51 0.4 109 172 8.5 0.8 1.7 0.4 41 PF2-H 0.68 4.45 4.08 31.9 0.57 25 1.8 41.5 0.0 2.6 2.2 321 3.3 269 10182 34.5 2.6 4.0 1.1 60 PF3-H 0.1 1 11 .6 10.3 66.4 1.44 232 13.1 846 0.0 41.5 10.9 780 69.9 581 >1 0 5 584 358 32.8 8.7 168 PM1 -G 5 1.04 6.06 0.96 0.96 0.10 7 0.0 1.4 0.2 0.0 0.0 14 0.0 17 18.7 0.7 0.0 0.0 0.0 7 PM2 -G 3.7 0.2 7.25 1.66 2.04 0.17 102 1.4 5.5 0.0 0.0 0.4 38 0.4 33 464 15.2 5.2 0.4 0.0 17 PM3 -G 4.3 0.72 11 .6 2.86 9.59 0.27 87 2.5 5.0 1.3 0.0 1.3 72 0.0 141 152 12.5 2.5 0.0 1.4 25 PM1-H 1.06 3.46 1.72 2.21 0.16 3 0.5 0.9 0.0 0.0 0.2 37 0.0 30 23 2.1 0.5 0.5 0.0 23 PM2-H 0.61 3.01 3.30 25.2 0.39 21 2.4 6.9 0.0 2.0 0.8 100 0.4 215 59 6.1 0.0 2.4 0.4 33 PM3-H 0.81 2.79 2.88 21.8 0.30 19 0.6 6.5 0.3 0.3 0.3 107 0.3 182 96 6.2 0.9 1.9 0.3 50 SAF1 -G 5.7 1.6 9 6.2 4 0.9 8 0.7 6 0.1 2 79 0.6 3.0 0.2 0.4 0.4 24 0.2 14 20 4 5.3 3.7 0.3 0.6 11 SAF2 -G 6 1.5 3 4.6 8 0.8 0 0.5 5 0.1 0 36 1.5 1.6 0.0 0.7 0.7 16 0.0 12 10 3 5.2 1.1 0.2 0.2 14 SAF3 -G 4.5 1.1 7 6.5 8 1.1 3 2.1 7 0.1 4 20 2 2.1 4.7 0.2 0.2 0.4 14 0.6 31 42 0 26 .4 3.2 0.4 0.9 18 SAF1-H 1.7 5 2.5 8 2.1 2 19 .8 0.2 7 4 0.1 7.1 0.3 0.6 0.6 11 5 0.4 15 4 44 2.9 0.4 1.6 0.1 16 SAF2-H 1.0 9 2.6 5 2.1 9 10 .0 0.2 4 6 0.9 2.8 0.0 0.5 0.7 88 0.5 90 39 12 .7 0.9 1.2 0.0 50 SAF3-H 0.4 3 5.7 4 3.5 4 25 .8 0.4 5 23 0.6 8.1 0.6 0.6 1.7 35 0 0.6 24 5 99 23 .2 2.9 1.7 0.6 57 SAM1 -G 6.1 2.0 5 4.7 5 0.9 9 0.6 0 0.1 1 25 8 1.3 7.3 0.5 0.1 0.6 31 0.7 12 83 0 9.0 9.5 0.5 2.2 9 SAM2 -G 4.7 0.9 9 6.4 9 1.1 1 2.4 4 0.1 6 13 1 0.8 4.0 0.5 0.0 0.3 6 0.3 34 19 3 20 .6 1.3 0.3 0.5 8 SAM3 -G 3.5 0.3 3 6.0 0 1.5 4 3.3 8 0.1 4 59 1.5 2.3 0.0 5.4 0.0 28 0.0 45 12 8 8.5 2.3 0.0 0.0 17 SAM1-H 0.7 1 3.8 7 3.0 6 16 .0 0.2 7 9 0.4 4.2 0.0 0.7 0.7 19 1 0.7 13 7 11 8 7.7 1.4 1.4 0.7 36 SAM2-H 0.8 4 2.1 1 1.5 2 11 .6 0.2 0 8 0.0 3.0 0.3 0.6 0.3 59 .0 0.3 95 32 6.6 0.9 1.2 0.3 18 SAM3-H 0.6 3 3.5 4 1.9 1 10 .8 0.2 3 20 1.2 2.4 0.0 1.6 0.8 77 .9 0.4 98 66 7.6 0.0 1.2 0.4 25
in water, sediments and C. maenas tissues in the lower Dart estuary, Devon, UK.
Sample Na K Ca Mg Cl SO4 WATER (g l1) Avg 7.88 0.40 0.34 0.98 15.6 2.07 Median 8.83 0.45 0.36 1.10 17.4 2.40 Min 3.89 0.18 0.18 0.47 7.30 0.90 Max 10.3 0.52 0.45 1.27 20.6 2.80 SEDIMENT (g kg1) Avg 1.76 0.25 1.47 Median 1.55 0.19 1.20 Min 1.08 0.09 0.33 Max 3.05 0.56 4.49
TOTALCRABTISSUE (g kg1)
Avg 5.72 2.30 10.5 0.26
Median 5.01 1.98 5.42 0.21
Min 2.12 0.80 0.56 0.08
Max 11.6 10.3 66.4 1.44
CRABDIGESTIVEGLAND (g kg1)
Avg 4.07 3.09 18.8 0.36 Median 3.54 2.47 14.6 0.29 Min 2.12 1.52 2.21 0.11 Max 11.6 10.3 66.4 1.44 CRABGILLS (g kg1) Avg 7.42 1.48 1.92 0.15 Median 7.18 1.38 1.57 0.15 Min 4.01 0.80 0.56 0.08 Max 11.6 2.87 9.59 0.27 Table 3c. Chemical concentrations in gill (G) and digestive gland (H) tissues of female (F) and male (M) Car cinus maenas from Noss Marina, (N), the lower Dart Estuary , Devon, UK.
Note: CW=carapace weight and
TW=tissue weight Sa mp le C W TW Na K C a M g Al Ba B Li Cd Co Cu C r Sr Fe Mn Pb Ni V Zn gg M AJOR ELEMENTS (g kg 1) T RACE ELEMENTS (mg kg 1) NF1 -G 4.7 0.7 4 7.8 8 1.2 9 1.9 4 0.1 6 61 1.0 3.7 0.4 0 0.7 36 0 31 24 3 17 .0 2.0 0.3 4 0.7 16 NF2 -G 4.9 0.7 10 .5 2 1.9 3 3.2 9 0.2 1 17 9 2.2 6.8 0.4 0.4 1.4 51 0.4 50 77 4 27 .9 6.4 0.7 2 2.5 23 NF3 -G 4.8 0.7 3 10 .6 7 1.8 4 1.5 0 0.2 3 24 3 5.5 7.5 0.7 1.7 0.3 34 0.7 36 98 6 8.9 10 .2 0.6 8 1.7 18 NF1-H 0.8 3 4.0 5 2.9 6 19.61 0.3 4 9 0.3 7.3 0 0.6 0.9 14 6 0.3 16 0 91 5.7 0.9 2.1 1 0.6 35 NF2-H 0.6 4 4.2 2 3.9 1 25.25 0.4 2 11 0.4 8.2 0 0.8 1.2 40 0.4 22 7 92 12 .1 0 2.3 5 0.4 37 NF3-H 0.7 7 4.0 3 2.4 3 11 .1 3 0.2 1 19 1.0 3.6 0.3 1.6 0.3 44 0.3 13 8 11 4 11 .0 0.3 1.3 0.3 29 NM1 -G 4.4 0.5 9.7 8 2.2 1 1.7 1 0.2 0 14 2 2.0 5.5 0.5 1 1 52 0.5 30 51 3 21 .1 5.5 0.5 0.5 25 NM2 -G 4.3 0.5 6 7.9 6 2.0 0 3.0 2 0.1 7 48 0.9 3.6 0.4 0.9 0.4 66 0 42 22 5 8.0 3.1 0.4 4 0.6 45 NM3 -G 5.5 1.1 4 9.1 8 1.5 6 0.7 9 0.1 4 43 1.3 2.4 0.4 0.2 0.2 16 0 14 73 3.7 0.7 0.2 2 1.1 21 NM1-H 0.8 4 3.2 3 3.2 0 28.15 0.3 9 15 0.6 7.7 0 0.3 0.6 25 0.6 21 8 47 7.1 1.5 1.4 8 0.8 22 NM2-H 0.4 2.8 3 3.9 6 41.75 0.6 3 25 0.6 11 .9 0.6 0.6 0.6 18 0.6 35 1 16 3 11 .3 3.1 3.7 7 0.4 78 NM3-H 0.3 8 10.14 8.0 4 31.88 0.6 1 18 0.7 10 .5 0 0.7 2.0 92 8 1.3 32 3 11 3 10 .5 2.6 3.2 9 0.4 14 4
correlation between Pb, Ni and Zn (p<0.001); 11% of the variance is explained by this group). Ammonium concentrations were highest at Warfleet Cove (Site 4), the Pier (Site 3) and at Noss Marina, while the highest sulphate and phosphate levels were found at Sugary and Warfleet Cove, respectively (Table 1).
CHEMICAL CONCENTRATIONS IN SEDIMENTS OF THE LOWER DART ESTUARY
The sediments are sea-salt and trace element bearing (Table 2). The sea-salt components are positively correlated with each other, the data are approximately normally distributed and vary by about a factor of three in concentration (e.g. Na varies between 1.08 and 3.05 g kg1 wet wt: Table 4). There
are also strong correlations between many of the trace metals, including Al, Co, Cd, Cr, Ni, Fe and V: these too are correlated with the sea-salts (Table 2; Fig. 3). This combined
Fig. 2. The concentration relationships between Cl and B and total
acid available Fe with Mn, Fe with Zn and Pb with Zn in the water of the lower Dart estuary, Devon, UK.
Fig. 3. The concentration variation of total acid available Mg with
B, Cu with Zn, Fe with Co and Mg with Fe in the sediments of the lower Dart estuary.
and Fe; the average, median and range are 1.19, 0.51 and 04.73 g kg1 wet wt and 2.26, 0.43 and 08.17 g kg1 wet
wt, respectively. There are also strong correlations between Cu and Zn and between Ba and Sr (Table 2; Fig. 3).
The average and range in concentration in the sediments are probably associated with the proportion of fine-grained sediments: the sea-salt components reflect the water entrained in the pore water and the metals link to the Al and Fe oxides/hydroxides within the fine grained sediments (Tables 2, 4 and 5).
CHEMICAL CONCENTRATIONS IN TISSUES OF C. MAENAS IN THE LOWER DART ESTUARY.
In tissues of C. maenas, concentrations of Na were twice as high in the gills compared with the digestive gland, whereas the concentrations of K and Mg were twice and Ca seven times higher in the digestive gland compared with the gills. Except for Al, concentrations of trace elements were higher in the digestive gland than in the gills (Table 5). Sea-salts and trace element concentrations in the gills and the digestive gland show patterns similar to those associated with the sediments (Table 3a-c; 4 and 5). For example, the concentrations of the sea-salt components vary by a factor of three or more, while the trace elements show a much greater range as well as a greater skew to lower
Fig. 4. The variation in total acid-available K and Mg, Fe and Al,
Fe and Zn and Ca and Sr in the gills (G) and the digestive gland (H) of Carcinus maenas.
group explains 65% of the variance. Concentrations of the trace metals are highly variable and skewed to the lower end of the concentrations. The main trace elements are Al
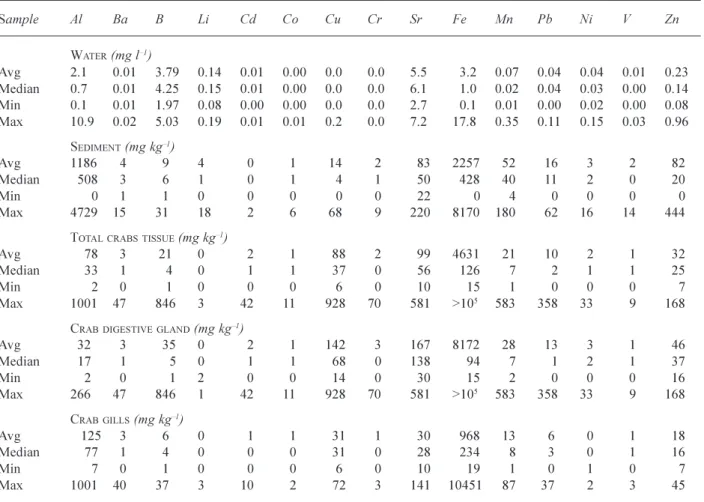
Table 5. Averages, medians and ranges for the trace element concentrations in water, sediments and C. maenas tissues of the lower Dart estuary, Devon, UK.
Sample Al Ba B Li Cd Co Cu Cr Sr Fe Mn Pb Ni V Zn WATER (mg l1) Avg 2.1 0.01 3.79 0.14 0.01 0.00 0.0 0.0 5.5 3.2 0.07 0.04 0.04 0.01 0.23 Median 0.7 0.01 4.25 0.15 0.01 0.00 0.0 0.0 6.1 1.0 0.02 0.04 0.03 0.00 0.14 Min 0.1 0.01 1.97 0.08 0.00 0.00 0.0 0.0 2.7 0.1 0.01 0.00 0.02 0.00 0.08 Max 10.9 0.02 5.03 0.19 0.01 0.01 0.2 0.0 7.2 17.8 0.35 0.11 0.15 0.03 0.96 SEDIMENT (mg kg1) Avg 1186 4 9 4 0 1 14 2 83 2257 52 16 3 2 82 Median 508 3 6 1 0 1 4 1 50 428 40 11 2 0 20 Min 0 1 1 0 0 0 0 0 22 0 4 0 0 0 0 Max 4729 15 31 18 2 6 68 9 220 8170 180 62 16 14 444
TOTALCRABSTISSUE (mg kg1)
Avg 78 3 21 0 2 1 88 2 99 4631 21 10 2 1 32
Median 33 1 4 0 1 1 37 0 56 126 7 2 1 1 25
Min 2 0 1 0 0 0 6 0 10 15 1 0 0 0 7
Max 1001 47 846 3 42 11 928 70 581 >105 583 358 33 9 168
CRABDIGESTIVEGLAND (mg kg1)
Avg 32 3 35 0 2 1 142 3 167 8172 28 13 3 1 46 Median 17 1 5 0 1 1 68 0 138 94 7 1 2 1 37 Min 2 0 1 2 0 0 14 0 30 15 2 0 0 0 16 Max 266 47 846 1 42 11 928 70 581 >105 583 358 33 9 168 CRABGILLS (mg kg1) Avg 125 3 6 0 1 1 31 1 30 968 13 6 0 1 18 Median 77 1 4 0 0 0 31 0 28 234 8 3 0 1 16 Min 7 0 1 0 0 0 6 0 10 19 1 0 1 0 7 Max 1001 40 37 3 10 2 72 3 141 10451 87 37 2 3 45
Table 6. The respective ratios of sea-salt and trace metals to Na and Fe in water, sediments and C. maenas tissues in the lower Dart estuary, Devon, UK, based on median concentrations.
Elements Water Sediment Tot. Crab Digest. Gills
gland
SEASALTS Ratio to Na
K 0.051 0.121 0.395 0.699 0.192
Ca 0.041 0.000 1.081 4.122 0.218
Mg 0.125 0.773 0.042 0.083 0.020
TRACEMETALS Ratio to Fe
Al 0.735 1.188 0.265 0.178 0.331 Ba 0.010 0.007 0.007 0.006 0.006 Li 0.153 0.002 0.001 0.000 0.001 Cd 0.010 0.000 0.005 0.007 0.002 Co 0.000 0.002 0.005 0.008 0.002 Cu 0.000 0.010 0.295 0.731 0.132 Cr 0.000 0.003 0.003 0.004 0.001 Mn 0.020 0.093 0.059 0.078 0.035 Pb 0.041 0.026 0.014 0.009 0.014 Ni 0.031 0.005 0.009 0.020 0.002 V 0.000 0.000 0.005 0.006 0.003 Zn 0.143 0.046 0.199 0.400 0.068
concentrations. The correlations between the sea-salts and the trace metals remain but the scatter in the data is greater and there are correlations between acid-available Cu, Cr, Fe, Mn, Ni, Sr and Zn. (Fig. 4); of the trace metals, Al, Fe and Cu have the highest concentrations (Table 5). The median values for Al, Fe and Cu are, respectively, 77, 234 and 31 mg kg1 wet wt in the gills and 17, 94 and 68 mg kg1
wet wt in the digestive gland (Table 5). Also, Sr is present in significant amounts, especially in the digestive gland, and is highly correlated with Ca (Fig. 4). Correspondingly, for the sea-salts, Ca, Mg and K are enriched relative to Na.
ELEMENT RATIOS OF CHEMICAL CONCENTRATIONS.
Variations in sea-salts and trace metals were compared in water, sediments and crab tissues by using ratios to Na and to Fe, to explore how the sea-salt and trace metals vary between the water, sediment and crabs (Table 6). The Na and Fe are tracers for the sea-water and the fine-grained
sediments, respectively. For the sea-salts, K and Mg were enriched in the sediments, probably due to leaching from K- and Mg-bearing clays and other mineral phases. Mg concentrations in crab tissues were low relative to the water and the sediment, while concentrations of K and Ca were high, especially in the digestive gland of crab tissues. Concentrations of Ca were two and five orders of magnitude higher in the digestive gland and in the gills, respectively. In addition, the K/Na ratio was three times higher in the sediments than in the water. The corresponding values in the crabs are four and 12 times higher in the gills and the digestive gland, respectively. The trace metal ratios to Fe indicate increased metals concentrations in the crab tissues relative to the water and sediments; Co and Cu concentrations were four and 73 times higher. The ratios of trace metals to Fe for Al, Li and Pb are low.
Discussion
Species diversity varies considerably within the Dart estuary (Davies, 1991). The particularly high species richness and abundance in biomass reflected a balanced healthy ecosystem at Sugary Cove, Site 5. In contrast, species diversity and biomass were particularly low at the Pier (Site 3) due to extensive mooring, passenger ferry transport, crabbing and other recreational activities (EA, 1997; 1999; Ley, 2000; Allen, 2001). Few species dominated at sites 1, 2 and 4 and were therefore highly adapted to the changing and harsh estuarine environment.
THE DYNAMICS OF CHEMICALS IN THE WATER OF THE LOWER DART ESTUARY
Estuarine environments are highly dynamic with huge sub-daily tidally induced changes in flow, sea-salt and suspended sediment concentrations, with associated mobilisation of trace metals and other chemicals (Mattiessen and Law, 2002; Priestley and Thain, 2003; Thain et al., 2004). In this study, wide ranges in total acid-available concentrations occurred in the water, sediments and crab tissues, with strong correlations for the sea-salts and many trace metals. The average concentrations of sea-salts decreased with distance from the river entrance, but there were large variations in concentration around the mean. The study was undertaken at the start of low water during spring tides in April 2004 when dense saline water flooded the Dart estuary for 6.7 hrs and then an ebb tide, which lasted 5.7 hrs. This would have contributed to an increased sea-salt component in the water at the beginning of the low spring tide, especially at sites in the seaward end of the estuary. The markedly lower Na and Cl concentrations at Warfleet were associated with
greater dilution from a nearby freshwater input which is adjacent to the boat slipway in the Cove and enters the Dart at right-angles to the main water flow in the estuary.
Several trace metals, including Co, Cu, Mn and V, were bound to Fe and Al oxides in particulate matter; and in places there was contamination from Pb, Ni and Zn. The concentrations of sea-salt and sediment-associated components in the water fluctuate with changing physico-chemical factors in the water column. Prior to the sampling, strong winds and increased wave action led to considerable mixing in the water column, and increased turbulent flow and shear along the riverbed in the lower Dart estuary. Under such conditions, sediments were mobilised into suspension, which generally leads to increased bioavailability (Schuwerack et al., 2001; Matthiessen and Law, 2002; Westrich and Förstner, 2005).
THE DYNAMICS OF CHEMICALS IN THE SEDIMENTS OF THE DART ESTUARY
Analyses of sediments and specifically sediment cores, play an important part in the risk assessment of aquatic pollution, and provide a historical record of various impacts on aquatic systems by indicating both the natural and anthropogenic inputs of substances over time (Westrich and Forstner, 2005). The sediments provide historic or secondary pollutant sources, which become mobilised at the water/sediment interface during the combined action of storms and waves (Schuwerack et al., 2001; Waeles et al., 2005; Westrich and Förstner, 2005). The present study shows high concentrations of chemicals associated with the suspended and bottom sediments. Many of the trace metals are strongly correlated with each other. In rivers and estuaries, sediments can become coated with micro-algal films/mats with different degrees of thickness according to the flow rate. Trace metals and other chemicals, adsorbed to these algal films and allochthonous particles, can become desorbed and re-suspended in the water column when wind energy is transferred into the water column. The variations are seasonal and affect bioavailability (Schuwerack et al., 2001; Matthiessen and Law, 2002; Waeles et al., 2005; Westrich and Förstner, 2005).
The spatial variability in the sea-salt component of the sediments is linked to the proportion of fine-grained sediments within the total sediment; this is greater near the mouth of the River Dart because the mean grain diameter was found to be correlated negatively with distance from the head of the estuary (Kelly, 1982; Lakhan et al., 2003). Increased wave action over shallow estuarine and coastal waters alters the wave-induced flow and thus the shear. It also changes the near-bed wave orbital diameter and
sediments, their spatial distribution (Davies and Thorne, 2002) and adsorbed trace metal concentrations (Zhou et al., 2004; Westrich and Förstner, 2005).
Overall, the total acid-available concentrations in the Dart estuary are linked to the proportion of fine-grained components within the water column and the sediment. In areas of reduced tidal flow, sediments often develop into trace metal sinks at the micro-scale (Kelly, 1982; Lakhan et
al., 2003; Matthiessen and Law, 2002; Wu et al., 2005),
from which multiple pollutants with diverse concentrations become bioavailable due to increased shear at the water sediment interface at high tide.
THE RELATIONSHIP BETWEEN CHEMICAL CONCENTRATIONS IN GILL AND DIGESTIVE GLAND TISSUES OF C. MAENAS AND IN WATER AND SEDIMENTS
The gills of benthic macro-invertebrates are a suitable bio-indicator for short-term elevated trace metal concentrations in water (Warwick 1986, 1993; Schuwerack, 2002), because of the site fidelity of these benthic feeders (Gray et al., 1990; Warwick, 1993). Trace metals in water become adsorbed and incorporated into lamellar crystal deposits and increase in thickness on the gill cuticle with increasing metal concentration in suspension (Schuwerack and Lewis, 2003a). Long-term low-level pollution in the water column/ sediment and uptake through diet may lead to elevated concentrations of trace metals in benthic invertebrates. These may bind to proteins, such as metallothionein, in the hepatic cytosol (Engel and Brouwer, 1987; Depledge and Rainbow, 1990; Schuwerack, 2002; Schuwerack et al., in press) and become incorporated into P/Ca granules of the digestive gland, the storage organ for trace metals (Mason and Jenkins,
most major and trace elements in the gills and digestive gland tissues behaved similarly to those in the sediments of the lower Dart estuary. This indicates not only that their uptake is linked predominantly to the diet of the crabs but also that elevated metal concentrations in the water originate in the sediments. An increased chemical concentration, such as Al, associated with the gills as opposed to the digestive gland, is indicative of a pollutant assault in situ as opposed to a dietary uptake. The major and minor trace element concentrations showed higher variations in the crabs than in the water and sediments. As the crabs diet is linked closely to the sediments, the variations in total acid-available concentrations in the tissues of the crabs reflect the heterogeneity in the sediments (Watzkin et al., 1997). Concentrations of some metals, including Al, Fe and Cu were considerably higher in the gill than in digestive gland tissues and this is linked to an in situ exposure through mobilised sediments and pollutants. The highest Na, K, Ca, Mg, Sr, Mn, Co, Zn, V, Cd, Cr, Ni and Pb concentrations in the digestive gland of a female at the Pier were associated with varying concentrations of metals adsorbed to micro-algal mats and heterogeneous sediments and associated diet. High trace metal concentrations were found in the sediments at Warfleet, the Pier and Noss Marina. Copper in particular is found in antifouling paint that is used regularly at the Pier and Noss Marina.
Environmental stress can also induce the moult cycle of crabs, which may lead to changing partitioning of essential (Cu and Ca) and non-essential (Al and Pb) metals in the gill tissues to the exoskeleton (Taylor and Anstiss, 1999; Schuwerack, 2002). The moult cycle in C. maenas seems to be sex-specific in terms of timing for the Dart: the moults occur in May for the males and in June for the females (Ley, 2000). This may well have affected the variability in trace
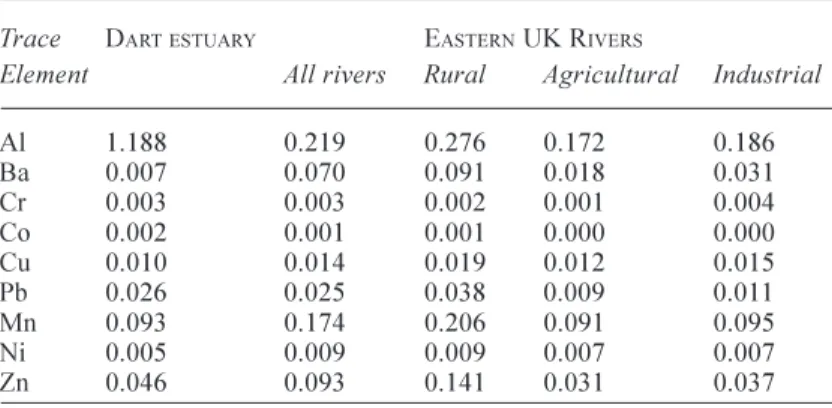
Table 7. Ratios of trace elements to Fe in sediments of the lower Dart estuary and Eastern UK rivers as collected within the LOIS programme and related research (Neal and Robson, 2000; Neal and Davies, 2003).
Trace DARTESTUARY EASTERN UK RIVERS
Element All rivers Rural Agricultural Industrial
Al 1.188 0.219 0.276 0.172 0.186 Ba 0.007 0.070 0.091 0.018 0.031 Cr 0.003 0.003 0.002 0.001 0.004 Co 0.002 0.001 0.001 0.000 0.000 Cu 0.010 0.014 0.019 0.012 0.015 Pb 0.026 0.025 0.038 0.009 0.011 Mn 0.093 0.174 0.206 0.091 0.095 Ni 0.005 0.009 0.009 0.007 0.007 Zn 0.046 0.093 0.141 0.031 0.037
metal concentrations between male and female crabs during the study period. Furthermore, in crustacea, high concentrations of Cu are associated with the oxygen-binding protein, haemocyanin (Taylor and Anstiss, 1999). With increased metal concentrations in the water column, crystal deposits on the cuticle of the gill lamellae lead to decreased O2 uptake and ion exchange and subsequent respiratory
impairment and increased levels of haemocyanin and Cu in gill tissues in crabs. This has been observed in the freshwater crab Potamonautes warreni; respiratory impairment has also been observed in Cancer pagurus when exposed to water-borne Cu and Zn (Spicer and Weber, 1992; Schuwerack, 2002; Schuwerack et al., in press).
THE RIVER DART ESTUARY COMPARED OTHER UK RIVERS AND EARLIER STUDIES OF THE DART
When the data are normalised to Fe (Table 7), the acid-available particulate concentrations in the sediments of the Dart estuary are similar to those for many UK rivers, except for Al in which the Dart is enriched due to the nature of the bedrock geology. The highest Pb/Fe ratios are found for the rural eastern UK rivers, linked to historic mining activity and contamination of the floodplain, especially that of the River Swale. In this sense, the Dart sediments are also perhaps moderately enriched.
The Environment Agency classifies much of the Dart River as good or very good in terms of biological and chemical characteristics (EA; 1997; Allen, 2001); failure to meet river quality objectives on several stretches of the river has been attributed either to low pH, diffuse pollution from agricultural practices and/or emissions from sewage outfalls. The majority of pollution incidents recorded by the EA in the catchment area is thought to originate from fishing or agricultural practices. Screened sewage, previously discharged into the Dart estuary from Dartmouth and Kingswear has been redirected inland to a new treatment works on a brown field site at Old Mill Creek (South West Waters, 2002). However, this will not rid the Dart estuary of historically elevated concentrations of trace metals in the sediments (Schuwerack, 1994). Over the past thirty years, the lower Dart has become highly favoured by tourists and yacht-owners during spring, summer and autumn holiday periods. Regularly, boat owners tie up at the pier sampling site of this study to coat their yachts with antifouling, which ensures sediment enrichment of chemicals, including Cu and Al, especially near to the Dartmouth Pier. The lower concentrations in sea salts at Warfleet reflect a freshwater outflow from the beach/slipway and this resulted in increased suspended trace metals in the water at this site.
Wider comment
Limited information is available on how the meteorological, geological, physical and chemical oceanographic processes interact and affect estuarine biota. Greater emphasis is required to comprehend the dynamics of contaminant mobility in estuarine and coastal marine water, rather than relying on fixed temporal and spatial measurements. Further, there is great need for a more holistic understanding about ecosystem dynamics and their sustainability. Meteorological factors, such as increased wind action, may lead to increased wave action, turbulent mixing and shear at the river estuarine bed or in coastal regions. The study of sediment grain size distribution and sediment dynamics with mixing and shear at the water/sediment interface within individual estuaries and coastal regions will further aid the understanding of the mobilisation of contaminated particles, their re-suspension into the water column and their bioavailability.
This study provides an insight into trace metal distributions in the water and sediments and associated tissue concentrations in C. maenas in the Dart estuary. Most of the variability in chemical concentrations in the water, sediments and gill and digestive gland tissues of the crabs are linked to the sea salt and key metal oxides, including Fe-, Al-rich lithogenous material and a heterogeneous grain size in the sediments. Despite this simplicity, the great heterogeneity in the Dart estuary indicates the need for a more detailed examination of the complex interacting factors which cause the spatial and temporal changes in contaminant concentrations and their bioavailability.
Acknowledgements
P.-M. M. Schuwerack thanks (a) Profs. Peter Jones, Samuel Luoma and Zed Mason for several relevant discussions, (b) Duncan Priestley, Ray Humphreys, Tim Robbins, Phillip Gibbons and Sir Jeffrey Newman for valuable information about the River Dart, (c) George Millar, and Gustel Planz and Paul Rampling for their moral support and (d) Damian Shirtcliff for his patience, friendship and support for this study.
References
Allen, E., 2001. The Dart estuary: Impacts of Farming Techniques on water quality in the River. BSc Dissertation. University of Bournemouth, Bournemouth, UK.
Attrill, M.J. and Depledge, M.H., 1997. Community and population indicators of ecosystem health: targeting links between levels of biological organisation. Aquat. Toxicol., 38, 183197.
Bryan, G.W., 1979. Bioaccumulation of marine pollutants. Phil. Trans. Roy. Soc. Lond., B, 286, 483505.
accumulation and effects of heavy metals in sediments with special reference to United Kingdom estuaries: a review. Environ. Pollut., 76, 89131.
Davies, A.G. and Thorne, P.D., 2002. 1DV-Model of sand transport by waves and currents in the rippledbed regime. In: Coastal
engineering 2002, Proc. 28th Intl. Conf. World Scientific,
Singapore. Held July 712, 2002, Cardiff, Wales, UK. Davies, J., 1991. Marine Nature Conservation Review. Benthic
marine ecosystems: a review of current knowledge for Great Britain and the North-east Atlantic. Part 2. Reviews within MNCR Coastal Sectors, Chpt. 8 Western Channel.
Depledge, M.H. and Rainbow, P.S., 1990. Models of regulation and accumulation of trace metals on marine invertebrates. Comp. Biochem. Physiol., 97C, 17.
Duff, P. McL. D., 1992. Economic geology. In: Geology of England and Wales, P. McL. D. Duff and A.J. Smith (Eds.), Geol. Soc. Lond. 589637.
EA, 1997. Dart Consultation Report, June 1997. Environment Agency, Exeter, UK.
EA, 1998. River Dart Action Plan, July 1998. Environment Agency South West Region, Exeter, UK.
EA, 1999. The state of the environment of England and Wales: Coasts. Environment Agency, Bristol, UK.
EA, 2005. Environmental Water Quality Standards (NR341). Environment Agency, Bristol, UK.EA, 1999.
Eisler, R., 1987. Mercury hazards to fish, wildlife and invertebrates: a synoptic review. US Fish. Wildlife Serv. Biol. Rpt. 85, 110.
Engel, D.W. and Brouwer, M., 1987. Metal regulation and moulting in the blue crab: Callinectes sapidus: metallothionein function in metal metabolism. Biol. Bull., 173, 239251. Engel, D.W., Sunda, W.G. and Fowler, B.A., 1981. Factors
affecting trace metal uptake and toxicity to estuarine organisms. I. Environmental Parameters. In: Biological Monitoring of marine pollutants, F.J.Vernberg, A.Calabrese, F.P.Thurberg and W.B.Vernberg, (Eds.), Academic Press, New York, USA. Gray, J.S., Clarke, K.R., Warwick, R.M. and Hobbs, G., 1990.
Detection of initial effects of pollution on marine benthos: an example from the Ekofisk and Eldfisk oilfields. North Sea. Mar. Ecol. Prog. Ser., 66, 285299.
Gueiros, B.B., Machado, W., Lisboa Filho, S.D. and Lacerda, L.D., 2003. Manganese behaviour at the Sediment water interface in a mangrove dominated area in Sepetiba Bay, SE Brazil. J. Coastal Res., 19, 550559.
IH, 1998. Hydrological Data UK: Hydrometric register 1991-95. Centre for Ecology and Hydrology, Wallingford, UK. 207pp. Kelly, T.D., 1982. A geochemical survey of the sediments of the
river Dart. MSc Thesis. Dept. Marine Science, Plymouth Polytechnic, Plymouth, UK.
Kuo, A.Y., Byrne, R.J., Hyer, P.V.. Ruzecki, E.P. and Brubacker, J.M., 1990. Practical application of theory for tidal intrusion fronts. J. Waterw. Port Coast. Oc.-ASCE, 116, 341351. Lakhan, V.C., Cabana, K. and LaValle, P.D., 2003. Relationship
between grain size and heavy metals in sediments from beaches along the coast of Guyana. J. Coastal Res., 19, 600608. Leung, K.M.Y. and Furness, R.W., 2000. Effects of animal size
on concentrations of metallothionein and metals in periwinkles Littorina littorea collected from the Firth of Clyde, Scotland. Mar. Pollut. Bull., 39, 126136.
Ley, S., 2000. The Dart estuary: A critical assessment of crab trapping activities and associated management options with the regards to the shore crab Carcinus maenas. BSc Dissertation, University of Bournemouth, Bournemouth, UK.
Increased selenium threat as a result of invasion of the exotic bivalve Potamocorbula amurensis into the San Francisco Bay-Delta. Aquat. Toxicol., 57, 5164.
Long, J.L.A., House, W.A., Parker, A. and Rae, J.E., 1998. Micro-organics associated with sediments in the Humber Rivers. Sci. Total Envir., 210/211, 229253.
Mason, A.Z. and Jenkins, K.D., 1995. Metal Detoxification in aquatic organisms. In: Metal speciation and bioavailability in aquatic systems, A.Tessier and D.R.Turner (Eds.) Volume 3 in JUPAC series of analytical and physical chemistry of environmental systems. Wiley, New York, USA.
Matthiessen, P. and Law, R.J., 2002. Contaminants and their effects on estuarine and coastal organismsin the United Kingdom in the late twentieth century. Environ. Pollut., 120, 739757. Neal, C., 2001. The water quality of eastern UK rivers: the study
of a highly heterogeneous environment. In: Land Ocean Interaction: measuring and modelling fluxes from river basins to coastal seas, D.A. Huntley, G.J.L. Leeks and D.E. Walling (Eds.), IWA Publishing, London, UK. 69104.
Neal, C., 2003. Surface and groundwater quality and health, with a focus on the United Kingdom. In: Geology and Health, closing the gap, H.Skinner and A.R.Berger (Eds.), Oxford University Press, New York, USA. 8794.
Neal, C. and Robson, A.J., 2000. A summary of river water quality data collected within the Land Ocean Interaction Study: core data for Eastern UK rivers draining to the North Sea. Sci. Total Envir., 251/252, 585665.
Neal, C. and Davies, H., 2003 Water quality fluxes for eastern UK rivers entering the North Sea: a summary of information from the Land Ocean Interaction Study (LOIS). Land Ocean Interaction: Processes, Functioning and Environmental Management: a UK Perspective. Sci. Tot. Envir., 314/316, 821 882.
Neal, C., Smith, C.J., Jeffery, H.A., Jarvie, H.P. and Robson, A.J., 1996. Trace element concentrations in the major rivers entering the Humber estuary, N. E. England. J. Hydrol., 182, 3764. Neal, C., Robson, A.J., Jeffery, H.A., Harrow, M.L., Neal, M.,
Smith, C.J. and Jarvie, H.P., 1997. Trace element inter-relationships for the Humber rivers: inferences for hydrological and chemical controls. (Special Issue) Sci. Total Envir., 194/
195, 321343.
Newman, M.C., Roberts, Jr., M.H. and Hale, R.C., 2002. Coastal and Estuarine Risk Assessment. Lewis Publishers, Boca Raton, FL, USA.
Paarlberg, A.J., Knaapen, M.A.F., de Vries, M.B., Hulscher, S.J.M.H. and Wang, Z.B., 2005. Biological influences on morphology and bed composition of an intertidal flat. Estuar. Coast. Shelf Sci., 54, 577590.
Parret, A., 1998. Pollution impacts in North Sea fish stocks. Report for WWF-UK. Ref. 96-083. 122pp.
Priestley, A.D. and Thain, R.H., 2003. Water column variability at an estuarine mouth: implications for multibeam sonar surveys. Proc 3rd Int. Conference on High Resolution Surveys in Shallow Water, Sydney, Australia.
Schlekat, C.E., Lee, B.G. and Luoma, S.N., 2002.Dietary metal exposure and toxicity by aquatic organisms: Implications for ecological risk assessment. In: Coastal and Estuarine Risk Assessment, M. Newman (Ed.), Lewis Publishers, Boco Raton, FL, USA. 151188.
Schratzberger, M., Gee, J.M., Rees, H.L., Boyd, S.E. and Wall, C.M., 2000. The structure and taxonomic composition of sublittoral meiofauna assemblages as an indicator of the status of marine environments. J. Mar. Biol. Assn. UK., 80, 969980.
Schuwerack, P.-M.M., 1994. Environmental modelling: evaluating an integrated river basin model, the Escaut/Scheldt Basin. Cranfield University, Cranfield, UK. (MSc Thesis).
Schuwerack, P-M.M., 2002. Aquatic Pollution and Disease: Stress responses in an Invertebrate and vertebrate Host. PhD Thesis. Royal Holloway, University of London, London, UK. Schuwerack, P,-M.M. and Lewis, J.W., 2003a. The mode of action
of acute and chronic concentrations of waterborne Cd in the digestive gland of the acclimated infested freshwater crabs (Potamonautes warreni). Cell Tissue Res., 312, 249263. Schuwerack, P,-M.M. and Lewis, J.W., 2003b. Cellular responses
to increasing Cd concentrations in the freshwater crab, Potamonautes warreni, harbouring microbial gill infestations. Cell Tissue Res., 313, 335346.
Schuwerack, P.-M.M., Lewis, J.W. and Jones, P.W., 2001. The potential use of the South African River Crab, Potamonautes warreni Calman, as a bioindicator species for heavy metal contamination. Ecotoxicol., 10, 159167.
Schuwerack, P.-M.M., Lewis, J.W. and Jones, P.W. Native and Cd-induced metal-binding dynamics in the digestive gland of infested freshwater crabs (Potamonautes warreni). Ecotoxicol. Environ. Safe, (in press)
Schuwerack, P.-M.M., Lewis, J.W. and Jones, P.W. Interactive cellular and physiological responsesof the freshwater crab, Potamonautes warreni to cadmium and microbial gill infestations. Ecotoxicol. Environ. Safe, (in press)
South West Water, 2002. Great news for Dartmouth. http:// www.southwestwater.co.uk
Spicer, J.I. and Weber, R.E., 1992. Respiratory impairment by water-borne cooper and zinc in the edible crab Cancer pagurus (L.) (Crustacea:Decapoda) during hypoxic exposure. Mar. Biol,
112, 429435.
Taylor, H.H. and Anstiss, J.M., 1999. Copper and haemocyanin dynamics in aquatic invertebrates. Mar. Freshwater Res., 50, 907931.
Thain, R.H., Priestley, A.D. and Davidson, M.A., 2004. The formation of a tidal intrusion front at the mouth of a macro-tidal, partially mixed estuary: a field study of the Dart estuary, UK. Estuar. Coast. Shelf Sci., 61, 161172.
Waeles, M., Riso, R.D. and Le Corre, P., 2005. Seasonal variations of cadmium speciation in the Penze Estuary, NW France. Estuar. Coast. Shelf Sci., 65, 143152.
Warwick, R.M., 1986. A new method for detecting pollution effects on marine macrobenthic communities. Mar. Biol., 92, 557562. Warwick, R.M., 1993. Environmental impact studies on marine communities: pragmatic considerations. Aust. J. Ecol., 18, 63 80.
Watzkin, M.C., McIntosh, A.W., Brown, E.A., Lacey, R., Lester, D.C., Newbrough, K.L. and Williams, A.R., 1997. Assessing sediment quality in heterogeneous environments: a case study of a small urban harbor in lake Champlain, Vermont, USA. Environ. Toxicol. Safety, 16, 21252135.
Westrich, B. and Förstner, U., 2005. Sediment dynamics and pollutant mobility in rivers (SEDYMO). J. Soils Sediments, 5, 197-200.Wu, Y., Falconer, R. and Lin, B., 2005. Modelling trace metal concentration distributions in estuarine waters. Estuar. Coast. Shelf Sci., 64, 699709.
Wu, Y., Falconer, R. and Lin, B., 2005. Modelling trace metal concentration distributions in estuarine waters. Estuarine, Coast. Shelf Sci., 64, 699709.
Zhou, H., Peng, X. and Pan, J., 2004. Geochemical characteristics and sources of some chemical Components on sediments of Zhujiang (Pearl) River Estuary. Chinese J. Ocean. Limnol., 22, 3443.