HAL Id: hal-00296102
https://hal.archives-ouvertes.fr/hal-00296102
Submitted on 10 Jan 2007
HAL is a multi-disciplinary open access
archive for the deposit and dissemination of
sci-entific research documents, whether they are
pub-lished or not. The documents may come from
teaching and research institutions in France or
abroad, or from public or private research centers.
L’archive ouverte pluridisciplinaire HAL, est
destinée au dépôt et à la diffusion de documents
scientifiques de niveau recherche, publiés ou non,
émanant des établissements d’enseignement et de
recherche français ou étrangers, des laboratoires
publics ou privés.
reflectance for aerosol remote sensing using MERIS L1
data
W. von Hoyningen-Huene, A. A. Kokhanovsky, M. W. Wuttke, M. Buchwitz,
S. Noël, K. Gerilowski, J. P. Burrows, B. Latter, R. Siddans, B. J. Kerridge
To cite this version:
W. von Hoyningen-Huene, A. A. Kokhanovsky, M. W. Wuttke, M. Buchwitz, S. Noël, et al.. Validation
of SCIAMACHY top-of-atmosphere reflectance for aerosol remote sensing using MERIS L1 data.
Atmospheric Chemistry and Physics, European Geosciences Union, 2007, 7 (1), pp.97-106.
�hal-00296102�
Atmos. Chem. Phys., 7, 97–106, 2007 www.atmos-chem-phys.net/7/97/2007/ © Author(s) 2007. This work is licensed under a Creative Commons License.
Atmospheric
Chemistry
and Physics
Validation of SCIAMACHY top-of-atmosphere reflectance for
aerosol remote sensing using MERIS L1 data
W. von Hoyningen-Huene1, A. A. Kokhanovsky1, M. W. Wuttke1, M. Buchwitz1, S. No¨el1, K. Gerilowski1,
J. P. Burrows1, B. Latter2, R. Siddans2, and B. J. Kerridge2
1Institute of Environmental Physics/Remote Sensing, University of Bremen, Germany 2Space Science and Technology Department, Rutherford Appleton Laboratory, Chilton, UK
Received: 2 April 2004 – Published in Atmos. Chem. Phys. Discuss.: 18 January 2006 Revised: 2 November 2006 – Accepted: 12 December 2006 – Published: 10 January 2007
Abstract. Aerosol remote sensing is very much dependent
on the accurate knowledge of the top-of-atmosphere (TOA) reflectance measured by a particular instrument. The status of the calibration of such an instrument is reflected in the quality of the aerosol retrieval. Current data of the SCIA-MACHY (SCanning Imaging Absorption spectroMeter for Atmospheric CHartographY) instrument (operated with the data processor version 5 and earlier) give too small values of the TOA reflectance, compared e.g. to data from MERIS (Medium Resolution Imaging Spectrometer), both operating on ENVISAT (ENVIronmental SATellite). This effect causes retrievals of wrong aerosol optical thickness and disables the processing of aerosol parameters.
From an inter-comparison of MERIS and SCIAMACHY TOA reflectance, for collocated scenes correction factors are derived to improve the insufficient SCIAMACHY L1 data calibration for data obtained with the processor 5 for the pur-pose of aerosol remote sensing. The corrected reflectance has been used for tests of remote sensing of the aerosol opti-cal thickness by the BAER (Bremen AErosol Retrieval) ap-proach using SCIAMACHY data.
1 Introduction
In recent time several approaches for the retrieval of the aerosol optical thickness (AOT) over land and ocean from nadir scanning satellite radiometers have been developed. For MODIS over land the cross-correlation approach (Kauf-man et al., 1997) is used. For SeaWiFS (Sea viewing Wide Field Sensor) and MERIS (Medium Resolution Imag-ing Spectrometer, c.f. MERIS SAG, 1995; Bezy et al., 2000) the BAER approach (Bremen AErosol Retrieval), c.f. von Hoyningen-Huene et al. (2003) has been tested successfully,
Correspondence to: W. von Hoyningen-Huene
using 8 visible and NIR channels of the instruments. SCIA-MACHY and MERIS are operated by ESA onboard of EN-VISAT. Since SCIAMACHY, c.f. Bovensmann et al. (1999) is providing high spectral resolution and a much extended spectral range, spectral information as used in the MERIS BAER approach is available in the bands 3, 4 and 5. There-fore an attempt was made to adapt the BAER approach to SCIAMACHY data too. However, the formal use of the BAER approach leads to physically not meaningful negative AOT, if one uses SCIAMACHY top-of-atmosphere (TOA) reflectance directly. This is due to the fact, that the measured TOA reflectance, using data of the processor versions 4.02b, 5.01 up to 5.05 within the required spectral bands can be be-low the value for the Rayleigh path reflectance, which should be never the case. These findings are also reported by De Graaf and Stammes (2003); Acarreta and Stammes (2005); Acarreta et al. (2004); Kokhanovsky et al. (2006).
Therefore the application of any retrieval procedure for the determination of aerosol parameters, as AOT or absorbing aerosol index (AAI) in a quite accurate, physically correct range requires the improvement of the values of the TOA reflectance for the SCIAMACHY bands, used for the aerosol retrieval.
Since the BAER approach has been applied successfully with correctly calibrated MERIS L1 data, these MERIS data will be used for the derivation of correction factors to im-prove the SCIAMACHY TOA reflectance for the purpose of aerosol remote sensing. Applying these corrections, a first attempt is made to retrieve AOT at 0.442 µm from SCIA-MACHY data.
2 SCIAMACHY data preparation and reflectance
cor-rection
For the purpose of correcting the TOA reflectance, obtained with SCIAMACHY L1b data, coinciding SCIAMACHY and
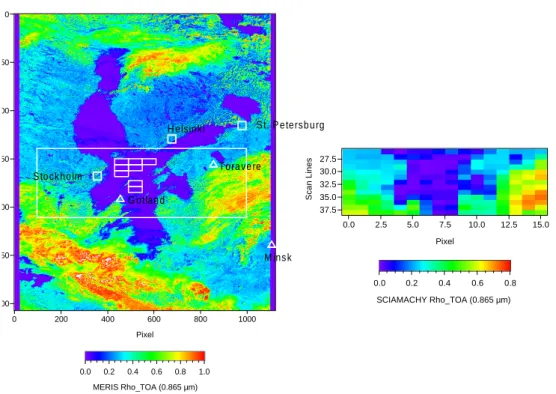
0 200 400 600 800 1000 0 250 500 750 1000 1250 1500 Pixel 0.0 0.2 0.4 0.6 0.8 1.0 MERIS Rho_TOA (0.865 µm) 0.0 2.5 5.0 7.5 10.0 12.5 15.0 27.5 30.0 32.5 35.0 37.5 Pixel Scan Lines 0.0 0.2 0.4 0.6 0.8 SCIAMACHY Rho_TOA (0.865 µm) S t. P e tersb u rg S to ck ho lm T ora ve re G otlan d M ins k H e lsin ki
Fig. 1. Coinciding MERIS (left) and SCIAMACHY (right) scenes of the 3 August 2002, used for the comparisons. The scenes present the
TOA reflectance for the spectral band 0.865 µm. The SCIAMACHY scene and the selected pixels over water of the Baltic Sea without any cloud disturbance are marked by rectangles. The center of the SCIAMACHY scene is located at 58.85◦N and 22.03◦E. The AERONET sites Gotland, Minsk and Toravere are marked as triangles.
MERIS scenes are used. Since both instruments are on board of ENVISAT and scanning in nearly the same swath, a com-parison of the TOA reflectance for the bands 3, 4 and 5 of SCIAMACHY could improve the TOA reflectance for the purpose of the retrieval of the AOT by the BAER approach.
Therefore, for both instruments the TOA reflectance from the L1 data are derived.
The TOA radiance L(λ) from the L1 data is normalized to the solar illumination conditions for each wavelength λ to generate the TOA-reflectance ρTOA(λ):
ρTOA(λ) =
π L(λ) E0(λ)
·M(z0), (1)
where M(z0) is the airmass factor coinciding with the inverse
cosine of the solar zenith angle (SZA) z0 at not very large
values of SZA, E0(λ) is the extraterrestrial irradiance and
L(λ) is the measured TOA radiance. The function E0(λ) is
provided for MERIS and SCIAMACHY from the L1 data sets.
Since both instruments (SCIAMACHY and MERIS) dif-fer in their spectral and spatial observation parameters, the data must be made comparable. In particular, they must be transferred to comparable spectral bands, band widths and spatial scales. Also we should observe the same uniform tar-get (preferably, for clear sky conditions).
For the comparability of the spectral bands the spectrum of the TOA reflectance of the SCIAMACHY measurement
for the spectral regions and band widths of channels of the MERIS instrument has been extracted and integrated over the band width.
Due to the different spatial scales of the TOA reflectance, the data from all MERIS pixels within the SCIAMACHY 30×60 km pixel area (determined by the edge coordinates of a SCIAMACHY pixel) have been averaged within the area.
The comparison of such different spatial scales also re-quires to exclude large inhomogeneities, such as clouds and inhomogeneous surface properties within the region of a SCIAMACHY pixel. Therefore, for this comparison homo-geneous water surfaces are used. The value of the standard deviation of ρMERISTOA within one SCIAMACHY pixel should be lower than 10%. In the most selected case it is even lower than 5%. The exclusion of inhomogeneous pixels re-moves the majority of SCIAMACHY pixels from the inter-comparison, however it reduces the standard deviation and fits the data for one SCIAMACHY band on a linear relation. All other pixels show much higher inhomogeneities in terms of much larger standard deviations of the TOA reflectance of the MERIS pixels within one SCIAMACHY pixel. Such pixels with high standard deviations have been not used for the comparison. Figure 1 shows the TOA reflectance for the wavelength band of 0.865 µm for both instruments. The co-inciding area of observations and the selected homogeneous pixels over water surfaces are marked within the MERIS scene.
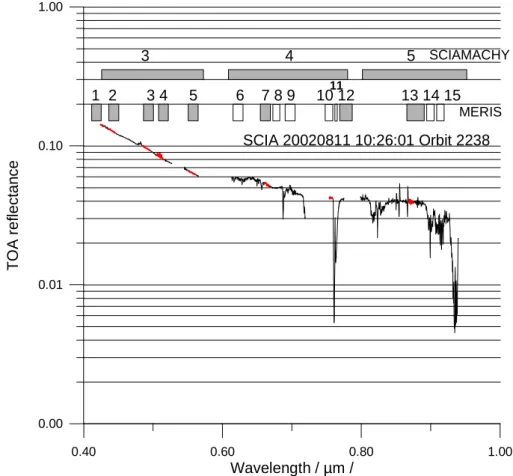
W. von Hoyningen-Huene et al.: SCIAMACHY aerosol remote sensing 99 0.40 0.60 0.80 1.00 Wavelength / µm / 0.00 0.01 0.10 1.00 T O A r e fl e c ta n c e MERIS 3 4 5 SCIAMACHY 1 2 3 4 5 6 7 8 9 10 12 13 14 1511 SCIA 20020811 10:26:01 Orbit 2238
Fig. 2. Example of a SCIAMACHY TOA-reflectance spectrum for the bands 3, 4 and 5 and the position of the comparable MERIS channels.
The MERIS channels used within the BAER approach are indicate in grey. The available channels of MERIS are indicated in white. The integration regions for the comparisons are shown in red.
The selected spectral regions, coinciding with MERIS channels are demonstrated in Fig. 2 and in Table 1. For the comparison only such spectral channels are used, where the spectrum of the TOA reflectance is smooth enough and not disturbed by strong gas absorption. Thus the MERIS chan-nels 11 (O2A-band) and 15 (H2O-band) are not used for
com-parisons. The used MERIS channels are indicated in Table 1. While MERIS has fixed channels with a defined center wavelength and a fixed band width, SCIAMACHY scans a high resolution spectrum with a spectral resolution of about 0.2 nm within one band region. The bands 3 (0.424– 0.565 µm), 4 (0.613–0.775 µm) and 5 (0.798–0.946 µm) are covered by MERIS channels.
The channel 1 of MERIS (see Fig. 2) cannot be used, be-cause of the gap between SCIAMACHY band 2 and band 3. For the determination of a correction factor for band 3 the MERIS channels 2, 3, 4 and 5 could be used.
For the correction factor of SCIAMACHY band 4 only the MERIS channels 7 and 12 are used until now, because they are part of the present BAER approach. Since MERIS pro-vides more spectral information for control and confirmation of the derived correction factor for band 4, the channels 6, 8,
9 and 10 could be added for the comparison. For the compar-ison with MERIS channel 12 we had to avoid disturbances by the O2-A-band, integrating the corresponding SCIAMACHY
data.
For SCIAMACHY band 5 until now only 1 channel of the BAER approach could be used for comparisons. However, also here the MERIS channels 13 and 14 could be added. Especially in the cases of band 5 we avoided to include dis-turbed spectral regions within the comparisons. Here there are several regions affected by stronger narrowband gas ab-sorption and Fraunhofer lines, thus we reduced the selected spectral channel for the purpose of a later aerosol remote sensing.
Examples for SCIAMACHY TOA reflectance spectra from cloudless scenes over the Baltic Sea, which are used within this study, are presented in Fig. 3. Gaseous absorption features (e.g., oxygen A-band centered at 0.76 micrometers) are clearly seen in Fig. 3.
Two different approaches to compare SCIAMACHY and MERIS TOA reflectance are used: (a) simple ratio and (b) linear fitting of data. The latter enables also the consideration of a certain offset.
Table 1. SCIAMACHY bands and MERIS channels with their channel characteristics and the used integration range for the SCIAMACHY
spectrum.
SCIAMACHY MERIS Center Band SCIAMACHY Remarks
band channel wavelength width integration
µm nm range, µm 3 1 0.4125 10 0.424–0.428 incomparable λ 3 2 0.4425 10 0.435–0.445 used 3 3 0.4900 10 0.485–0.495 used 3 4 0.5100 10 0.505–0.515 used 3 5 0.5600 10 0.550–0.560 used 4 6 0.6200 10 – 4 7 0.6650 10 0.660–0.670 used 4 8 0.6813 7.5 – 4 9 0.7088 10 – 4 10 0.7538 7.5 0.754–0.758 used without 4 11 0.7606 3.8 – O2A-Band 4 12 0.7783 15 0.772–0.776 used without O2A-Band 5 13 0.8650 20 0.868–0.875 used, avoid disturbances
5 14 0.8850 10 –
5 15 0.9000 10 – H2O vapor
1)in this particular case MERIS reflectance of channel 12 is compared with the SCIAMACHY range 0.754–758 µm.
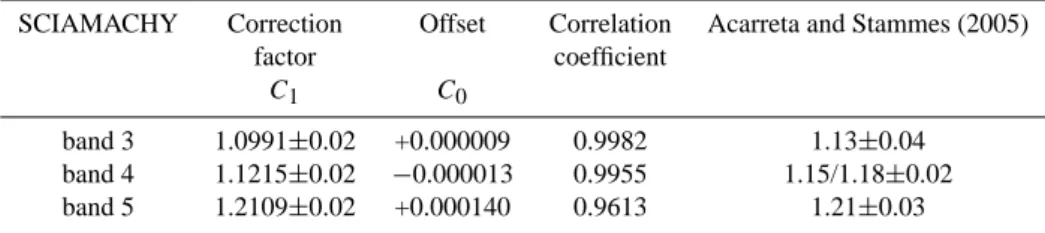
Table 2. Derived average correction factors for the SCIAMACHY TOA reflectance for band 3, 4 and 5.
SCIAMACHY Correction Offset Correlation Acarreta and Stammes (2005)
factor coefficient
C1 C0
band 3 1.0991±0.02 +0.000009 0.9982 1.13±0.04 band 4 1.1215±0.02 −0.000013 0.9955 1.15/1.18±0.02 band 5 1.2109±0.02 +0.000140 0.9613 1.21±0.03
The ratios of the TOA reflectance of both instruments are determined by
C = ρMERIS(λ) ρSCIA(λ)
. (2)
For the different channels of MERIS within one SCIA-MACHY band, e.g. band 3, in the most cases the derived val-ues of C are quite stable. Thus we determined for band 3 an average correction factor by fitting a linear function through the corresponding data for one band. The same is made for the other SCIAMACHY bands.
The obtained relationships between the both reflectance for the coinciding pixels are shown in Fig. 4. The slopes are used to derive average correction factors for the SCIA-MACHY bands, e.g. band 3 (0.424–0.565 µm), band 4 (0.613–0.775 µm) and band 5 (0.798–946 µm).
The correction of the TOA reflectance to the level of MERIS, which is used within the BAER approach for the retrieval of AOT is achieved by:
ρMERIS(λ) = C1·ρSCIA(λ) + C0. (3)
The correction factors obtained are presented in Ta-ble 2. Also correspondent factors obtained by Acarreta and Stammes (2005) are presented in the same table.
These factors are very similar with findings of De Graaf and Stammes (2003) based on a broader database. Also comparison with AATSR (Advanced Along Track Scanning Radiometer), provided by Kerridge (private communication, 2004)1, give very similar results.
However, the correction factors seem to have also a cer-tain spectral variability within the single bands. The obcer-tained
1Kerridge, B. J.: private communication, [email protected], March, 2004.
W. von Hoyningen-Huene et al.: SCIAMACHY aerosol remote sensing 101 0.40 0.60 0.80 1.00 Wavelength / µm / 0.00 0.01 0.10 T O A R e fe lc ta n c e SCIAMACHY 20020803
Fig. 3. Examples of SCIAMACHY spectra of the TOA-reflectance
for the selected cloud free pixels over the Baltic Sea area at 3 August 2002.
0.00 0.04 0.08 0.12 0.16
MERIS TOA Reflectance
0.00 0.04 0.08 0.12 S C IA M A C H Y T O A R e fl e c ta n c e SCIAMACHY(v4.02b) - MERIS Band 3, Band 4, Band 5
Band 3: Rho_MERIS / Rho_SCIA = 1.0991 Band 4: Rho_MERIS / Rho_SCIA = 1.1215 Band 5: Rho_MERIS / Rho_SCIA = 1.2109
Fig. 4. Comparison of TOA reflectance of SCIAMACHY band 3
(MERIS channels 2, 3, 4, 5, black), band 4 (MERIS channels 7 and 12, red) and band 5 (MERIS channel 13, blue). The error bars give the standard deviation of the TOA reflectance of the MERIS pixels within one SCIAMACHY pixel.
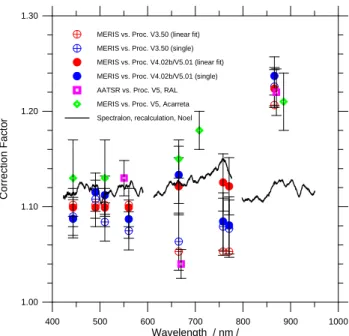
correction factors for the comparison with the single MERIS channels give the spectral behavior presented in Fig. 5.
The minimum of the required correction is in band 4 at about 0.65 µm, the largest correction is in band 5. The
stan-400 500 600 700 800 900 1000 Wavelength / nm / 1.00 1.10 1.20 1.30 C o rr e c ti o n F a c to r
MERIS vs. Proc. V3.50 (linear fit) MERIS vs. Proc. V3.50 (single) MERIS vs. Proc. V4.02b/V5.01 (linear fit) MERIS vs. Proc. V4.02b/V5.01 (single) AATSR vs. Proc. V5, RAL MERIS vs. Proc. V5, Acarreta Spectralon, recalculation, Noel
Fig. 5. Spectral behavior of the correction factors within the range
of SCIAMACHY bands 3, 4 and 5. For comparison of correction factors from different approaches the preliminary re-calibration of SCIAMACHY and a comparison with AATSR reflectance is com-bined. Solid line corresponds to the correction factor to be intro-duced in the SCIAMACHY processor version 6.
dard deviations of the results are increasing with the wave-length, because of decreasing TOA reflectance signals.
In the last time attempts have been undertaken to im-prove the radiometric calibration by an extensive reanaly-sis of on ground calibration measurements of SCIAMACHY. A new procedure has been developed to recalculate some of the radiometric key data from existing end-to-end measure-ments of the OPTEC 5 period in 1999/2000. The calcula-tions were primarily based on a subset of NASA integrating sphere measurements, performed for SCIAMACHY’s radi-ance and irradiradi-ance. At the same time calibrations with a SPECTRALON diffuser have been made by Noel (2004), Lichtenberg et al. (2005). By recommendation of Lichten-berg et al. (2005) the best calibration is obtained using the SPECTRALON diffuser. The derived new SCIAMACHY key data show a significant difference to the on-ground ambi-ent measured and calculated Bi-directional Reflectance Dis-tribution Function (BRDF) keydata of SCIAMACHY’s Ele-vation Scan Mirror Diffuser (ESM diffuser). Together with a re-determined nadir and limb sensitivity of the instrument, this leads to correction factors for both solar irradiance and reflectance, going into the same directions, like the correc-tion factors derived from the comparison with MERIS TOA reflectance discussed above. First tests with in-flight mea-surements show a significant improvement of the quality of the level-1 data products when using these new key data. The planned SCIMACHY processor 6 calibration data are given by a black curve in Fig. 5.
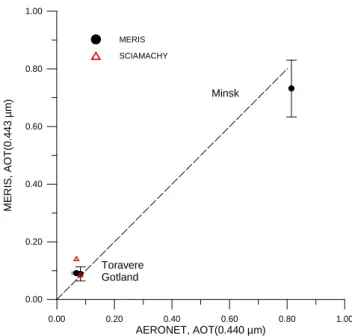
0.00 0.20 0.40 0.60 0.80 1.00 AERONET, AOT(0.440 µm) 0.00 0.20 0.40 0.60 0.80 1.00 M E R IS , A O T (0 .4 4 3 µ m ) Minsk Toravere Gotland MERIS SCIAMACHY
Fig. 6. Comparison of AOT for 0.443 µm channel, retrieved from
MERIS (black dots) and SCIAMACHY (red triangles) with ground based measurements by the AERONET instruments in Gotland, Toravere and Minsk.
Comparing obtained correction factors, given by the dif-ferent investigations with effect of the radiometric key data on the top-of-atmosphere reflectance, one has a comparable range for SCIAMACHY band 3 and band 4. A remaining discrepancy exists for the wavelength range close 0.870 µm. All correction factors from vicarious calibrations indicate an underestimation of more than 20%, while the key data are lower.
After these investigations the derived correction factors have been be applied to data of processor version 4.03b/5.01 for the SCIAMACHY bands 3, 4 and 5 to improve the TOA reflectance for the purpose of the application of the BAER approach, resulting in the retrieved AOT from cloud free SCIAMACHY data.
3 Short description of the BAER approach
The BAER approach has been developed for the aerosol re-mote sensing over land surface using SeaWiFS or MERIS L1 data, c.f. von Hoyningen-Huene et al. (2003). The BAER approach separates the aerosol reflectance by sub-traction of the contributions of Rayleigh scattering and the surface reflectance for each pixel. For this purpose the approach makes use of the solution of the radiative transfer equation for the TOA reflectance, as described by Kaufman et al. (1997) and derives the aerosol reflectance:
ρAer(λ) = ρTOA(λ) − ρRay(λ, z0, zS, pSurf(z))
−T (λ, MS) · T (λ, M0) · ASurf(λ, z0, zS) 1 − ASurf(λ, z0, zS) · ρHem(λ)
. (4)
Here ρAer(λ) and ρTOA(λ) are the required aerosol
re-flectance and the TOA rere-flectance, respectively. T (λ, M) is the total atmospheric transmission, containing direct and diffuse transmission for illumination and viewing geometry given as T (λ, M)=TRay(λ, M)·TAerGuess(λ, M), which are the total transmittances including Rayleigh scattering and aerosol extinction. The latter requires a rough estimation of an AOT, which is performed at 0.443 µm using the assump-tion of a “black” surface. M0and MSare the air mass factors for the sun zenith distance zo and the observer zenith dis-tance zS. ρRay(λ, z0, zS, pSurf(z)) is the path reflectance of
the Rayleigh scattering. ASurf(λ, z0, zS) is the surface albedo and ρHem(λ) is the hemispheric atmospheric reflectance. The
influence of the hemispheric reflectance is less important over low reflecting surfaces (ocean and green vegetation in the blue region of the spectrum). A description of the used parameterizations for the total transmittances and the hemi-spheric reflectance is given in the Appendix.
The BAER approach comprises the following main steps to determine the aerosol reflectance as the basis for the ap-plication of look-up-tables (LUT), which relate AOT and aerosol reflectance:
(a) the determination of the spectral TOA reflectance for the selected bands (for SCIAMACHY, in this step the cor-rection factors are used);
(b) the subtraction of the Rayleigh path reflectance for the geometry conditions of illumination and observation within the pixel;
(c) the estimation of the spectral surface reflectance for land and ocean surfaces by mixing different basic spec-tra(Normalized Differential Vegetation Index (NDVI) equal to the ratio of the TOA reflectance difference at wavelengths 0.870 and 0.675 micrometers to their sum is used over land and Normalized Differential Pigment Index (NDPI) equal to the ratio of reflectance difference at 0.443 and 0.560 microm-eters to the TOA reflectance at 0.490 micrommicrom-eters is used over water for estimations of contributions of different spec-tral contributions to the total surface spectrum);
(d) the spectral AOT smoothing, using an Angstr¨om power law, by the iterative modification of the apparent surface re-flectance.
The aerosol reflectance ρAer(λ) is then used to derive
AOT δA(λ) applying LUT: δA(λ)=f (ρAer(λ)). The LUT
is obtained by radiative transfer modelling. In this case for the LUT aerosol parameters, mainly aerosol phase functions with increased lateral scattering, obtained in the LACE-98 experiment (Ansmann et al., 2001; von Hoyningen-Huene et al., 2003) are used. These parameters have shown to be very robust in a lot of other applications as for the determination
W. von Hoyningen-Huene et al.: SCIAMACHY aerosol remote sensing 103 0 200 400 600 800 1000 0 250 500 750 1000 1250 1500 Pixel Scan Line 0.0 0.2 0.4 0.6 0.8 1.0 AOT(443 nm) 0 4 8 12 13 18 23 Pixel Scan Line 0.0 4.0 8.0 12.0 26 31 36 Pixel Scan Line 0 4 8 12 40 45 50 Pixel Scan Line 0.0 0.2 0.4 0.6 0.8 1.0 AOT(443 nm)
M E R IS
S C IA M A C H Y
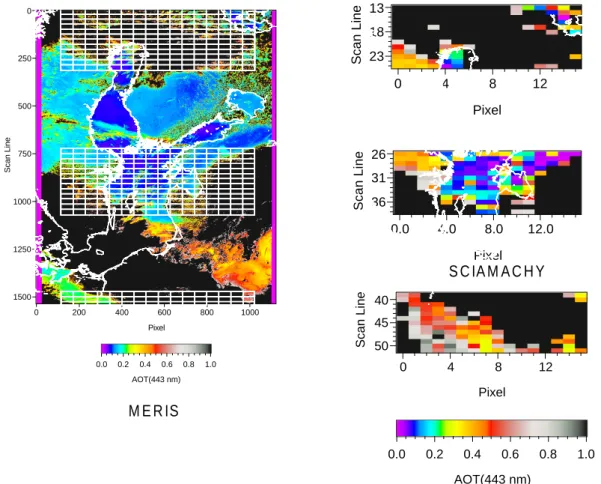
Fig. 7. The aerosol optical thickness for 0.443 µm channel, retrieved from MERIS (left) and SCIAMACHY (right). The color scale is the
same for both cases. AOT>1 (disturbed by clouds) is coded in black.
of the AOT close to ground-based data, c.f. Kokhanovsky et al. (2004); Lee et al. (2004); von Hoyningen-Huene et al. (2004). Further details of the aerosol retrieval algorithm are given by von Hoyningen-Huene et al. (2003).
4 First results with the BAER approach using
SCIA-MACHY L1b data
For a first test of the possibility to retrieve AOT with SCIA-MACHY, the BAER approach in the same way is used, like it is developed for the application with MERIS or SeaWiFS data, von Hoyningen-Huene et al. (2003, 2004), but applying the correction factors from the analysis above.
The result for the channel 2 (0.443 µm) is compared (a) with ground-based AERONET measurements, c.f. Holben et al. (1998), presented in Fig. 6 and (b) with the retrievals, made with MERIS data, presented in Fig. 7.
With the correction factors for SCIAMACHY, AOT in a physically meaningful range can be obtained. For cloud free sections AOTs comparable with those determined by two AERONET instruments in the scene could be obtained. However, if one compares the retrieved values within the
whole scene, c.f. Fig. 7, one must recognize, that they de-viate significantly from the results obtained by MERIS.
The reasons might be very different: (a) insufficient cor-rections of biasses within the scan line, caused by mirror and polarization corrections applied during the L1c data process-ing usprocess-ing older processor versions (Skupin et al. , 2004), (b) insufficient cloud screening for the SCIAMACHY pixels, (c) different mixing of the land surface and ocean surface prop-erties for SCIAMACHY pixels as compared to MERIS, (d) use of an inadequate digital elevation model (GTOPO30) for the scale of SCIAMACHY pixels. Therefore, in the present status of the adaptation of the aerosol remote sensing to the SCIAMACHY data a comparison must be restricted to sim-ple cases, e.g. no mountain regions with significant surface elevations, scenes with no or very few clouds.
For the comparability of the results we integrated the MERIS results over the size of the SCIAMACHY pixels. The standard deviation and the fully cloudy MERIS pixels are used to reject pixels as cloud contaminated. Further, we excluded all pixels, with surface elevations >250 m. Thus the most pixels over Sweden, which had strong positive devi-ations in AOT, have been removed. The result for the channel
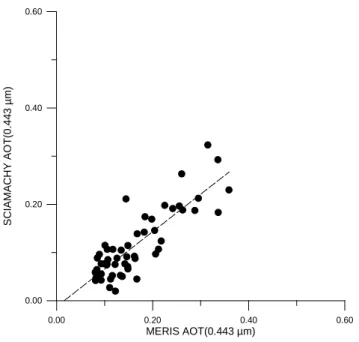
0.00 0.20 0.40 0.60 MERIS AOT(0.443 µm) 0.00 0.20 0.40 0.60 S C IA M A C H Y A O T (0 .4 4 3 µ m )
Fig. 8. The aerosol optical thickness for 0.443 µm channel, re-trieved from MERIS and SCIAMACHY for the selected pixels.
at 0.443 µm is presented in Fig. 8. This selection reduces the number of comparable pixels. The fit between both re-sults gives AOTSCIA=0.778·AOTMERIS−0.01235. This
re-sult shows that principally the AOT can be derived by BAER using SCIAMACHY measurements and the instrument is sensitive enough to observe aerosol properties, if an adequate calibration is available. The present approach to retrive AOT from SCIAMACHY data underestimates AOT for cloud free scenes as compared with the results of MERIS retrievals.
5 Conclusions
This study showed, that SCIAMACHY measurements are sensitive enough for remote sensing of aerosol properties, if one applies correction factors to the measured TOA re-flectance, or even better one applies the improved radiomet-ric calibration by the improved radiometradiomet-ric key data as de-scribed by Noel (2004), Lichtenberg et al. (2005). This will be made for SCIAMACHY processor version 6.0.
Since remote sensing of AOT as well also of aerosol ab-sorption index is very sensitive to the exact level of TOA re-flectance, the L1c calibration of all processor version before version 6.0 was not sufficient to this task and required addi-tional determination and application of correction factors, as it has been made in this study.
Correction factors could be derived from comparisons of coinciding SCIAMACHY and MERIS scenes.
Performing this study, we realized, that the selection of useful coinciding data of both instruments, MERIS and SCIAMACHY, is sometimes difficult, because of problems with the availability of both information for the suitable
ob-servation situation (limb-nadir matching, cloud disturbances, missing data, different processing levels etc.).
The different processing levels (including version 5) do not improve the reflectance level at all in the required way. They give improvements for the consideration of polarization effects and reduce the bias within one scan line, however not the general level of the reflectance. However, the bias within the scan line (from W to E) seems to be not fully compen-sated. Concluding from this first results of AOT retrievals, a remaining bias within the scan line can be observed, giving higher AOT at the left side and lower at the right side of the scan line.
The finding for the correction factors are consistent with findings of De Graaf and Stammes (2003) and Acarreta and Stammes (2005), providing similar investigations over bright desert surface, using MERIS and GOME. Although there is a small difference for SCIAMACHY band 4 (see Table 2). The same is found by Kerridge (private communication, 2004)1comparing SCIAMACHY reflectance with AATSR. Kokhanovsky et al. (2004) came from investigations of cloud retrieval techniques and their comparison with MERIS re-sults to very comparable rere-sults with this study. And, finally, the recalculation of the calibration key data, using the on ground measurements of the SCIAMACHY instrument dur-ing the OPTEC-5 campaign give very similar results for the considered spectral region. This confirms an urgent need to find consolidated results for an improve of the radiometric calibration of the SCIAMACHY instrument and its imple-mentation to the L1 processing.
The tests of the new radiometric key data of the spectralon calibration gave promising results (Acarreta and Stammes (2005)) reducing the deviations between MERIS and SCIA-MACHY to few percent. Considering the given accuracy of the MERIS reflectance (below 4 percent; Delwart et al., 2004), the new radiometric key data eliminate significant ra-diometric differences between both instruments. Therefore the new radiometric key data will be used now by the new data processor (version 6) to calibrate SCIAMACHY data.
A very important step within the application of an aerosol remote sensing algorithm for SCIAMACHY data is a rig-orous cloud screening, which is still an open issue for this scale.
Appendix A
Total transmission and hemispheric reflectance
In Eq. (4) total atmospheric transmissions and hemispheric reflectance are used, containing the effect of multiple scatter-ing. The total transmittance and hemispheric reflectance are determined using the SCIATRAN radiative transfer model, Rozanov et al. (2001) and the results are applied in a pa-rameterized form for a fast processing within the retrieval
W. von Hoyningen-Huene et al.: SCIAMACHY aerosol remote sensing 105
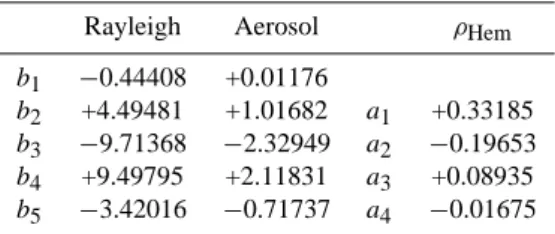
Table A1. Polynomial coefficients for the determination of the total
transmissions and hemispheric reflectance.
Rayleigh Aerosol ρHem b1 −0.44408 +0.01176
b2 +4.49481 +1.01682 a1 +0.33185 b3 −9.71368 −2.32949 a2 −0.19653 b4 +9.49795 +2.11831 a3 +0.08935 b5 −3.42016 −0.71737 a4 −0.01675
procedure. Here we separate the total atmospheric transmis-sion into their fractions for Rayleigh and aerosol scattering: T (λ, M(z)) = TRay(λ, M(z)) · TAer(λ, M(z)), (A1)
with the total transmission for the Rayleigh and aerosol scat-tering, respectively,
TRay(λ, M(z)) = exp (−βRay·δRay(λ) · M(z)),
TAer(λ, M(z)) = exp (−βAer·δAer(λ) · M(z)), (A2)
where M(z) is the airmass factor for the zenith distance z, δX(λ) – the optical thickness for Rayleigh or aerosol scatter-ing and βX(X≡Ray, Aer) is a weighting factor for the com-bined effect of multiple and single scattering of molecules and aerosols, depending on M(z). For the aerosol an asym-metry parameter g=0.7 is assumed. The weighting factors βXare obtained as polynomials of M(z).
βRay= 5
X i=1
biRay·M(z)−(i−1)) (A3)
βAer= 5
X i=1
bAeri ·M(z)−(i−1)) (A4)
The coefficients of the polynomials are given in Table A1. For the hemispheric reflectance the following parametriza-tion is obtained: ρHem(λ) = 4 X i=1 ai·δi(λ) (A5)
For the cases of aerosol remote sensing over Europe the error of the parametrization is below 5% compared with the results of exact radiative transfer calculations.
Acknowledgements. The authors like to express their gratitude to the operators of the AERONET sites in Gotland, Minsk and Toravere, B. Hakansson, A. Chaikovsky, P. Goloub and O. K¨arner. This work has been supported by the German BMBF grant 50EE0012 within the SCIAVAL program.
Edited by: U. Platt
References
Acarreta, J. R. and Stammes, P.: Calibration comparison between SCIAMACHY and MERIS onboard of ENVISAT, IEEE GRSL, 2, 31–35, 2005.
Acarreta, J. R., Stammes, P., and Tilstra, L. G.: Reflectance compar-ison between SCIAMACHY and MERIS. Proc. of ESA ACVE-2 Workshop, ACVE-2–7 May ACVE-2004, Frascati, ESA Special Publication SP-562, August 2004.
Ansmann, A., Wandinger, U., Wiedensohler, A., and Leiterer, U.: Lindenberg Aerosol Characterization Experiment 1998 (LACE 98): Overview, J. Geophys. Res. 107(D21), 8129, doi:10.1029/2000JD000233, 2002.
Bezy, J.-L., Delwart, S., and Rast, M.: MERIS – A new generation of ocean colour sensor onboard ENVISAT, ESA Bulletin, 103, 48–56, 2000.
Bovensmann, H., Burrows, J. P., Buchwitz, M., Frerick, J., No¨el, S., Rozanov, V. V., Chance, K. V., and Goede, A. H. P.: SCIA-MACHY: Mission objectives and measurement methods, J. At-mos. Sci., 56, 127–150, 1999.
De Graaf, M. and Stammes, P.: Verification of SCIAMACHY’s Ab-sorbing Aerosol Index product, Proc. of ENVISAT Validation Workshop, ESRIN, Frascati, 9–13 December 2003, ESA SP-531, 2003.
Delwart, S., Bourg, L., and Huot, J. P.: MERIS 1st year: Early cali-bration results, Proc. SPIE Sensors, systems and next generation satellites VII, vol. 5234, 379–390, 2004.
Holben, B. N., Eck, T. F., Slutsker, K., Tanr´e, D., Buis, J. P., Set-zer, A., Vermote, E. Reagan, J. A., Kaufman, Y. J., Nakajima, T., Lavenu, F., Jankowiak, I., and Smirnow, A.: AERONET-a federated instrument network and data archive for aerosol char-acterization, Rem. Sens. Environ., 66, 1–16, 1998.
Kasten, F. and Young, A. T.: Revised optical airmass tables and approximation formula, Appl. Opt., 28, 4735–4738, 1989. Kaufman, Y. J., Tanr´e, D., Gordon, H. R., Nakajima, T., Lenoble, J.,
Frouin, R., Grassl, H., Herman, B. M., King, M. D., and Teillet, P. M.: Passive remote sensing of tropospheric aerosol and atmo-spheric correction for the aerosol effect, J. Geophys. Res., 102, 16 815–16 830, 1997.
Kokhanovsky, A. A., von Hoyningen-Huene, W., Bovensmann, H., and Burrows, J. P.: The determination of the atmospheric optical thickness over Western Europe using SeaWiFS imagery, IEEE Transac. Geosci. Rem. Sens., 42, 824–832, 2004.
Kokhanovsky, A. A., von Hoyningen-Huene, W., Rozanov, V. V., No¨el, S., Gerilowski, K., Bovensmann, H., Bramstedt, K., Buch-witz, M., and Burrows, J. P.: The semi-analytical cloud retrieval algorithm for SCIAMACHY. II. The application to MERIS and SCIAMACHY data, Atmos. Chem. Phys., 6, 4129–4136, 2006, http://www.atmos-chem-phys.net/6/4129/2006/.
Lee, K. H., Kim, Y. J., and von Hoyningen-Huene, W.: Estima-tion of aerosol optical thickness over northeast Asia from Sea-Viewing Wide Field-of-View Sensor (SeaWiFS) data during the 2001 ACE-Asia intensive observation period, J. Geophys. Res., 109, D19S16, doi:10.1029/2003JD004126, 2004.
Lichtenberg, G., Kleipool, Q., Krijger, J. M., van Soest, G., van Hees, R., Tilstra, L. G., Acarreta, J. R., Abel, I., Ahlers, B., Bovensmann, H., Chance, K., Gloudemans, A. M. S., Hoogeveen, R. W. M., Jongma, R., No¨el, S., Pieters, A., Schri-jver, H., Schrijvers, C., Sioris, C.E., Skupin, J., Slijkhuis, S., Stammes, P., and Wuttke, M.: SCIAMACHY Level 1 data:
bration concept and in-flight calibration, Atmos. Chem. Phys., 6, 5347–5367, 2006,
http://www.atmos-chem-phys.net/6/5347/2006/.
MERIS Scientific Advisory Group: MERIS: The Medium Reso-lution Imaging Spectrometer, ESA Technical Report SP-1184, ESA, Noordwijk, 1995.
Noel, S.: Determination of correction factors for SCIAMACHY radiances and irrandiance, Technical Report IFE-SCIA-SN-2004040514, University of Bremen, 2004.
Rozanov, V. V., Buchwitz, M., and Burrows, J. P.: SCIATRAN – A new radiative transfer model for geophysical applications in the 240–2400 nm spectral region: The pseudo-spherical version, Adv. Space Res., 29, 1831–1835, 2001.
Skupin, J., Gerilowski, K., No¨el, S., Wuttke, M., Bovensmann, H., and Burrows, J. P.: Improvement of the SCIAMACHY radio-metric calibration and its validation on solar irradiancees in the spectral range from 240 to 2380 nm, Proc. of ESA ENVISAT and ERS Sympos. 6–10 September 2004, Salzburg, ESA Special Publication SP-572, April 2004.
von Hoyningen-Huene, W., Freitag, M., and Burrows, J. P.: Re-trieval of aerosol optical thickness over land surfaces from top-of-atmospher radiance, J. Geophys. Res., 108, 4260, doi:10.1029/2001JD002018, 2003.
von Hoyningen-Huene, W., Kokhanovsky, A. A., Freitag, M., and Burrows, J. P.: Aerosol retrieval over land surfaces from multi-spectral nadir looking satellite measurements, in: Remote Sens-ing of Clouds and the Atmosphere VIII, edited by: Sch¨afer, K. P., Cameron, A., Carleer, M. R., and Picard, R. H., Proc. of SPIE (SPIE, Bellingham, WA 2004), vol. 5235, 366–374, 2004.