HAL Id: hal-00299157
https://hal.archives-ouvertes.fr/hal-00299157
Submitted on 2 Sep 2004
HAL is a multi-disciplinary open access
archive for the deposit and dissemination of
sci-entific research documents, whether they are
pub-lished or not. The documents may come from
teaching and research institutions in France or
abroad, or from public or private research centers.
L’archive ouverte pluridisciplinaire HAL, est
destinée au dépôt et à la diffusion de documents
scientifiques de niveau recherche, publiés ou non,
émanant des établissements d’enseignement et de
recherche français ou étrangers, des laboratoires
publics ou privés.
Lightning in the eastern Alps 1993-1999, part I:
Thunderstorm tracks
I. Bertram, G. J. Mayr
To cite this version:
I. Bertram, G. J. Mayr. Lightning in the eastern Alps 1993-1999, part I: Thunderstorm tracks. Natural
Hazards and Earth System Science, Copernicus Publications on behalf of the European Geosciences
Union, 2004, 4 (4), pp.501-511. �hal-00299157�
Natural Hazards and Earth System Sciences (2004) 4: 501–511 SRef-ID: 1684-9981/nhess/2004-4-501
© European Geosciences Union 2004
Natural Hazards
and Earth
System Sciences
Lightning in the eastern Alps 1993–1999,
part I: Thunderstorm tracks
I. Bertram1and G. J. Mayr2
1Research Centre Karlsruhe, Hermann-von-Helmholtz-Platz 1, D-76344 Eggenstein, Germany
2Institut f¨ur Meteorologie und Geophysik, Innrain 52, A-6020 Innsbruck, Austria
Received: 22 March 2004 – Revised: 17 June 2004 – Accepted: 18 June 2004 – Published: 2 September 2004
Abstract. Thunderstorm tracks in the eastern Alps for the
summers of 1993–1999 are investigated based on lightning data. The tracking method consists of three steps. Step one filters weak storms. Step two fixes the positions of the sin-gle cells, which are then connected. The wind at 700 hPa, which approximates the steering level of the thunderstorms, is used to distinguish between six weather patterns. Maps including all discovered tracks are discussed for each flow type. While locations from which thunderstorms originate are almost similar, the track patterns are distinct for each flow type. Main initiation areas are mountain ranges of moderate altitude (≈2.5 km MSL) from where most of the tracks lead into flat areas.
1 Introduction
At any time there are about 2000 active storms world-wide (Dudhia, 1996). From parts of the tropics, where they may occur with a daily regularity to the midlatitudes, where they are normally a seasonal phenomenon, they have a great im-pact on our lives. Flash floods, hail, wind gusts and tornadoes are related to convection.
In the United States alone, 85 people are killed each year by lightning (Holle et al., 1999) – fewer than by floods
but more than by tornadoes or hurricanes. Fires ignited
by flashes may cause considerable material damage when houses burn down or disastrous forest fires occur. There are about 10 000 lightning-caused wildfires in the United States each year (Krider et al., 1980). They occur mainly in the western mountainous states, where almost 60% of fires on public land are ignited by flashes (Schmidt et al., 2002). The direct damage to buildings can often be prevented by a cor-rectly installed lightning protection system. Indirect dam-ages through power surges in radios, televisions, comput-Correspondence to: I. Bertram
ers and other electronic devices have usually costlier con-sequences.
It comes as no surprise that the first lightning-detection systems were installed in the United States during the seven-ties in order to locate forest fires after thunderstorms (Krider et al., 1980). Later other branches of industry realised the benefits of lightning-detection systems. In Europe, several systems were installed in the late eighties, for example the systems M´et´eorage in France, BLIDS (BLitz Informations Dienst von Siemens) in Germany and Switzerland, CESI-SIRF (Centro Elettrotecnico Sperimentale Italiano – Sistema Italiano Rilevamento Fulmini) in Italy and ALDIS (Austrian Lightning Detection & Information System) in Austria (Di-endorfer et al., 1992).
Lightning-detection systems have been used to show the impact of orography on thunderstorm initiation (Orville, 1991; Orville, 1994; Finke, 1995; Orville and Silver, 1997; Huffines and Orville, 1998) and to study the diurnal cycle of convection (Lopez and Holle, 1986; Finke and Hauf, 1996). A general result is that the lightning-density reaches max-imum values above mountainous terrain early in the after-noon and flat areas in the evening. Some authors found that thunderstorms initiated above mountain ranges subsequently move out into adjacent flat areas (Lopez and Holle, 1986; Bluestein, 1993; Finke and Hauf, 1996).
In this paper we show that those assumptions are true for the vicinity of the eastern Alps by using a climatology of thunderstorm tracks based on lightning data. Since lightning data show only the electrically active parts of thunderstorms, detection in general starts later in the life cycle of a convec-tive cell and covers a smaller area than observable by radar. Nevertheless, lightning data alone can be used to study the time and spatial distributions of thunderstorms (Lopez and Holle, 1986).
Section 2 will introduce the topography of the region un-der investigation, the lightning-detection network, and its data. Section 3 describes the weather pattern classification used to stratify the lightning events and discusses the differ-ence in lightning activity between the different flow patterns.
Figure 1:
Figure 2:
Vienna Munich
Stubaier A. Hohe Tauern
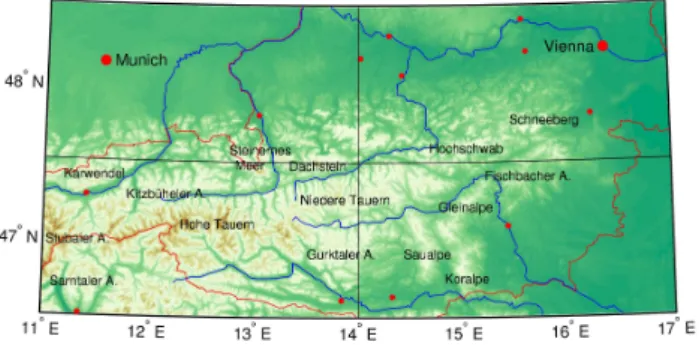
Niedere Tauern Hochschwab Schneeberg Fischbacher A. Koralpe Gleinalpe Saualpe Gurktaler A. Sarntaler A. Karwendel Kitzbüheler A. Steinernes Meer Dachstein Hohe Tauern Niedere Tauern Hochschwab Schneeberg Fischbacher A. Koralpe Gleinalpe Saualpe Gurktaler A. Sarntaler A. Karwendel Kitzbüheler A. Steinernes Meer Dachstein 11° E 12° E 13° E 14° E 15° E 16° E 17° E 47° N 48° N
Fig. 1. Location of the area of investigation in Europe.
Fig. 2. The area of investigation with topography and locations used in the following sections.
Section 4 explains the specially developed algorithm to track thunderstorms by their lightning activity. An overview of typical tracks for all six weather patterns follows in Sect. 5. The last section contains a summary and conclusions.
2 Lightning data in the eastern Alps
In this section the area of investigation will be described. Its choice will be substantiated referring to the quality of the lightning-detection data used.
2.1 Topography
The area of investigation extends from 46.5◦to 48.5◦N and
from 11◦to 17◦E. It includes a large part of Austria as well
as parts of Germany, Italy, Hungary and Slovenia (Fig. 1). It is situated in Central Europe at the border between Mediter-ranean and temperate climate. The region of study contains varied topography (Fig. 2). In its western part, mountains at the main Alpine crest are glaciated and reach up to 3500 m MSL. A part of the northern alpine foreland and more low level regions in the southeast are also included.
Figure 3:
Fig. 3. Detection efficiency (in percent) for cloud-to-ground and ground-to-cloud flashes of the Austrian lightning-detection net-work. The positions of the 8 IMPACT-sensors are indicated and the area of investigation is bounded by a grey box.
2.2 Lightning-detection network and data
The area of investigation was chosen to allow for a homoge-neous and consistent coverage by a lightning detection net-work. The data base of this survey are lightning-detection data of ALDIS which consists of 8 IMPACT-sensors (IM-Proved Accuracy from Combined Technology). The sensors measure the polarity of the electric field in order to deter-mine the polarity of the flash. Furthermore the wave angle of the magnetic field as well as the precise time of the signal arriving by the sensor are recorded (Diendorfer et al., 1998). ALDIS assigns all strokes of a cloud-to-ground flash to a single event. It deliberately excludes cloud-to-cloud flashes since they are irrelevant for the main purpose of the network: detection of strikes leading to damage and the evaluation of lightning risk. This is disadvantageous for meteorological sciences since the main share of all flashes are cloud-to-cloud flashes and the flash activity of a thunderstorm cell often starts with cloud-to-cloud flashes (Williams et al., 1989).
The average distance between the sensors is only about 160 km and allows an accuracy of lightning detection of bet-ter than 1 km on average (Diendorfer et al., 1992). The de-tection efficiency DE, the share of all flashes that is detected, is also relatively high and uniform over the main part of Aus-tria. Figure 3 shows an estimate of the detection efficiency af-ter Schulz (1997). It was calculated combining a theoretical model of the individual sensor’s DE with the measurements of the lightning detection network. At first the sensor’s DE is calculated for different peak currents and distances of flashes. The DE model accounts for e.g. the dependence of the sen-sor’s dead time and sensitivity, the angle of incidence, the wave-form discrimination and the attenuation of the electro-magnetic field during propagation. Using the sensor’s DE a theoretical peak current network DE can be calculated. It
I. Bertram and G. J. Mayr: Lightning in the eastern Alps 1993–1999, part I 503 refers to different classes of peak currents. To estimate the
total network DE a frequency distribution of peak currents is required. It is measured by the network itself and corrected to a “natural” lightning current distribution by the peak current network DE. The total network DE is the ratio of the number of detected flashes to the number contained in the “natural” distribution.
At the edges of the map the detection efficiency decreases as the distance to the nearest sensor increases. Thus, weak flashes are not recorded. Due to the shape of the political boundaries of Austria, the sensors in the western part are ap-proximately collinear, which limits the positioning accuracy. The area of investigation was chosen so that the detection ef-ficiency remained better than 80% even at the corners of the area to obtain a homogenous data set. The time period was limited to the summer months June, July and August of the years 1993–1999.
Until the year 2000 the diverse European lightning detec-tion networks used different techniques and evaluadetec-tion soft-ware. Thus, the data were badly comparable, a reason why the data set of this study was limited to one detection system. Otherwise additional use of Italian and German data would have been interesting.
Since 2000 the most important European lightning de-tection systems are combined to EUCLID (EUropean
Co-operation for LIghtning Detection). The data are
evalu-ated uniformly resulting in homogenous quality in terms of detection efficiency and location accuracy, so that interest-ing research possibilities arise for the future. In 2004 EU-CLID contained sensors in Switzerland, Germany, Austria, France, Belgium, Netherlands, Luxembourg, Czech Repub-lic, Slovakia, Slovenia, Italy, Hungary, Poland and Norway (http://www.euclid.org).
3 Weather pattern classification
In complex terrain, thunderstorms and lightning characteris-tics are expected to be a function of flow direction. Although exactly the same flow pattern does not occur twice, a weather pattern classification is sensible because the mass and wind fields exhibit similar structures time after time. Several clas-sifications tailored to the Alps exist: Lauscher’s (1972) is based on the surface pressure distribution, Sch¨uepp’s (1968) on the 500 hPa-level, and Steinacker’s (http://www.univie. ac.at/IMG-Wien/weatherregime) on the flow direction at the 850 hPa-level.
Hader (1956) evaluated observations of thunderstorms in Austria during the years 1947 and 1955 in order to check which synoptic structures favour the formation of widespread storms. Widespread thunderstorms (when at least half of all observers reported a storm) occurred most frequently on days when a low was situated above the central European conti-nent. The second most frequent scenario had the low cen-tred over the British Isles. Both weather patterns initiate se-vere storms along and ahead of cold fronts approaching from the west when moist warm air is advected from southerly or
Figure 4:
0°
180°
225°
247.5°
270°
east
north-west
south
west
s.-w.
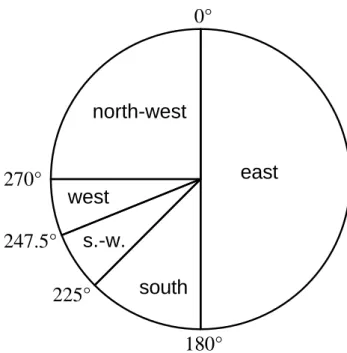
Fig. 4. Designations of the flow types and direction of wind used to delimit the five flow types. Days of weak flow (wind speed less than 15 Kn) constitute the sixth flow type, called “weak wind”.
south-westerly directions ahead of the front. As frequent but on average even more extended are widespread storms if a trough above the Alps is bounded by high pressure systems to the west and east. With this pattern cool northerly winds on the westside and hot southerly winds east of the low create large temperature gradients.
Wakonigg (1978) examined the connection between weather pattern (after Lauscher) and thunderstorm activity in the south-eastern state of Styria (Austria). He found that the trough above the Alps (in German: “meridionale Tiefdruck-rinne”) spawns the most thunderstorms. Also important, as discussed for the whole of Austria before, are the low above the British Isles and the low above Central Europe. Only a few storms occur on days with advection of cold air or days under the influence of high-pressure systems.
Similar results were also reached by Fliri (1975) for the western Austrian state of Tirol.
3.1 A flow type classification for the track-analysis
For our purpose, we need a classification scheme that can distinguish between situations leading to different kinds of storm movement. Therefore Steinacker’s classification, which is based on flow direction, seems suitable. However, the steering level of thunderstorms is not at the 850 hPa-level but closer to the 700 hPa-level (Hagen et al., 1998).
A new classification scheme patterned after Steinacker’s was thus tailored for the purpose of studying thunderstorm tracks. It examines the wind direction and speed at the thun-derstorm steering level of 700 hPa (Fig. 4) and consists of five flow types from different sectors plus one weak wind type of speeds not higher than 15 kn. This threshold of 15 kn, which
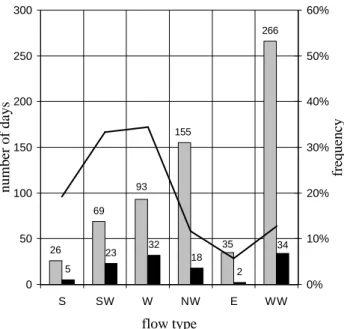
Figure 5: 93 266 155 69 26 35 5 23 32 18 2 34 0 50 100 150 200 250 300 S SW W NW E WW flow type number of days 0% 10% 20% 30% 40% 50% 60% frequency
Fig. 5. Number of days with the different flow types during June to August in the years 1993–1999 (grey bars); number of days with 3000 or more flashes (black bars) and relative frequency of the lat-ter with respect to the former (black line and right ordinate). WW stands for the flow type “weak wind”.
is used in Steinacker’s classification, successfully delineated conditions with little storm movement.
The reason for the uneven division of the wind directions is the non-uniform frequency of the different directions of thun-derstorm movement. Storms moving from east to west oc-curred so rarely that a more detailed division was not worth-while. Most storms approached from south-westerly direc-tions. Thus this sector was more finely divided.
The basis for the classification were weather charts at 00:00 UTC and 12:00 UTC from the “Europ¨aischer Wetter-bericht” published by Deutscher Wetterdienst DWD.
Many thunderstorms occurred along fronts where the wind direction at the 700 hPa-level turned in the course of the day clockwise from southwest to northwest. These cases were classified with respect to the wind direction downstream of the accompanying trough, because most storms can be ex-pected in the area of upward motion downstream of the trough.
3.2 Frequency distribution of the flow types and the flashes
A “day” in this paper is defined to start at 04:00 UTC, which is close to sunrise. The minimum of thunderstorm activity in the region of study occurred around 04:00 UTC during the summer months of 1993–1999. Even long-lasting storms had mostly died by that time and no new storms had formed yet. The most common flow type during June through August 1993–1999 (total of 644 days) was “weak wind” on 266 days (Fig. 5). The frontal zone is often situated north of the area of investigation in the Central European summer. Another
Table 1. Mean daily flash rate for the different flow types during June through August 1993–1999. “All” contains the mean flash rate regardless of flow type.
All S SW W NW E WW
1548 1573 3102 2798 874 625 1220
frequent flow type was “northwest” while “south” and “east” occurred most rarely.
Only days with 3000 and more flashes in the area of in-vestigation will be used in the following track-analysis. The types “weak wind” and “west” produced most of these days, followed by the “southwest” and “northwest” flow patterns.
Although the type “weak wind” created most days with 3000 or more flashes, the relative frequency is only 13%. The types “west” and “southwest” had the highest relative fre-quency: nearly 35% of such lightning-intense days. These flow types also stand out with the largest mean daily flash rates: about 3000 flashes (Table 1). The mean of all 644 summer-days is 1548 flashes per day. Little lightning hap-pened for types “weak wind”, “northwest”, and especially “east”.
Figure 6 shows that most days (430 days) had no more than 1000 flashes. The next class already contains much fewer days. The classes below 3000 flashes per day con-tain together 82% (= 530 days) of all days but only 25% of all flashes. In the track-analysis only the remaining 114 days with 75% of all flashes are considered.
4 Tracking thunderstorms
When one depicts all flashes of a day on a map, thunderstorm tracks become apparent. Apart from the larger-scale flow di-rection the observed tracks depend on the mesoscale organ-isation of the storms. Three basic types of thunderstorms can be identified (Foote, 1985; Dudhia, 1997). Short living single cells are common in an environment of weak (or non-existent) vertical windshear. The complete cycle of precipi-tation development and fall out takes place in one cell. The cell moves with the wind at the steering level creating none or only very short tracks due to their short lifetime of up to an hour.
The second type, the multicell storm, forms under condi-tions of moderate vertical wind shear. New cell growth can be initiated at the cold outflow boundary of a decaying cell (Bluestein, 1993). The direction of a multicell storm track is determined by the movement of the single cells with the wind (at the steering level) and by the propagation of daugh-ter cells. Both effects describe the motion of the system (Ha-gen et al., 1998). The direction of propagation depends ba-sically on the shape of the hodograph. In an environment of clockwise curved hodographs, new cells develop preferen-tially on the right flank of the old storm. In an environment
I. Bertram and G. J. Mayr: Lightning in the eastern Alps 1993–1999, part I 505 of counterclockwise curved hodographs the cells develop on
the left flank. Long tracks are possible as multicell systems can last for several hours.
The third type of thunderstorms, the supercell, occurs un-der conditions of strong vertical wind shear and very unstable stratification. The storm is formed by a large quasi-stationary cell, which persists for much longer than the time required for air to circulate through (Bluestein, 1993). It keeps alive by continuous cell growth, mostly at the right flank. While at least the single cells of a multicell system move with the wind, the supercell exhibits a motion deviant of the wind. Supercells often develop from multicells or single cells. As a result, they move with the wind of the steering level early in their life, to the right (or left) during their supercell phase, and with the wind when they decay. Houze et al. (1994) ex-amined 42 severe hailstorms in Switzerland. The departure between the midlevel winds and the motion of these storms
was roughly 20◦to 30◦. Storms and storm systems that travel
to the right of the mean winds are called “rightmovers” and storms that travel to the left are called “leftmovers”. Long tracks are likely as supercells can exist for 12 h.
Thunderstorm tracks are a result of the described effects. Therefore the wind at the steering level gives the most likely motion vector of a storm (Hagen et al., 1998).
4.1 Tracking algorithm
While tracks are relatively obvious to the human eye, an au-tomatic objective tracking algorithm is harder to construct.
One method of automatic tracking is described by Steinacker et al. (2000). Their algorithm consists of three major steps: At first lightning density data are smoothed with a Gaussian filter. Then isolated maxima of lightning activity are identified for 20-min time periods. The last step finds the most likely displacement vectors between the time intervals. The algorithm described here also consists of three major steps but differs in detail, most significantly in the compu-tation of the displacement vectors. First the raw lightning data are filtered instead of the Gaussian smoothing of light-ning density in the Steinacker’s algorithm. Secondly isolated maxima of lightning density are identified. Then several cri-teria are employed to find the most likely displacement vec-tors.
4.1.1 Step one: Filtering of the data
The goal of this procedure is to eliminate all weak storms and all flashes that appeared isolated. Only flashes are con-sidered for the further steps that have at least 14 other flashes in close spatial (4 km) and temporal (20 min) vicinity. All other flashes are removed from the raw data. 14 was chosen as an appropriate minimum number of “neighbours” from an examination of the 7 years worth of data. This means that there must have been at least 15 flashes over a circular area with a diameter of 8 km during 20 min for the storm to be further considered by the tracking algorithm.
Figure 6: 3 8 10 6 6 4 2 1 2 3 15 21 430 0 50 100 150 200 250 300 350 400 450 500 0 - 1 1 - 2 2 - 3 3 - 4 4 - 5 5 - 6 6 - 7 7 - 8 8 - 9 9 - 10 10 - 11 11 - 12 12 - 13 13 - 14 14 - 15 15 - 16 16 - 17 17 - 18 18 - 19
class of daily flash-rate (103)
number of days 0% 10% 20% 30% 40% 50% 60% 70% 80% 90% 100%
number of flashes (cumulative)
25% Figure 7: Hohenpeißenberg
.
..
.
..
.
.
.
.
.
.
.
.
.
.
.
.
.
..
.
.
1-2 UTC2-3 UTC 3-4 UTC 22-23 UTC 23-24 UTC 0-1 UTC 19-20 UTC 20-21 UTC 21-22 UTC 16-17 UTC 17-18 UTC 18-19 UTC 13-14 UTC 14-15 UTC 15-16 UTC 10-11 UTC 11-12 UTC 12-13 UTC.
7-8 UTC 8-9 UTC 9-10 UTC 4-5 UTC 5-6 UTC 6-7 UTC Neustadt Krems St.Pölten Steyr Linz Wels Salzburg Graz Klagenfurt Villach Bozen Innsbruck Vienna MunichFig. 6. Number of days in different classes of daily flash rate during the whole time series. Days with fewer than 3000 flashes (grey bars) and days with 3000 or more flashes (black bars). Relative number of flashes that occurred on all days of the corresponding class, adding the lower classes (line graph and right ordinate). The value of the three first classes is marked by a black cross.
4.1.2 Step two: Identification of storm centres
Based on the filtered data the algorithm looks for local max-ima. The day is divided into 72 time intervals of 20 min each to temporally average the data. During that time storms move only over very short distances. The computation of the posi-tion of storm centres continues with a search for local max-ima. The area of investigation is divided into 90×44 boxes of about 5 km length. The number of flashes during the con-sidered time interval is counted in each box. Each box is then compared with the 8 adjacent ones to find local max-ima. If one of the eight neighbours should contain as many flashes, the central box is chosen anyway. Now all boxes that represent local maxima are known. The coordinates of their centres are used as provisional local maxima.
As a last refinement the position of the storm centres are computed as the spatio-temporal mean of all lightning strikes that occurred within 1.5 grid distances from the centres of the provisional maximum boxes over the 20 min.
The described computation of local maxima is conducted for all 72 20-min time intervals.
4.1.3 Step three: Connecting storm centres between
subse-quent times
This last step consists in connecting the local maxima (storm centres) to thunderstorm tracks in a sensible way. But what is sensible?
The case of only one moving storm is simple: all isolated maxima can be connected by noting their temporal sequence.
However, if there are several cells moving in close proximity, the number of possible connections increases and with it the difficulty in choosing the correct one.
Steinacker et al. (2000) demand in their tracking algorithm that the displacement vectors do not differ from the wind velocity and direction at the 600 hPa-level (which they chose as the steering level) by more than a certain amount. They derived the 600 hPa wind from radio soundings. With only 4 radiosonde stations in the area of investigation, of which 2 launch only one sonde per day and the other two twice daily, the environmental conditions at the location and time of convection are not always represented. Our algorithm finds the displacement from the lightning data itself in two steps: First by computing a temporally averaged overall regional displacement, then using the regional displace-ment as a guide to find the displacedisplace-ment of individual storms. Determination of regional displacement vectors
For many storm episodes the displacement vectors of the storms in a particular region and during one single
convective event are similar (Finke, 1999). Hence, it is
sensible to compute regionally- and temporally-averaged displacement vectors for each single case. The regions for averaging were determined from inspection of the data. It showed that the displacement often differs between the regions north and south of the Alpine crest, just as it often differs between the western part of the examination area and the eastern part. Therefore the whole area was divided into 4
regions on both sides of the 47.5◦N latitudinal and the 14◦E
longitudinal lines.
The first step of finding the averaged displacement vectors is to identify the dominant displacement for each of the four regions between all consecutive 20-min time intervals. Each lightning centre is connected to the closest one in the next time interval. Distance and direction of that connection are binned into 3 km distance intervals (to a maximum of 27 km)
and 30◦direction intervals. The regional displacement vector
is formed by choosing the most frequent distance bin and the most frequent direction bin.
Theoretically our temporal averaging uses the data of a whole day, a time period where a significant change of the wind direction is possible. Since the storm activity in a lim-ited area lasts commonly only a few hours, the averaging pe-riod is in practice much shorter and the resulting averaged displacement is suitable as first guess for most cells.
The computation of the tracks contains the possibility of operator intervention by presetting the displacement vectors, which makes the presented tracking algorithm a semi-automatic method. In a few cases the results of the algorithm could be improved by changing the distances of the regional displacement vectors.
Constructing individual tracks
Once the regional displacement vectors are known (valid for the convective event under consideration), displacement
vectors for individual storm centres are computed. Direction and distance of all possible connections between storm centres of successive time intervals are calculated. Then the deviation from the regional displacement vector is computed using the following weighted linear combination of directional and distance differences:
D = 1
1◦(|d − d|) +
1
4 km(|s − s|), (1)
where d: direction of dominant regional displacement vec-tor, d: direction of the connection considered, s: distance of dominant regional displacement vector, and s: distance of the connection considered.
The weighting was chosen so that a directional difference
of 20◦between storm centre displacement vector and the
re-gional displacement vector produces the same deviation D as a 5 km distance difference. The connection with the small-est deviation D is assigned to the displacement vector of the storm centre provided it fulfils two more constraints: The
di-rection differs at the most by 30◦from the regional
displace-ment vector and the distance is not more than twice distance of the regional displacement vector. These thresholds were determined subjectively from the data.
Cases with small regional displacement distances (shorter than 3 km) were treated differently: the directional require-ment was dropped and the distance of the storm centre con-nection constrained to be shorter than 5 km.
This process is repeated for the remaining combination of connections between subsequent storm centres until no con-nection fulfils the thresholds any more. The tracks of storm centres that do not have a valid connection to a subsequent centre are closed.
Finally all tracks are depicted on a map. A track is referred to as a “hot spot”, if the average displacement between all consecutive 20 min intervals when the cell was observed is less than 3 km. Hot spots are marked by a dot on the fol-lowing figures. Their coordinates are the spatial average of all contained maxima. Since at least two maxima are neces-sary to show a track, hot spots are marked as well only if two or more maxima are included. Thus, a hot spot is a hardly-moving storm lasting in all likelihood longer than 20 min.
Depending on the thunderstorm type the tracks identified by our algorithm have different meanings: It is straightfor-ward for the tracks for a single cell or a supercell as they describe the motion of only one cell. On the other hand, the propagation of multicells may be discrete or continu-ous. Bluestein (1993) distinguishes that as follows: If the time interval between the appearance of successive cells is at least 20 min then the propagation is discrete, otherwise con-tinuous. Since the time interval of our tracking algorithm is 20 min the identified track of a continuously propagating multicell storm is that of the whole storm system. Supercells can be tracked only if the regional displacement vector
devi-ates less than 30◦from its direction of motion. Note though,
that the wind direction may differ by larger amounts from the motion of the cell since the regional displacement does not necessarily need to coincide with the local wind direction.
I. Bertram and G. J. Mayr: Lightning in the eastern Alps 1993–1999, part I 507 The following situation is conceivable: A supercell moves
in a direction differing by more than 30◦from the regional
displacement vector (determined by the movement of many single cells). In this case the operator can intervene and set the regional displacement to a value between the two
mov-ing directions. Differences of movmov-ing directions up to 60◦
are allowed in each of the 4 parts of the area of investigation. If a storm splits, the algorithm starts a new track close to the originating storm. In the case of storm merging one of the tracks ends.
Note that the use of a variable box size in finding the storm centres (Sect. 4.1.2) could improve the tracking results in some cases. Adapting the boxes to each single case depend-ing on the scale of the systems’ size a mesoscale convective complex could be accounted by only one track as well as a single cell. But in this study it was intended to treat each storm event identically: each of the cells within a mesoscale convective complex should be tracked.
4.2 Example: 27 July 1998
A day of severe thunderstorm activity in the eastern Alps will showcase the workings of the tracking algorithm (Fig. 7). On 27 July 1998 a depression moved eastward over Ger-many. Its cold front passed the Alps in the course of that day. West-south-westerly flow downstream of the accompa-nying trough steered numerous frontal thunderstorms to the east-north-east.
The available soundings in the area of investigation (Mu-nich, 00:00 UTC, Hohenpeißenberg, 06:00 UTC, Innsbruck, 00:00 UTC, Linz, 06:00 UTC, Vienna, 00:00 UTC, Graz, 06:00 UTC) indicated a conditionally unstable stratification (temperature lapse rate between the dry and moist-adiabatic lapse rate). Furthermore, the stratification was everywhere more or less potentially unstable (layers with a decrease of pseudopotential temperature with the height) as indicated by negative values of the KO-index (not shown). The KO-index is the difference of the average midtropospheric (500 and 700 levels) from lower tropospheric (850 and 1000 hPa-levels) pseudopotential temperature. Therefore negative val-ues indicate potential instability, which can be released, e.g.
by synoptic lifting. The largest potential instability was
found in the sounding of Graz, where the pseudopotential
temperature decreased from 62◦C near the surface to 43◦C at
about 4 km MSL.
In all soundings, air parcels above the nocturnal stable boundary had convective available potential energy (CAPE). The largest values were reached at Linz (913 J/kg).
Hence, the required instability for thunderstorm develop-ment was given in the whole area of investigation.
Nevertheless, the thunderstorm activity remained low in the north-western part of Austria, where the early arrival of the cold front prevented that the triggering temperature for deep convection was reached. The temperature maxima of Munich, Hohenpeißenberg and Innsbruck, where the front passed before 11:00 UTC, remained about 5 K below this convective temperature. The front did not reach the eastern
Figure 6: 3 8 10 6 6 4 2 1 2 3 15 21 430 0 50 100 150 200 250 300 350 400 450 500 0 - 1 1 - 2 2 - 3 3 - 4 4 - 5 5 - 6 6 - 7 7 - 8 8 - 9 9 - 10 10 - 11 11 - 12 12 - 13 13 - 14 14 - 15 15 - 16 16 - 17 17 - 18 18 - 19
class of daily flash-rate (103)
number of days 0% 10% 20% 30% 40% 50% 60% 70% 80% 90% 100%
number of flashes (cumulative)
25% Figure 7: Hohenpeißenberg
.
..
.
..
.
.
.
.
.
.
.
.
.
.
.
.
.
..
.
.
1-2 UTC2-3 UTC 3-4 UTC 22-23 UTC 23-24 UTC 0-1 UTC 19-20 UTC 20-21 UTC 21-22 UTC 16-17 UTC 17-18 UTC 18-19 UTC 13-14 UTC 14-15 UTC 15-16 UTC 10-11 UTC 11-12 UTC 12-13 UTC.
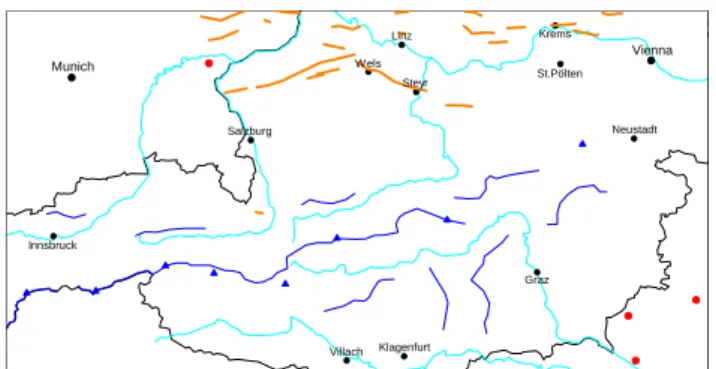
7-8 UTC 8-9 UTC 9-10 UTC 4-5 UTC 5-6 UTC 6-7 UTC Neustadt Krems St.Pölten Steyr Linz Wels Salzburg Graz Klagenfurt Villach Bozen Innsbruck Vienna MunichFig. 7. Example of tracking. Lightning positions (small color-shaded dots), tracks (grey lines) and hot spots (large grey dots) for 27 July 1998. The direction of the dominant displacement (towards
which the storms travel) vector was 75◦in the whole area. Its
dis-tance was 7.5 km in the western part and 13.5 km in the eastern part. Rivers are presented by thin blue lines and major orographic features by thick blue lines.
part of the map before 15:00 UTC so that the convective tem-perature was exceeded e.g. by 1 K in Vienna and by 2 K in Graz.
Most likely the soundings were not representative for the atmospheric profiles at the time of the thunderstorm tion. Presumably CAPE at the time of thunderstorm initia-tion exceeded the values calculated from the previous radio soundings. Especially the sounding of Vienna had indicated strong advection of warm air below 3 km and simultaneous cooling above at 00:00 UTC. Lifting downstream from the trough activated the potentially unstable stratification and se-vere storms with many strikes occurred in the eastern parts of Austria during the evening hours.
45 tracks and 2 hot spots were discovered mostly in the eastern part of the map (Fig. 7), while the weak storms in the west were filtered by the tracking algorithm.
5 Weather pattern dependence of thunderstorm tracks
The tracking method was used for all days with 3000 or more flashes in the area of investigation. This condition was ful-filled on 114 days (25%) of the summer months of 1993– 1999. For most some tracks or hot spots were found. In a few cases the lightning distribution was so chaotic, that nei-ther the algorithm nor the human eye could find tracks.
Subsequently maps including all discovered tracks will be discussed, one for each of the 6 different flow types. The lo-cation of the origin areas for the tracks will be named. It must be kept in mind that not the thunderstorm itself but its cloud-to-ground and ground-to-cloud lightning activity is tracked. There is a time shift between initiation of a storm and the first detectable flashes. As a result the storm initiation areas are situated upstream from the starting points of the tracks. This effect is increased as first flashes in the life cycle of a storm are mostly cloud-to-cloud flashes. Furthermore some
508 I. Bertram and G. J. Mayr: Lightning in the eastern Alps 1993–1999, part I Figure 8: Neustadt Krems St.Pölten Steyr Linz Wels Salzburg Graz Klagenfurt Villach Innsbruck Vienna Munich Figure 9: Hochs chwab Danube Dachstein Innvierte l Niedere T auern Steine rnes Meer Karwend el Neustadt Krems St.Pölten Steyr Linz Wels Salzburg Graz Klagenfurt Villach Innsbruck Vienna Munich Figure 10: Salzach Gle inal pe K o ra lp e Gurkta ler A. Kaisergeb. Mangfallgeb. Dachstein Niedere T auern Hochs chwab Neustadt Krems St.Pölten Steyr Linz Wels Salzburg Graz Klagenfurt Villach Innsbruck Vienna Munich
Fig. 8. Tracks (orange lines) and hot spots (large red dots) of the flow type “south” during the summer months 1993–1999. The wind
direction at the 700 hPa-level is between 180◦ and 225◦. Rivers
are represented by thin blue lines and major orographic features by thick blue lines. Dominating tracks are marked by black arrows.
lightning intense storms evolved from weak lightning storms which were filtered by the data evaluation. The latter effect was accounted for by drawing the conclusions only after a detailed inspection of all individual cases. Often storms oc-curred within large systems. Then the mentioned origins re-fer to the single cells and not to the whole systems, which might have been advected from outside the study area, e.g. from France.
5.1 Tracks of the flow type “south”
Figure 8 contains the results of the 5 severe lightning days (=0.8% of the 644 days in June to August 1993–1999) with
700 hPa winds between 180◦and 225◦(cf. Fig. 5). The tracks
are all relatively short but within the 700 hPa wind direction sector, which confirms that this level is indeed the steering level for the thunderstorms. The large number of tracks in Salzburg forms a thunderstorm “alley” marked by the black arrow.
Most tracks start downstream of the Alpine crest and other high mountain ranges. There are basically no tracks on the upstream side. Flow type “south” means flow perpendicular to the mainly West-East oriented Alpine crest that often leads to foehn gravity waves in the lee. Peristeri et al. (1999) used two numerical models to investigate the thunderstorm initi-ation in the northern alpine foreland. They used basic flows from the south and the southwest. Immediately to the lee of obstacles the thickness of isentropic layers decreased as the flow descended in the downward part of the gravity waves. Lower thickness means higher static stability and lower like-lihood for thunderstorm initiation. Further downstream at the upward-part of the gravity wave the distance between isen-tropes widens, which reduces static stability.
The lightning data confirm these numerical model
find-ings. All thunderstorm tracks near Salzburg start further
downstream from the highest mountains. Manual inspec-tion of individual cases showed not even weak storms (which were filtered by the data processing) at the large mountain ranges. Foehn obstructs the thunderstorm genesis
imme-Neustadt Krems St.Pölten Steyr Linz Wels Salzburg Graz Klagenfurt Villach Innsbruck Vienna Munich Figure 9: Hochs chwab Danube Dachstein Innviertel Niedere T auern Steine rnes Meer Karwend el Neustadt Krems St.Pölten Steyr Linz Wels Salzburg Graz Klagenfurt Villach Innsbruck Vienna Munich Figure 10: Salzach Gle inal pe K o ra lp e Gurkta ler A. Kaisergeb. Mangfallgeb. Dachstein Nieder e Tauern Hochs chwab Neustadt Krems St.Pölten Steyr Linz Wels Salzburg Graz Klagenfurt Villach Innsbruck Vienna Munich
Fig. 9. As Fig. 8 but for flow type “south west” with wind directions
at the 700 hPa-level between 225◦and 247.5◦.
diately downstream of the Alpine crest but fosters it fur-ther downstream, especially where the norfur-thern ranges of the Alps provide additional low-level orographically induced lifting.
5.2 Tracks of the flow type “southwest”
The flow type “southwest” (225◦–247.5◦) spawned more
than 3000 flashes on 23 days (=4%) in the summers 1993– 1999 (Fig. 9). Advection of subtropical or Mediterranean warm and moist air creates favourable conditions of thunder-storm evolution. Important are frontal thunderthunder-storms down-stream from short-wave troughs that approach from the west.
The arrangement of the tracks is not random. Preferred
source regions and tracks exist. Above the higher elevations of the Alps there are only short tracks. They are presumably often disrupted by lee effects downstream of high mountain ranges. Some tracks lead in west-easterly direction differ-ing from the wind in the 700 hPa-level. Possibly they are influenced by the orientation of orographic features. Over the plains, long living storms are moving to the northeast. In the lowlands, a higher mesoscale organisation marked by daughtercell growth may develop unhindered since the ad-vection of moist warm air in the lowest atmospheric layers is not blocked by mountain ranges. At least some of these storms evolve above the mountains.
Important origin areas of tracks are Karwendelgebirge, Steinernes Meer southwest of Salzburg, Niedere Tauern, and Hochschwab. Therefore preferred tracks (marked by black arrows) lead along Salzburg to Wels and after a short inter-ruption further to Krems. Others originate above the Niedere Tauern and move past Wiener Neustadt to the Danube. The Dachstein, a prominently protruding region, is no source area. That is why there is an alley devoid of tracks between Dachstein and St. P¨olten. A similar track-free alley is in the Innviertel.
5.3 Tracks of the flow type “west”
Figure 10 contains the results of the track analysis for 32 days (=5%) with more than 3000 flashes and a wind
I. Bertram and G. J. Mayr: Lightning in the eastern Alps 1993–1999, part I 509 Figure 8: Neustadt Krems St.Pölten Steyr Linz Wels Salzburg Graz Klagenfurt Villach Innsbruck Vienna Munich Figure 9: Hochs chwab Danube Dachstein Innvierte l Niedere T auern Steine rnes Meer Karwend el Neustadt Krems St.Pölten Steyr Linz Wels Salzburg Graz Klagenfurt Villach Innsbruck Vienna Munich Figure 10: Salzach Gle inal pe K o ra lp e Gurkta ler A. Kaisergeb. Mangfallgeb. Dachstein Niedere T auern Hochs chwab Neustadt Krems St.Pölten Steyr Linz Wels Salzburg Graz Klagenfurt Villach Innsbruck Vienna Munich
Fig. 10. As Fig. 8 but for flow type “west” with wind directions at
the 700 hPa-level between 247.5◦and 270◦.
this weather pattern occurred downstream from short-wave troughs - similar to the flow type “southwest”. Some ori-gin areas are also similar to those of the flow type “south-west”. Worth mentioning are the northern Kalkalpen, espe-cially the Mangfallgebirge and Kaisergebirge where many storms started or where lightning intensified. Some tracks lead along the Salzach, possibly influenced by the orienta-tion of the valley. Important source regions in the east are Niedere Tauern and Hochschwab as for flow type “south-west”. Again, no tracks originated from the Dachstein.
The decisive difference between this flow type and the type “southwest” is that nearly no tracks lead into the northern alpine foreland. Instead many tracks extend along the north-ern mountain ranges. A radar study by Hagen et al. (2000) also found many storms travelling along the northern edge of the Alps.
Another obvious difference to the flow type “southwest” is the multitude of tracks in the basin of Graz. They originate above the Gurktaler Alpen, Koralpe, and Gleinalpe. Some of these tracks moved to the right of the wind at the 700 hPh-level. In the vicinity of Graz and to its east, a few tracks are visible that lead in south-easterly directions. These are prob-ably the tracks of supercells or multicells with continuous propagation. Furthermore, the inspection of all individual cases belonging to the flow type “west” showed that mul-ticells with distinct propagation occur often in the basin of Graz. Their single tracks depicted in Fig. 10 lead eastward. Nevertheless, the thunderstorm activity often propagates to the southeast, also on those days.
The orographical conditions in the southeast of Austria promote the propagation type of rightmovers. As there are no mountain obstacles to the south, southerly winds can ad-vect moist Mediterranean air in the lowest atmospheric lay-ers. If the wind above blows from the west at the same time, a hodograph is curved in a clockwise manner. Then storms with higher mesoscale organisation would be expected to be rightmovers (cf. Sect. 4).
5.4 Tracks of the flow type “northwest”
The weather of this flow type is influenced by cooler air from the Atlantic. Thus the thunderstorm activity is fairly low.
Figure 11: Schneeberg Gurkta ler A. Gle inal pe Niedere T auern Neustadt Krems St.Pölten Steyr Linz Wels Salzburg Graz Klagenfurt Villach Innsbruck Vienna Munich Figure 12: Neustadt Krems St.Pölten Steyr Linz Wels Salzburg Graz Klagenfurt Villach Innsbruck Vienna Munich Figure 13: Dachstein Kitzbüheler A. Sarntaler Alpen S a u a lp e Hochs chwab Gle inal pe Gurkta ler A. Neustadt Krems St.Pölten Steyr Linz Wels Salzburg Graz Klagenfurt Villach Innsbruck Vienna Munich
Fig. 11. As Fig. 8 but for flow type “north west” with wind
direc-tions at the 700 hPa-level between 270◦and 360◦.
Figure 11: Schneeberg Gurkta ler A. Gle inal pe Niedere T auern Neustadt Krems St.Pölten Steyr Linz Wels Salzburg Graz Klagenfurt Villach Innsbruck Vienna Munich Figure 12: Neustadt Krems St.Pölten Steyr Linz Wels Salzburg Graz Klagenfurt Villach Innsbruck Vienna Munich Figure 13: Dachstein Kitzbüheler A. Sarntaler Alpen S a u a lp e Hochs chwab Gle inal pe Gurkta ler A. Neustadt Krems St.Pölten Steyr Linz Wels Salzburg Graz Klagenfurt Villach Innsbruck Vienna Munich
Fig. 12. As Fig. 8 but for flow type “east” with wind directions at
the 700 hPa-level between 0◦and 180◦.
Since this flow type is very frequent (24% of the summers 1993–1999) several tracks could be found (Fig. 11). They are the result of 18 days (=3%) with more than 3000 flashes. North of the Alps only few storms occur during north-westerly flows, often too weak to be tracked by the algo-rithm. Some of them strengthen as they reach the mountains. A few tracks start at the northern edge of the Alps north of Schneeberg. The main thunderstorm activity, however, is lo-cated south of the Alpine crest. The lower parts of cold fronts approaching from the northwest are blocked by the moun-tain ranges while cold air above the mounmoun-tain moves on and overruns the low-level warm air to the south of the crest in Carinthia and Styria (the areas around Villach, Klagenfurt and Graz). The static stability decreases and the storm prob-ability increases.
A second mechanism may promote the storm genesis in southern Austria during this flow type: North-westerly flow often leads to foehn and a comparable dynamics to the one described for the flow type “south” in Sect. 5.1. The isen-tropic layer thickness is reduced in the area of Alpine crest and increased further downstream. Immediately to the lee of the largest mountain range (Niedere Tauern) only a few tracks appeared. Many tracks originate further downstream, corresponding to the beginning of lightning activity. The dominating tracks start above the Gleinalpe and north of the Gurktaler Alpen and lead in south-easterly directions.
510 I. Bertram and G. J. Mayr: Lightning in the eastern Alps 1993–1999, part I Schneeberg Gurkta ler A. Gle inal pe Niedere T auern Neustadt Krems St.Pölten Steyr Linz Wels Salzburg Graz Klagenfurt Villach Innsbruck Vienna Munich Figure 12: Neustadt Krems St.Pölten Steyr Linz Wels Salzburg Graz Klagenfurt Villach Innsbruck Vienna Munich Figure 13: Dachstein Kitzbüheler A. Sarntaler Alpen S a u a lp e Hochs chwab Gle inal pe Gurkta ler A. Neustadt Krems St.Pölten Steyr Linz Wels Salzburg Graz Klagenfurt Villach Innsbruck Vienna Munich
Fig. 13. As Fig. 8 but for flow type “weak wind” with wind speed at the 700 hPa-level less than 15 Kn.
5.5 Tracks of the flow type “east”
Despite using an 180◦wind direction sector for this flow type
(0–180◦), only two days spawned enough flashes to be
in-cluded in the track analysis (Fig. 12). This is not enough to permit broader conclusions. Lightning data of a considerably longer period would be needed.
Tracks occurred exclusively in the north-eastern forelands.
5.6 Tracks of the flow type “weak wind”
Figure 13 contains 34 (=5%) strong lightning days with wind speeds below 15 kn at 700 hPa. In such conditions storms
hardly move from their area of origin. The cell
move-ment with the wind is short and propagation due to higher mesoscale organisation is unlikely due to a lack of vertical wind shear. Accordingly, the track analysis identified many hot spots. They indicate the impact of orography on storm genesis. High incidence of storms in the centre of the area of investigation and south of it suggests that orography is favourable for storm development. Many hot spots are at source regions of tracks of other flow types, which supports the statement that storms develop in mountains and move away from them if the flow at the steering level is strong enough. Worth mentioning are again the mountain ranges of moderate altitude like the Sarntaler Alpen, Kitzb¨uhler Alpen, Gurktaler Alpen, Saualpe, Gleinalpe and Hochschwab. The Dachstein region poses an exception: it often is a hot spot on “weak wind” days, but no origin for tracks on the other weather patterns.
5.7 Overall view of the tracks
The results of the track analysis can be summarised as fol-lows: A source region of storms are the northern Kalkalpen south of Salzburg (Fig. 14). For the flow type “weak wind”, this is a region of high lightning densities. For the types “south”, “southwest”, and “west” the dominating tracks lead-ing past Salzburg start there. Further source regions are the mountain ranges approximately at the centre of the eastern part of the map. The corresponding tracks lead to the west and southwest. The mountains of southern Austria (west of Graz) have high flash rates during weak wind conditions as
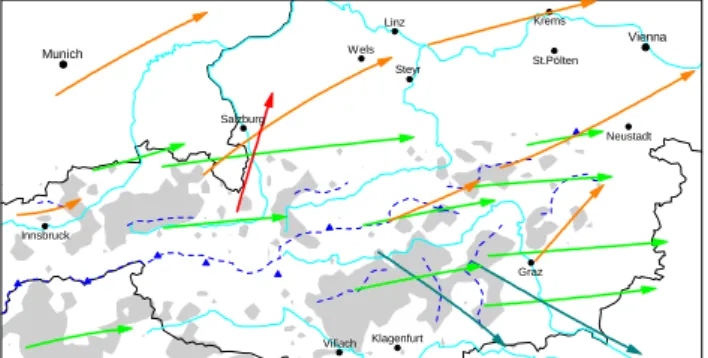
Figure 14: Vienna Neustadt St.Pölten Krems Steyr Linz Wels Salzburg Munich Innsbruck Graz Klagenfurt Villach
Fig. 14. Dominating tracks of the different flow types, which had been marked by black arrows in Figs. 8 to 13. Those of the flow type “south” (red arrow), the flow type “south west” (orange arrows), the flow type “west” (green arrows) and the flow type “north west” (blue arrows). The flow type “weak wind” was incorporated by
marking areas in grey with more than 2 flashes/km2in 92 days (all
flashes of the summer months June, July and August detected in the years 1993–1999 divided with 7).
well and many tracks start there during stronger flows. Many storms in the basin of Graz are advected from these moun-tains. Remember that the storm origin areas may be situated somewhat upstream of the indicated tracks.
The most important source regions of thunderstorms are, independent of the weather conditions, mountain ranges of moderate altitude (≈2.5 km MSL). Depending on the wind direction at the 700 hPa level the storms travel in different directions. The direction of storm movement is additionally influenced by the mesoscale organisation of the storms as su-percells travel deviating from the wind. Using lightning data alone supercell tracks cannot be identified unambiguously.
6 Summary and conclusions
With the development of appropriate detection systems light-ning data have become a useful additional source of informa-tion for thunderstorm research. These data offer the possibil-ity to track storms – at least their electrically active parts. In this paper lightning data were used in conjunction with a new weather pattern classification and a new tracking algorithm. The latter consists of three major steps. Step one filters the data in a way that only lightning intense storms are tracked. Step two fixes the positions of the single cells, which are then connected. The track calculation is carried out for all days with 3000 or more flashes in the area of investigation dur-ing June–August 1993–1999. All days included in the track analysis are assigned to one of the 6 flow types. For each flow type all tracks are depicted on a map and discussed. Impor-tant results are that the tracks are not distributed randomly. Rather, the source regions are similar for several different flow types. The track patterns and directions, however, do vary depending on the flow type.
Knowledge of frequently occurring tracks is important for nowcasting as well as for forecasting next day’s thunder-storm activity. The expected mesoscale organisation can be
I. Bertram and G. J. Mayr: Lightning in the eastern Alps 1993–1999, part I 511 determined referring to the environmental conditions such as
temperature stratification and vertical wind shear. Therefore days with long-living thunderstorms moving over long dis-tances are predictable. Since the dominating tracks for the different flow types are known, it can be estimated in which areas there is a risk of lightning intense storms, which can be connected with severe weather like hail, flash floods or damaging wind.
Interesting extensions of the presented tracking analysis could be the inclusion of weak storms, and a combination with radar and satellite data. Thunderstorm tracks could be evaluated statistically yielding additional results for nowcast-ing purposes. A possibility would be to examine the aver-age track length and the storms’ propagation speed in depen-dence to the wind velocity. The knowledge of the typical lightning intensity changes along a track could help to pre-dict the behaviour of a single storm. Furthermore the results of thunderstorm tracking could be used to investigate the de-pendence of storm movement on the wind direction, similar to Potts et al. (2000).
Acknowledgements. We thank G. Diendorfer at ALDIS who
supplied the lightning detection data. The first author thanks
the Institut f¨ur Meteorologie und Geophysik at the University of Innsbruck (head: M. Kuhn) for financial support to write this article based on his Master’s thesis. Furthermore we thank two anonymous referees for valuable suggestions.
Edited by: U. Ulbrich Reviewed by: 2 referees
References
Banta, R. M.: The role of mountain flows in making clouds. In: Atmospheric processes over complex terrain, edited by Blumen, W., Meteor. Monogr., 23, 229–283, 1990.
Bluestein, H. B.: Synoptic-dynamic meteorologie in midlatitudes, Volume 2, Oxford University Press, New York, 593, 1993. Diendorfer, G., Hofbauer, F., and Stimmer, A.: ALDIS – Das
¨osterreichische Blitzortungssystem, e & i, 109, H5, 261–266, 1992.
Diendorfer, G., Schulz, W., and Rakov, V. A.: Lightning character-istics based on data from the Austrian lightning location system, IEEE Transactions on Electromegnetic Compability, 40, 452– 464, 1998.
Dudhia, J.: Thunderstorms: Part 1, Weather, 51, 371–376, 1996. Dudhia, J.: Thunderstorms: Part 2 – Stormtypes and associated
weather, Weather, 52, 2–7, 1997.
Finke, U.: A lightning statistic for Southern Germany 1992–1994, Map Newsletter, 3, 53–54, 1995.
Finke, U. and Hauf, T.: The characteristics of lightning occurrence in Southern Germany, Beitr. Phys. Atmos., 69, 361–374, 1996. Finke, U.: Space-time correlations of lightning distributions, Mon.
Wea. Rev., 127, 1850–1861, 1999.
Fliri, F.: Das Klima der Alpen im Raume von Tirol, Univer-sit¨atsverlag Wagner, Innsbruck–M¨unchen, 454, 1975.
Foote, G. B.: Aspects of cumulonimbus classification relevant to the hail problem, J. Rech. Atmos., 19, 61–74, 1985.
Hader, F.: Beitr¨age zur ¨osterreichischen Gewitterstatistik, Wetter und Leben, 8, 104–110, 1956.
Hagen, M., Bartenschlager, B., and Finke, U.: Propagation charac-teristics of thunderstorms in Southern Germany, DLR Institut f¨ur Physik der Atmosph¨are, Report No. 97, 12, 1998.
Hagen, M., Schiesser, H.-H., and Doringer, M.: Monitoring of mesoscale precipitation systems in the Alps and northern alpine foreland by radar and rain gauges, Meteorol. Atmos. Phys., 72, 87–100, 2000.
Holle, R. L., Lopez, R. E., and Zimmermann, C.: Updated rec-ommendations for lightning safety – 1998, Bull. Amer. Meteor. Soc., 80, 2, 2035–2041, 1999.
Houze Jr., R. A., Schmid, W., Fovell, R. G., and Schiesser, H.-H.: Hailstorms in Switzerland: Left movers, right movers and false hooks, Mon. Wea. Rev., 121, 3345–3370, 1994.
Huffines, G. R. and Orville, R. E.: Lightning ground flash den-sity and thunderstorm duration in the continental United States: 1989–1996, J. Appl. Meteor., 38, 1013–1019, 1998.
Krider, E. P., Pifer, A. E., and Vance, D. L.: Lightning direction finding systems for forest fire detection, Bull. Amer. Meteor. Soc., 61, 980–986, 1980.
Lauscher, F.: 25 Jahre mit t¨aglicher Klassifikation der Wetterlage in den Ostalpenl¨andern, Wetter und Leben, 24, 185–189, 1972. Lopez, R. E. and Holle, R. L: Diurnal and spatial variability of
light-ning activity in Northeastern Colorado and Central Florida dur-ing the summer.Mon. Wea. Rev., 114, 1288–1312, 1986. Orville, R. E.: Annual summary: Lightning ground flash density
in the contiguous United States – 1989, Mon. Wea. Rev., 119, 573–577, 1991.
Orville, R. E.: Cloud-to-ground lightning flash characteristics in the contiguous United States: 1989–1991, J. Geophys. Res., 99, D5, 10 833–10 841, 1996.
Orville, R. E. and Silver, A. C.: Lightning ground flash density in the contiguous United States: 1992–1995, Mon. Wea. Rev., 125, 631–638, 1997.
Peristeri, M., Ulrich, W., Smith, R. K.: Genesis conditions for thunderstorm growth and the development of a squall line in the northern alpine foreland, Meteorol. Atmos. Phys., 72, 251–260, 1999.
Potts, R. J., Keenan, T. D., and May, P. T.: Radar characteristics of storms in the Sydney area, Mon. Wea. Rev., 128, 3308–3319, 2000.
Schmidt, K. M., Menakis, J. P., Hardy, C. C., Hann, W. J., and Bun-nell, D. L.: Development of coarse-scale spatial data for wild-land fire and fuel management, U.S. Department of Agriculture, Forest Service, Rocky Mountain Research Station General Tech. Rep. RMRS-DTR-87, 46, 2002.
Sch¨uepp. M.: Kalender der Wetter- und Witterungslagen von
1955–1967 im zentralen Alpengebiet, Ver¨offentlichung der SMA Z¨urich, 11, 1968.
Schulz, W.: Performance evaluation of lightning location systems, Ph.D. Thesis, Technical University of Vienna, 1997.
Steinacker, R., Doringer, M., W¨olfelmaier, F., and Krennert, T.: Automatic tracking of convective cells and cell complexes from lightning and radar data, Meteorol. Atmos. Phys., 72, 101–110, 2000.
Wakonigg, H.: Witterung und Klima in der Steiermark. Verlag f¨ur die technische Universit¨at Graz, 310, 1978.
Williams, E. R., Weber, M. E., and Orville, R. E.: The relationship between lightning type and convective state of thunderclouds, J. Geophys. Res., 94, 13 213–13 220, 1989.