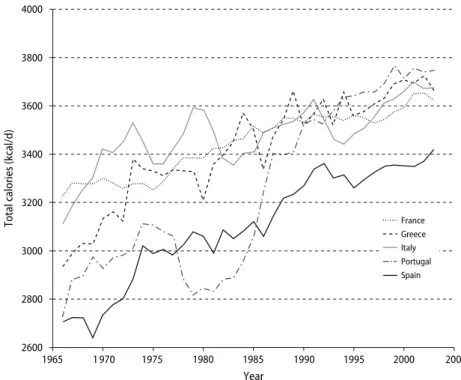
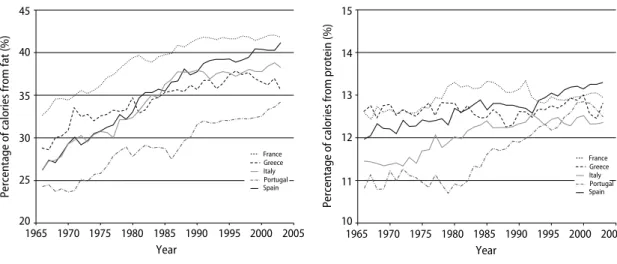
Trends in food availability in Portugal in 1966-2003 : Comparison with other Mediterranean countries
10
0
0
Texte intégral
Figure

Documents relatifs
