HAL Id: hal-02996136
https://hal.archives-ouvertes.fr/hal-02996136
Submitted on 16 Nov 2020
HAL is a multi-disciplinary open access
archive for the deposit and dissemination of
sci-entific research documents, whether they are
pub-lished or not. The documents may come from
teaching and research institutions in France or
abroad, or from public or private research centers.
L’archive ouverte pluridisciplinaire HAL, est
destinée au dépôt et à la diffusion de documents
scientifiques de niveau recherche, publiés ou non,
émanant des établissements d’enseignement et de
recherche français ou étrangers, des laboratoires
publics ou privés.
sources on the glyoxal global distribution
S. Myriokefalitakis, M. Vrekoussis, K. Tsigaridis, F. Wittrock, A. Richter, C.
Brühl, R. Volkamer, J. Burrows, M. Kanakidou
To cite this version:
S. Myriokefalitakis, M. Vrekoussis, K. Tsigaridis, F. Wittrock, A. Richter, et al.. The influence of
nat-ural and anthropogenic secondary sources on the glyoxal global distribution. Atmospheric Chemistry
and Physics, European Geosciences Union, 2008, 8 (16), pp.4965 - 4981. �10.5194/acp-8-4965-2008�.
�hal-02996136�
www.atmos-chem-phys.net/8/4965/2008/ © Author(s) 2008. This work is distributed under the Creative Commons Attribution 3.0 License.
Chemistry
and Physics
The influence of natural and anthropogenic secondary sources on
the glyoxal global distribution
S. Myriokefalitakis1, M. Vrekoussis2, K. Tsigaridis3,*, F. Wittrock2, A. Richter2, C. Br ¨uhl4, R. Volkamer5, J. P. Burrows2, and M. Kanakidou1
1Environmental Chemical Processes Laboratory, Department of Chemistry, University of Crete, Voutes Campus, P.O.Box
2208, 71003 Heraklion, Greece
2Institute of Environmental Physics and Remote Sensing, IUP, University of Bremen, Germany
3Laboratoire des Sciences du Climat et de l’Environnement (LSCE), CNRS-CEA, 91191 Gif-sur-Yvette, France 4Max Planck Institute for Chemistry, Mainz, Germany
5Department of Chemistry and Biochemistry, University of Colorado, Boulder, Colorado, USA *now at: NASA Goddard Institute for Space Studies, New York, NY 10025, USA
Received: 4 December 2007 – Published in Atmos. Chem. Phys. Discuss.: 31 January 2008 Revised: 13 June 2008 – Accepted: 25 July 2008 – Published: 28 August 2008
Abstract. Glyoxal, the smallest dicarbonyl, which has
re-cently been observed from space, is expected to provide in-dications on volatile organic compounds (VOC) oxidation and secondary aerosol formation in the troposphere. Gly-oxal (CHOCHO) is known to be mostly of natural origin and is produced during biogenic VOC oxidation. However, a number of anthropogenically emitted hydrocarbons, like acetylene and aromatics, have been positively identified as CHOCHO precursors. The present study investigates the contribution of pollution to the CHOCHO levels by taking into account the secondary chemical formation of CHOCHO from precursors emitted from biogenic, anthropogenic and biomass burning sources. The impact of potential primary land emissions of CHOCHO is also investigated. A global 3-dimensional chemistry transport model of the troposphere (TM4-ECPL) able to simulate the gas phase chemistry cou-pled with all major aerosol components is used.
The secondary anthropogenic contribution from fossil fuel and industrial VOCs emissions oxidation to the CHOCHO columns is found to reach 20–70% in the industrialized areas of the Northern Hemisphere and 3–20% in the tropics. This secondary CHOCHO source is on average three times larger than that from oxidation of VOCs from biomass burning sources. The chemical production of CHOCHO is calculated to equal to about 56 Tg y−1with 70% being produced from biogenic hydrocarbons oxidation, 17% from acetylene, 11%
Correspondence to: M. Kanakidou
(mariak@chemistry.uoc.gr)
from aromatic chemistry and 2% from ethene and propene. CHOCHO is destroyed in the troposphere primarily by reac-tion with OH radicals (23%) and by photolysis (63%), but it is also removed from the atmosphere through wet (8%) and dry deposition (6%). Potential formation of secondary or-ganic aerosol through CHOCHO losses on/in aerosols and clouds is neglected here due to the significant uncertainties associated with the underlying chemistry. The global annual mean CHOCHO burden and lifetime in the model domain are estimated to be 0.02 Tg (equal to the global burden seen by SCIAMACHY over land for the year 2005) and about 3 h, respectively. The model results are compared with satellite observations of CHOCHO columns. When accounting only for the secondary sources of CHOCHO in the model, the model underestimates CHOCHO columns observed by satel-lites. This is attributed to an overestimate of CHOCHO sinks or a missing global source of about 20 Tg y−1. Using the current primary emissions of CHOCHO from biomass burn-ing together with the anthropogenic combustion sources of about 7 Tg y−1leads to an overestimate by the model over hot spot areas.
1 Introduction
In the presence of nitrogen oxides (NOx=sum of
nitro-gen oxide, NO, and nitronitro-gen dioxide, NO2), the
photo-chemical degradation of volatile organic compounds (VOCs) leads to secondary gaseous and particulate products, such as ozone (O3)and secondary organic aerosols (SOA) that are
important contributors to the “photochemical smog” (see e.g. Poisson et al., 2000; Kanakidou et al., 2005). Air pollution has severe negative effects on human health (Evans et al., 2002; Pope and Dockery, 2006), ecosystems (Gregg et al., 2003) and regional climate (Ramanathan and Crutzen, 2003). The improvement of our understanding of air quality in ur-ban areas requires a detailed knowledge of the sources, sinks and distributions of the all pollutants including VOCs. There are a large number of VOC compounds and their degrada-tion in the troposphere is complex. However, relatively small molecules, such as formaldehyde (HCHO), methylvinylke-tone (MVK) and O3 are formed during the degradation of
many VOC. The amounts and distribution of these gases are determined by both anthropogenic and natural emissions and can be measured in the troposphere.
Recent studies have shown that glyoxal (CHOCHO), the simplest alpha dicarbonyl organic compound, is one of the most prevalent dicarbonyls in the atmosphere. The main pri-mary sources of glyoxal result from biofuel burning (Hays et al., 2002) and vehicle emissions (Kean et al., 2001; Grosjean et al. 2001), but our knowledge of these sources is highly uncertain due to the large variability of emission factors and the scarcity of the available observations. Rates of CHO-CHO emissions from biofuel burning have been reported to be 2 to 5 times higher than those of HCHO (Hays et al., 2002). During the MCMA-2003 campaign in Mexico City, time-resolved direct observations of CHOCHO showed no accumulation of CHOCHO during rush-hour, but a fast rise in CHOCHO concentrations after the onset of photochemical activity, indicating that ambient CHOCHO is dominated by VOC photochemical sources. Recent studies have demon-strated that glyoxal is a useful indicator molecule for VOC oxidation processes (Volkamer et al., 2005b).
CHOCHO is produced via the oxidation of Cn
-hydrocarbons, where n≥2 (Calvert et al. 2000; Calvert et al. 2002), emitted as a result of anthropogenic activity, bio-genic processes and biomass burning sources. It is a first generation product of acetylene oxidation by hydroxyl rad-ical (OH) and is produced from the oxidation of a number of other unsaturated VOCs by O3and OH, including ethene,
C2H4, and isoprene, CH2=C(CH3)CH=CH2(for a
compila-tion of glyoxal precursor VOCs see Volkamer et al., 2005a, and Volkamer et al., 2007, and references therein). Similarly CHOCHO has been identified as a first generation product of the aromatic ring-opening routes during the OH radical initiated oxidation of aromatic hydrocarbons (Volkamer et al., 2001, and references therein). The secondary produc-tion of CHOCHO from the atmospheric degradaproduc-tion of fura-nones, unsaturated γ -dicarbonyls and phenols has been ob-served to be negligible (Volkamer et al., 2001; Bloss et al., 2005). The CHOCHO formation from isoprene, globally the largest source for secondary CHOCHO, mostly proceeds via the further oxidation of the intermediates like glycolaldehyde and C5-hydroxycarbonyls (Saunders et al., 2003), which are
generated in the oxidation of isoprene.
CHOCHO has also been detected in atmospheric aerosols (Kawamura et al., 1996; Matsunaga et al., 2003; Liggio and McLaren, 2003; Garcia-Alonso et al., 2006). It has been sug-gested that CHOCHO is strongly involved in the formation of secondary organic aerosol, SOA, in the troposphere by par-ticipating in heterogeneous reactions that form organic sul-fate compounds (Liggio et al., 2005a). CHOCHO is more reactive with respect to hydration, polymerization and ac-etal/hemiacetal formation in the presence of alcohols than most other aldehydes (Jang and Kamens, 2001). Based on ki-netic studies by Liggio et al. (2005b), the amount of SOA po-tentially formed by CHOCHO could be large enough to ac-count for a significant part of the missing SOA in the low and free troposphere currently not reproduced by models (Heald et al., 2005; Volkamer et al., 2006a). Laboratory measure-ments consistently find evidence for SOA formation from CHOCHO (Liggio et al., 2005a; 2005b; Kroll et al., 2005) but are inconclusive as to the atmospheric relevance as a SOA source. Recent first field evidence of a missing CHOCHO sink is consistent with the upper values of SOA formation from CHOCHO (Volkamer et al., 2007) and supports the at-mospheric relevance of this process.
CHOCHO absorbs in the UV and visible spectral range between 200 and 470 nm with two strong absorption fea-tures: a broad UV band between 220 and 350 nm and a more structured band between 350 and 470 nm (Atkinson et al., 2006 and references therein). The spectrum between 425 and 457 nm includes a sharp peak of CHOCHO at 455 nm (Volkamer et al., 2005c) and several minor features. These structures have been used in the recent direct detection of CHOCHO at local scales (Volkamer et al., 2005b; Sinreich et al., 2007) and global scales (Wittrock et al., 2006) from the measurements of the SCIAMACHY satellite instrument using the well established Differential Optical Absorption Spectroscopy (DOAS) technique.
Simultaneous observations of HCHO, CHOCHO, carbon monoxide (CO) and NO2have been proposed to provide
in-sight to the contribution of photochemistry versus that of pri-mary sources to the building up of pollutants in the tropo-sphere (Garcia-Alonso et al., 2006). HCHO, which has pre-viously been used as an indicator of VOC oxidation (Palmer et al., 2003; Wittrock et al., 2006), is produced in the ox-idation of methane and other VOC. However, over urban hot spot areas, HCHO levels are determined by both direct emissions and photochemical oxidation of VOCs. Observa-tions show that the ambient levels of CHOCHO are about 10 times less affected by primary sources than HCHO (as ar-gued in Volkamer et al., 2005b). CHOCHO is therefore a valuable indicator of VOC oxidation processes (Volkamer et al., 2005b) and particularly of fast photochemistry of anthro-pogenic VOCs (Spaulding et al., 2003). CO is a tracer of pri-mary anthropogenic emissions (Garcia-Alonso et al., 2006). Garcia et al. (2006) used the CHOCHO-CO tracer pair for source apportionment of ambient HCHO and found that 40– 70% (depending on the time of day) of the ambient HCHO
was emission-related in Mexico City. Furthermore, the ratio of CHOCHO to NO2 provides insight into the
photochemi-cal age of the studied air mass since it is increasing with air mass age and conversion of NO2 to nitric acid that is
fur-ther removed from the atmosphere (Volkamer et al., 2005b; Sinreich et al., 2007).
In the present study, a global 3-dimensional chemistry transport model of the troposphere TM4-ECPL is used in order to investigate CHOCHO formation from biogenic, biomass burning and anthropogenic precursors and its sea-sonal variability. The model results are compared with satel-lite observations from the SCIAMACHY instrument taken in 2005. A potential primary anthropogenic source of CHO-CHO is also investigated. Finally, the utility of synergistic use of CHOCHO and other short-lived trace gases observa-tions from space to distinguish between the impact of anthro-pogenic and of natural emissions on tropospheric chemistry is examined.
2 Model description
The model used for the present study is the well documented off-line chemical model TM4 (Noije et al., 2004, 2006). TM4 has been evaluated in the frame of some intercompari-son exercises (Shindell et al., 2006; Stevenintercompari-son et al., 2006). It has 31 vertical hybrid layers from the surface to 10 hPa and can run in two different horizontal resolutions, the low resolution of 6◦×4◦ in longitude and latitude and the high resolution of 3◦×2◦. For the present study, the low resolu-tion version of the model has been used mainly for the source apportionment analysis. The basic simulation has been also performed with the high resolution version TM4-ECPL to in-vestigate the impact of grid size on the calculated CHOCHO columns. The model’s input meteorology comes from the ECMWF operational data for 2005 and is updated every 6 h.
2.1 Emissions
The adopted emissions of primary particles (carbonaceous aerosols, dust, sea-salt, small fraction of sulfate) in TM4-ECPL are presented in detail by Tsigaridis et al. (2006) and Tsigaridis and Kanakidou (2007). For the biogenic VOC emissions TM4-ECPL uses the 1◦×1◦ gridded emis-sion distribution from the POET database (Granier et al., 2005) that is based on the GEIA (Guenther et al., 1995) in-ventory. For the anthropogenic VOC, NOx and CO
emis-sions, TM4-ECPL also uses the POET emission database. This corresponds to the year 2000 that is the most recent year with complete information available. The POET dataset is derived from the Emission Database for Global Atmo-spheric Research (EDGAR) version 3 inventories for the an-thropogenic emissions for the year 1995 with appropriate modifications to refer to recent years (Olivier et al., 2003; Granier et al., 2005). As a result of differences in the
rep-resentation of the VOC chemistry in TM4-ECPL used for this study compared to the earlier studies by Tsigaridis and coworkers, TM4-ECPL uses a different speciation in the VOC emissions. The present study considers annual bio-genic VOC emissions of 501 Tg of isoprene (1 Tg from the oceans) and 244 Tg of monoterpenes and Other Reac-tive Volatile Organic Compounds (ORVOC) that are able to produce aerosols, such as sesquiterpenes, terpenoid alcohols etc, as discussed in Griffin et al. (1999) and incorporated in the model as explained in Kanakidou et al. (2000). Addi-tional biogenic emissions of oxygenated organics not consid-ered as aerosol precursors are those of acetone, CH3COCH3,
methanol, CH3OH, acetaldehyde, CH3CHO, and other light
carbonyls (27 Tg y−1, 243 Tg y−1, 2 Tg y−1and 14 Tg y−1, respectively), which are also taken into account in the model. HCHO emissions from biomass burning and anthropogenic activities of 2.5 Tg y−1 and 1.3 Tg y−1, respectively, are also considered (POET database). The impact of potentially significant anthropogenic primary sources of CHOCHO on its tropospheric column amounts has been investigated in one simulation that considers biomass burning and other an-thropogenic combustion primary CHOCHO emissions to be 4.8 and 2.5 Tg y−1respectively, i.e. almost 2 times (within the range given by Hays et al., 2002) higher than those of HCHO. The adopted emissions of aromatic hydrocarbons (POET dataset) total 33 Tg y−1with about 7% emitted from biomass burning, and in TM4-ECPL consist of 7 Tg y−1 of benzene, 14 Tg y−1 of toluene and 12 Tg y−1 of xy-lene. Among the other compounds of interest for the present study, ethene, propene and acetylene emissions from the same database account for 17 Tg y−1, 7 Tg y−1and 7 Tg y−1, respectively. A table with the global annual emissions used in TM4-ECPL for the present study is given in the Supple-mentary material http://www.atmos-chem-phys.net/8/4965/ 2008/acp-8-4965-2008-supplement.pdf.
2.2 Chemistry
The model considers sulphur, ammonia and C1-C5
hydrocar-bon chemistry including isoprene, as well as highly simpli-fied terpenes and aromatics chemistry. It uses an updated version of the Kanakidou and Crutzen (1999) and Poisson et al. (2000) chemical mechanism suitable to simulate the chemistry of the global troposphere. Gas-phase chemistry and secondary aerosol formation are coupled and computed on-line together with all other major aerosol components (sulphate, nitrate, ammonium, carbonaceous, dust, sea-salt, aerosol water). For the present simulations, dust and sea-salt components have been neglected in order to save comput-ing time. The VOC scheme explicitly considers methane, ethane, ethene, acetylene, propane, propene, butane and iso-prene. Reactions of monoterpenes and aromatics are affect-ing both gas-phase chemistry and aerosol production as de-scribed in Tsigaridis and Kanakidou (2003, 2007). Monoter-penes and ORVOC are represented by α- and β-pinene, while
Table 1. Reactions taken into account in the TM4-ECPL model and describing CHOCHO production and destruction and the references for
the rate coefficients, k, used in the model. a)
Number Reactions (Gas phase chemical production) k Reference 1 Isoprene+OH→0.03CHOCHO+products 2.7 E-11exp(390/T ) IUPAC (2006) 2 C2H4+O3+2O2→0.0044CHOCHO+products 9.1 E-15exp(–2580/T ) IUPAC (2006) 3 C3H6+O3+2O2→0.05CHOCHO+products 5.5 E-15exp(–1880/T ) IUPAC (2006)
4 C2H2+OH→0.635CHOCHO+products 3 bodies reaction IUPAC (2006)
5 Benzene+OH→0.36CHOCHO+products 2.47 E-12exp(207.0/T) Calvert et al. (2002) 6 Toluene+OH→0.306CHOCHO+products 5.96 E-12 Atkinson (1994)
7 Xylene+OH→0.319CHOCHO+products 1.72 E-11 Average of ortho-, meta-, para-isomers 8 HOCH2CHO+OH+O2→CHOCHO+HO2+H2O 2.2 E-12 IUPAC (2006)
b)
Number Reactions (Gas phase chemical destruction) k Reference
1 CHOCHO+OH→2CO+HO2+H2O 2.8×10⁻¹²exp(340/T) Feierabend et al. (2008)
2 CHOCHO+NO3+O2→HNO3+HO2+2CO 1.2 E-15 upper limit estimate by I. Barnes
(personal communication, 2007) 3 CHOCHO+hv→2HO2+2CO JCHOCHO IUPAC (2006)
aromatic compounds are represented by benzene, toluene and xylene. The α- and β-pinene oxidation by hydroxyl (OH) and nitrate (NO3)radicals and ozone are considered
to form semi-volatile organics, which are the precursors of SOA, and C5peroxy radicals, like the first generation peroxy
radicals from isoprene oxidation. The reactions of all per-oxy radicals with hydrogen peroxide (HO2)and methyl
per-oxide (CH3O2)are taken into account as indicated in
Vrek-oussis et al. (2004) with updated kinetics based on Atkin-son et al. (2006). NO3radical reactions with aldehydes,
al-cohols, dimethylsulfide, CH3SCH3 (DMS), butane, C4H10,
and unsaturated hydrocarbons are considered. Aromatics are considered to react with OH, O3 and NO3, with the
reac-tion of OH being the dominant removal process accounting for 100, 99.9, 99.8% of the removal of benzene, toluene and xylene, respectively. The reactions of aromatics with OH produce CHOCHO as a first generation product and peroxy radicals that can further react to form gaseous and aerosol products. For simplicity purposes, their gaseous products are treated in the model as butyloperoxy radicals and attention is paid to preserve the carbon balance. SOA production by VOC oxidation is parameterized as detailed in Tsigaridis and Kanakidou (2003). The full list of chemical reactions and reaction rates adopted in TM4-ECPL is given in the Supple-mentary material http://www.atmos-chem-phys.net/8/4965/ 2008/acp-8-4965-2008-supplement.pdf.
For CHOCHO, the TM4-ECPL model considers primary formation during the oxidation of isoprene, acetylene, aro-matic hydrocarbons (Volkamer et al., 2005a) and ozonoly-sis of ethene and propene as well as secondary formation (via glycolaldehyde – HOCH2CHO) from the oxidation of
ethene and from peroxy radicals produced during the
oxida-tion of isoprene (Table 1). Other biogenic hydrocarbons, like terpenes, and other reactive organics, like sesquiterpenes, and terpenoid alcohols also produce CHOCHO (as secondary product) in TM4-ECPL, since their chemistry is lumped on the first generation peroxy radicals of isoprene (as param-eterized in Tsigaridis and Kanakidou, 2003). CHOCHO is destroyed by photolysis (Volkamer et al., 2005c; Atkinson et al., 2006; Tadic et al., 2006), reaction with OH (Feier-abend et al., 2008) and to a lesser extent with NO3, and
re-moved via wet and dry deposition. For the dry deposition of CHOCHO as for the other gaseous species, the Ganzeveld and Lelieveld (1995) resistance-in-series scheme has been used, which is based on the formulation developed by We-sely (1989). For the wet deposition, both large scale and con-vective precipitation are considered and the in-cloud and be-low cloud scavenging are parameterised in the model TM4-ECPL as described in detail by Jeuken et al. (2001). In-cloud scavenging of CHOCHO is parameterized based on the Henry’s law coefficient of KH=2.6 107M.atm−1(Kroll
et al., 2005) that is 2 orders of magnitude higher than the Henry’s Law coefficient suggested by Lim et al. (2005). The in-cloud loss of CHOCHO has been suggested to be a sig-nificant sink for glyoxal leading to SOA formation (Lig-gio et al., 2005; Loeffler et al., 2006; Sorooshian et al., 2007). The importance of this process for SOA budget in the global troposphere requires further investigation by targeted 3-dimensional simulations.
2.3 The simulations
In order to investigate the influence of natural and anthropogenic emissions of hydrocarbons on CHOCHO
distribution and its global budget, several different CHOCHO-chemistry scenarios have been considered. The first simulation (S1) accounts for CHOCHO production only from the oxidation of the naturally emitted VOCs. S1 also considers in-cloud loss of CHOCHO as explained in Sect. 2.2. The second simulation (S2) is the same as that for S1 but also takes into account the contribution of biomass burning emissions of ethene, propene, acetylene and aromat-ics to the chemical production of CHOCHO. The third sim-ulation (S3, used as the base case for the present study) is as (S2) but considers in addition the contribution of anthro-pogenic emissions of ethene, propene, acetylene and aromat-ics to CHOCHO formation, i.e. accounts for all known pho-tochemical sources of glyoxal. This simulation has also been performed at the high horizontal resolution of TM4-ECPL (S3-H). The difference between the simulations (S2) and (S1) is attributed to the secondary production of glyoxal from the biomass burning VOCs; whereas that between (S3) and (S2) is attributed to the production of glyoxal from anthropogenic VOC. Despite the significant variability in the primary CHO-CHO emission factors and the scarcity of available data, the possible impact of significant primary sources of CHOCHO on its tropospheric columns has been investigated in an ad-ditional simulation (S4) that considers such emissions from biomass burning as well as from anthropogenic combustion sources proportional to those of HCHO (see also Sect. 2.1). Finally, the impact of the assumption of a lower Henry’s law coefficient (KH) for CHOCHO wet removal on its
tropo-spheric burden has been investigated by an additional sim-ulation (S5) that uses a 100 times lower KH than the other
simulations.
When compared with our earlier work (Wittrock et al., 2006), simulation S3 of the present study i) uses updated anthropogenic and biomass burning emission inventories based on the POET database for the year 2000 and about 20% higher isoprene emissions of 500 Tg yr−1, which are within the range of the present-day estimates by Guenther et al. (2006), ii) takes into account the formation of CHO-CHO from ethene, propene, acetylene and aromatics that are predominantly of anthropogenic origin but have also a mi-nor natural component, iii) takes into account the tempera-ture dependence of the reaction of CHOCHO with OH rad-icals (Feierabend et al., 2008), and iv) calculates on line as described by Landgraf and Crutzen (1998) and Lelieveld et al. (2002) the photolysis rates of CHOCHO based on the IU-PAC and JPL recommendations (Atkinson et al., 2006 and references therein; Sander et al., 2006). Moreover, Wittrock et al. (2006) used diurnal mean CHOCHO columns to com-pare with the satellite observations whereas in the present study the columns calculated for the satellite overpass time have been used (10–11 a.m. local time).
3 Satellite observations
3.1 The instrument
The sensor SCIAMACHY (SCanning Imaging Absorption spectroMeter for Atmospheric CartograpHY) is mounted on the ESA ENVISAT satellite. It is designed to measure sun-light transmitted, reflected and scattered by the earth’s at-mosphere or surface in the ultraviolet, visible and near in-frared (Burrows et al., 1995; Bovensmann et al., 1999). The sun-synchronous, near polar orbit of the satellite has a local equator crossing time of 10 a.m. in the descending node. The alternative measurements of nadir and limb viewing geome-tries (Gottwald et al., 2006) are coupled with a swath width of 960 km and global coverage is achieved within six days. The ground pixel size used in this study is 30 km along track by 60 km across track.
3.2 The retrieval technique and CHOCHO algorithm The retrieval approach adopted for the vertical columns of CHOCHO is based on the well established DOAS technique. Briefly, DOAS is used for the determination of the Slant Col-umn densities (SCD) of the respective absorbers in a given spectral window (436–457 nm for the present study). Only ground scenes having less than 20 percent cloud cover are considered. The SCD is then converted to Vertical Column Densities (VCD) by applying the air mass factor (AMF), which is defined as the ratio of the SCD/VCD. This accounts for the path of light through the atmosphere and considers the vertical profiles of scattering and absorbing species (Wittrock et al., 2004). The absorption cross sections of CHOCHO (Volkamer et al., 2005c), O3, NO2, H2O, O4, phytoplankton
(Bracher and Tilzer, 2001; Vountas et al., 2007), a ring spec-trum, which accounts for rotational Raman scattering, and a quadratic polynomial are included in the fitting procedure.
Prior conversion to vertical columns, the retrieved slant columns are normalised by assuming a mean value of 0.5 1014 molecules.cm−2 for CHOCHO over the Pacific in lat-itudes (30◦N—30◦S) in the region between 165◦E and 165◦W. This normalisation is necessary for many GOME and SCIAMACHY products to compensate for offsets intro-duced by the solar reference measurements and interference from other absorbers (Richter and Burrows, 2002). More de-tails on the CHOCHO analysis can be found in (Wittrock et al., 2006). For comparison with the global model, the SCIA-MACHY data, which initially are gridded to 0.125◦×0.125◦,
have been re-gridded to the horizontal resolution of the model. This data manipulation could justify the anomalous high values of CHOCHO near a few ice/water borders shown in Fig. 1.
Table 2. TM4-ECPL model calculations of CHOCHO (S3-S3H; range of seasonal values for the low and high resolution simulations; S4:
seasonal mean values and standard deviation) and comparisons with ground based observations. Observations are associated with an error of at least ±15%.
Location Coordinates Period Model
(S3-S3H) (ppbv) Model (S4) (ppbv) Observations (ppbv) Reference Pinnacles, Shenandon National Park 36.29 N 121.10 W
Autumn 0.04–0.13 0.06±0.01 0.04 Munger et al. (1995)
Georgia, USA
32.32 N 82.08 E
Summer 0.02–0.03 0.02±0.01 0.02–0.09 Lee et al. (1995)
Long Beach, Central LA, Azusa, Claremont, USA
33.4 N 118.11 W (mean)
Autumn 0.07–0.14 0.09±0.03 0.78 ±0.85 Grosjean et al. (1996)
Porto Allegre, Brazil
30.2 S 51.1 W
Spring 0.02–0.08 0.02±0.01 0.30 Grosjean et al. (1999)
Los Angeles, USA
34.3 N 118.15 W
Autumn 0.02–0.07 0.09±0.03 0.04–0.95 Kawamura et al. (2000)
Giesta, Portugal
41.11 N 8.35 E
Summer 0.01 0.01 0.52–2.42 Borrego et al. (2000)
Las Vegas, USA 36.10 N 115.12 W Summer Winter 0.11–0.17 0.02–0.11 0.18±0.5 0.14±0.01 0.12–0.42 0.09–0.21 Jing et al. (2001) Hong Kong, China 22.18 N 114.1 E Winter 0.05–0.06 0.09±0.03 19.70–28.0 8.40–23.7 8.60–11.9 8.80–14.8 Ho and Yu (2002) Pabsthum (near Berlin), Germany 52.51 N 12.56 E
Summer 0.18±0.03 0.17±0.03 0.01–0.12 Moortgat et al. (2002)
Mexico City, Mexico 19.24 N
99.12 W
Spring 0.21–0.41 0.35±0.13 0.15–1.82 Volkamer et al. (2005)
MIT, USA
42.36 N 71.09 W
Summer 0.19–0.41 0.18±0.03 0.04–0.14 Sinreich et al. (2007)
ICARTT 2004 RV Ron Brown
43 N 68 W
Summer 0.14–0.19 0.18±0.03 0.10–0.35 Sinreich et al. (2007)
4 Results and discussion
4.1 Comparison of CHOCHO from model and surface ob-servations
Even at its high spatial resolution of 2◦latitude and 3◦ longi-tude, TM4-ECPL has a rather coarse grid that at 45◦N
cor-responds to about 220 km in latitude×230 km in longitude. Therefore, it is expected that as most global models, TM4-ECPL underestimates short lived species concentrations over hot spot areas. This is because these hot spot areas extend only over a small fraction of the surface of the model grid boxes and thus in these model grids the short lived species are artificially diluted over hot spot areas by instantaneous mixing with cleaner air from the surrounding locations in the same grid boxes. Keeping in mind these limitations, the
re-sults of the high resolution TM4 simulation (S3-H) are evalu-ated by comparison with ground based observations reported in the literature for different places of the world (Table 2). An overall reasonable agreement is seen between the TM4-ECPL S3-H simulated boundary layer CHOCHO concentra-tions and the surface observaconcentra-tions. The model reproduces well the observations by Sinreich et al. (2007) at coastal oceanic areas on board the RV Ron Brown. In contrast, it misses the extremely high values observed inside the urban core of Hong Kong by Ho and Yu (2002).
In addition to the above mentioned spatial effects that con-tribute to the differences between model results and obser-vations, uncertainties in oxidant fields, VOC loadings and particulate matter levels are also at the origin of differences illustrated in Table 2. The use of emission inventories for the year 2000 to simulate the year 2005 can also cause some
discrepancies. In addition, potentially existent primary CHO-CHO sources that have been neglected in TM4-ECPL (as discussed in Sect. 2.3) could be a reason for an underesti-mate of CHOCHO levels by simulation S3. However, results from the simulation S4 that accounts for some potential pri-mary sources of CHOCHO are also reported in Table 2 and indicate only minor improvement in the model comparisons with surface observations. On the other hand, a potentially strong missing sink of CHOCHO could explain an overesti-mate of CHOCHO in the model. Such a sink of CHOCHO on aerosols has been suggested by Volkamer et al. (2007) to reconcile glyoxal observations in Mexico City with results of a box model that was very well experimentally constrained.
It has to be stressed that there is a clear need for more ground based CHOCHO observations available for model and satellite evaluations, in particular over oceanic areas since most of the CHOCHO observations are restricted to continental anthropogenically influenced locations.
4.2 Annual mean CHOCHO columns
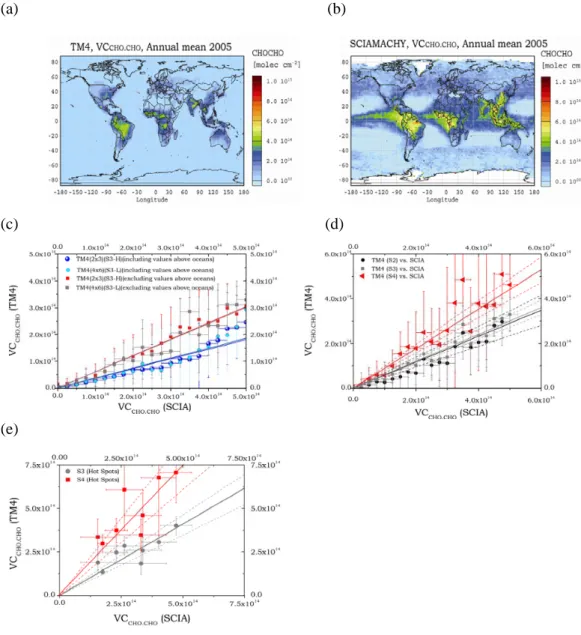
Focusing on the global annual mean CHOCHO column distribution for the year 2005, the S3-H simulations are compared with the columns retrieved from SCIAMACHY measurements in Fig. 1. The model (Fig. 1a) captures high columns of CHOCHO in the tropics associated mainly with biogenic and biomass burning emissions, in agreement with the retrievals based on SCIAMACHY measurements (Fig. 1b), although the model underestimates the observa-tions.
As seen in the figures, the current version of TM4-ECPL does not reproduce the significant amounts of CHOCHO re-trieved from SCIAMACHY measurements over the tropical oceans close to upwelling areas neither at high latitudes in regions of primary productivity. For quantitative analysis, the simulated annual mean CHOCHO vertical columns have been plotted against the SCIAMACHY annual mean obser-vations in 2005 for all grid boxes with SCIAMACHY ob-servations (Fig. 1c). To reduce the variability of the data, the modeled CHOCHO columns were grouped (binned) into values of 0.25 1014molecules cm−2of SCIAMACHY obser-vational data, independent from the exact location of these observations. Results from both high (S3-H) and low (S3) horizontal resolution simulations have been plotted. It ap-pears that the two simulations behave similarly (no statistical difference) with regard to observations. Both these correla-tions correspond to linear fits with slopes of 0.43±0.07 and correlation coefficient r of 0.95. Additional comparison of model results with observations, excluding the values over the oceans, indicate better correlation (r=0.99) and slope of 0.61±0.07. This behavior is best explained by
(a) the existence of primary or secondary tropical sources of CHOCHO over the oceans, neglected or underesti-mated by the current model;
(b) a current underestimation of the land sources when only secondary emissions of glyoxal are taken into account by the model.
Figure 1c indicates that at least about 25% of the CHOCHO column is missing in the model when accounting for all data and their variability. Taking into account the global sec-ondary source calculated by TM4-ECPL of 56 Tg y−1 this missing CHOCHO source corresponds to about 20 Tg y−1 that could be entirely or partially located over the oceans (see further discussion for the existence of primary land sources). Phytoplankton bloom areas could release significant amounts of VOC in the atmosphere (J. Williams, personal commu-nication, 2008). Such emissions are not taken into account in the present study. Note that this discrepancy could be also attributed to an overestimate of glyoxal sinks. Com-pared to the earlier simulations in Wittrock et al. (2006), in the present study TM4-ECPL is able to reproduce part of the outflow from the continents (Sinreich et al., 2007) and slight enhancement over the tropical oceans and the north Atlantic that are seen by SCIAMACHY. These patterns are under investigation and can not be properly reproduced by TM4-ECPL based on the processes that are actually consid-ered to control CHOCHO levels in the model.
Figure 1d focuses on the low resolution simulations S2, S3 and S4. Taking only the model results over the continents into consideration, the binned data, derived as explained, are plotted in Fig. 1d against the annual mean vertical col-umn of CHOCHO derived from SCIAMACHY. S3 consid-ers all known photochemical sources of CHOCHO. S2 ne-glects the anthropogenic contribution to the secondary CHO-CHO source. Finally, S4 accounts also for potential primary sources of CHOCHO from combustion. Figure 1d suggests that i) TM4-ECPL underestimates the annual mean CHO-CHO columns observed by SCIAMACHY in 2005, ii) when accounting for the anthropogenic contribution to the photo-chemical formation of CHOCHO, TM4-ECPL results com-pare better with the observations and iii) consideration of pri-mary anthropogenic sources of CHOCHO further improves the general agreement of model results with satellite obser-vations over land.
Figure 1e focuses on 8 hot spot areas around the globe, including China where anthropogenic emissions increase rapidly (see figure caption for the geographic definition of the areas). It appears that i) simulation S3, considering only secondary sources of CHOCHO, agrees with satellite obser-vations over these areas within the 95% confidence level, although generally it underestimates the columns over land (Fig. 1d); ii) simulation S4 overestimates CHOCHO columns over source areas (Fig. 1e), although it seems to perform rel-atively well (95% confidence level) with regard to the global burden of glyoxal over land (Fig. 1d). Both simulations S3 and S4 underestimate the surface observations as shown in Table 2. Due to the high uncertainties both in potential pri-mary emissions of CHOCHO and in satellite retrievals, these
(a)
(b)
(c) (d)
(e)
Fig. 1. Global annual mean column distribution of CHOCHO (in 2◦×3◦grid) for the year 2005 (in molecules cm−2): (a) Simulated by TM4-ECPL, taking into account all glyoxal sources (simulation S3-H).
(b) Retrieved from the measurements made by the satellite based sensor SCIAMACHY
(c) Comparison of annual mean glyoxal columns from TM4-ECPL-S3 simulations and SCIAMACHY data product (in units of molecules cm−2). The points show the annual mean simulated columns for the year 2005 binned every 0.25 1014molecules cm−2of the cor-responding SCIAMACHY observations, together with their standard deviations. Dark blue circles and light blue are the binned data when both land and oceanic grids are considered for the TM4-ECPL-S3-H and TM4-ECPL-S3 simulations, respectively. Solid red and black squares are the corresponding binned data when neglecting the grid cells over the oceans.
(d) Comparison of annual mean glyoxal columns from TM4- ECPL simulations and SCIAMACHY data products (in units of molecules cm−2). Binned data over the continents; red triangles are for S4 simulation, solid gray squares for S3 simulation, and solid black circles for S2 simulation. Linear fit regression lines are also plotted with the corresponding color.
(e) Comparison of annual mean glyoxal columns from the TM4-ECPL simulations S3 (circles) and S4 (squares) with the SCIAMACHY data products (in units of molecules cm−2)over hot spot areas. Linear regression lines given in grey and red (and 95% confidence level interval), respectively, correspond to a slope of 0.81±0.05 (R2=0.92) for S3 and of 1.43±0.14 (R2=0.95) for S4. Hot spot areas are defined as follows: Central Europe (42 N: 54 N; 6 E: 24 E); NE USA (30 N:42 N; 96 W:78 W); Central S America (Amazon) (18 S:6 S; 66 W: 48 W); Central N Africa (2 S:10 N; 12 E:30 E); Central S Africa (18 S:6 S; 12 E:30 E); India (18 N:30 N; 72 E:90 E); China (26 N:38 N; 102 E:120 E); Australia (26 S:14 S; 120 E:138 E).
simulations are not conclusive with regard to the magnitude of the primary CHOCHO source. Overestimate of CHOCHO sink in the model could be responsible for part of the discrep-ancies between model results and observations.
Figure 2a depicts the distribution of the global annual mean CHOCHO column for the year 2005, computed by the S3 simulation and is compared with that from the SCIA-MACHY observations at the same spatial resolution (4◦×6◦)
shown in Fig. 2c. Figure 2b shows the calculated annual mean column of CHOCHO produced from biogenic VOC oxidation (simulation S1). The majority of the annual mean column of CHOCHO over the tropics, which maximizes at around 5 1014 molecules cm−2, is attributed to the ox-idation of biogenic VOCs. Annual mean columns smaller than 3 1014molecules cm−2 are computed over the North-ern Hemisphere mid-latitude continental regions. Note that these biogenically derived CHOCHO columns are slightly smaller than the earlier simulations presented in Wittrock et al. (2006), which did not account for the wet removal of CHOCHO in clouds and used a lower estimate of the pho-tolysis rate of CHOCHO than the present study.
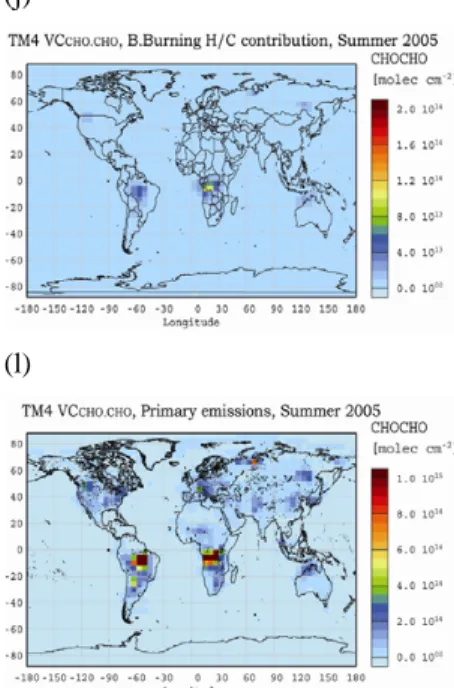
The secondary biomass burning source of CHOCHO from the oxidation of VOCs is taken into account in the simula-tions (S2 and S3) and is evaluated as the difference between the simulations S2 and S1 that is depicted in Fig. 2e (annual mean column) and Fig. 3i,j (seasonally mean columns). Ac-cording to our calculations, based on current knowledge of VOCs released by biomass burning, the secondary source of CHOCHO from biomass burning contributes about 3 Tg y−1 to the global chemical production of glyoxal and therefore in-creases its global annual mean burden by about 5%, adding at most 2 1014 molecules cm−2to the CHOCHO column over tropical biomass burning areas. As mentioned in Sect. 2.3, primary emissions of CHOCHO from burning in the tropics (and elsewhere) have been considered only in simulation S4. Although these emissions are highly uncertain, they might be of importance for CHOCHO columns over source regions. The contribution of a potential primary source of CHOCHO from combustion, including biomass burning, is depicted in Fig. 2f and is shown to maximize over the tropics. There, primary emissions are evaluated to contribute with up to 8 1014 molecules cm−2 to CHOCHO annual mean columns (Fig. 2f). Simulations S3 and S4 also calculate significant CHOCHO columns of about 2 to 6 1014 molecules cm−2 over hot spot regions of anthropogenic activity areas of the USA, Europe, India and China (Fig. 2d and f) that are also detectable from space but are not reproduced in simulations S1 and S2. Note that Fig. 2d depicts the increase in the an-nual mean column of CHOCHO accounting for CHOCHO production during the oxidation of anthropogenically emitted VOC (difference between simulations S3 and S2). This sec-ondary source of CHOCHO from anthropogenic emissions contributes about 13 Tg y−1to the global chemical produc-tion of CHOCHO, i.e. about 20% of the overall chemical pro-duction. The CHOCHO global annual mean burden resulting
from the anthropogenic emissions is about 32% of the total; this fraction is larger than the corresponding fraction of the chemical production. This reflects the fact that the secondary anthropogenic source is located mostly in the extra-tropics where the destruction of CHOCHO by photolysis and reac-tion with OH radical is moderate and thus CHOCHO lifetime is longer than its global mean value.
On the contrary, in S3 the biogenically derived burden of CHOCHO is 63% of the total CHOCHO burden whereas the corresponding chemical production is higher, about 77% of the total. This increased chemical production is compensated by a shorter lifetime of CHOCHO in the tropics. Thus, the computed global lifetime of glyoxal averaged year-around increases from 2.4 h when only biogenic sources are taken into account (S1) and 2.5 h when biomass burning sources are also considered (S2) to 3 h when all secondary sources are taken into account (S3).
Our simulations indicate that the global mean lifetime of CHOCHO critically depends on the location of its sources. In particular, the anthropogenic sources of CHOCHO are more effective in increasing its burden since they are located mostly in the mid latitudes where the photochemical sink of glyoxal is moderate.
4.3 Seasonal variation
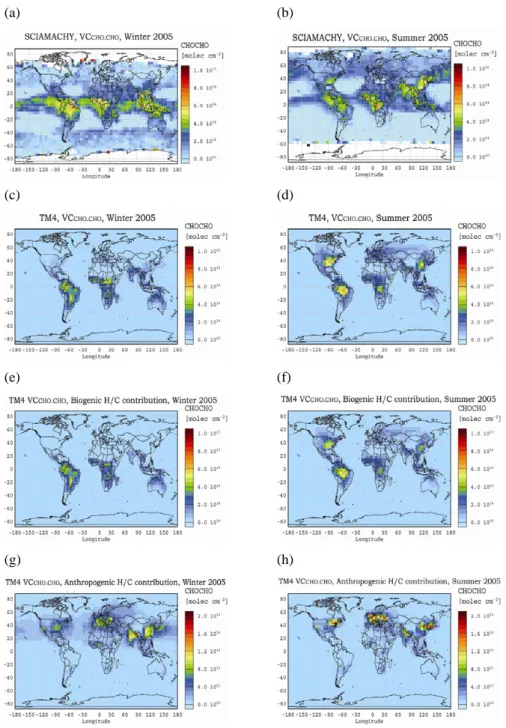
The seasonal patterns of the calculated and observed CHO-CHO columns have also been compared. Figure 3 depicts the NH winter and NH summer column distributions of CHO-CHO as observed by SCIAMACHY (panels 3a and b, respec-tively) and as calculated by the TM4-ECPL S3 simulation (panels 3c and d, respectively). In the NH, TM4-ECPL simu-lations show higher CHOCHO columns during summer than during winter in agreement with the satellite observations, reflecting the photochemical origin of CHOCHO and the im-portant contribution of the biogenic VOC oxidation to CHO-CHO chemical production (Fig. 3e and f). It is also remark-able that during NH summer the model overestimates the CHOCHO over the Amazon, but not over the African tropi-cal forests. Biomass burning emissions occurring mostly in the tropics have a strong seasonality with significantly differ-ent geographical patterns from one season to another. This is reflected in the CHOCHO distribution as depicted in Fig. 3i and j. However, their contribution to the CHOCHO columns is minor compared to that from the biogenic VOC oxidation (Fig. 3e and f). The most likely explanation of the model overestimate of CHOCHO columns is related to the biogenic VOC emission inventory used.
Biogenic VOC emissions are enhanced under warm and sunny conditions (Guenther et al., 2006); between 30◦N and 60◦N are about 50 times higher during summer than during winter. On the contrary, the anthropogenic VOC emissions present a much weaker seasonality. In our model simula-tions this seasonality is neglected, because both the EDGAR and POET emissions database do not provide information on
(a) (b) (c) (d) (e) (f)
Fig. 2. Global annual mean column distribution of CHOCHO (in 4◦×6◦grid) for the year 2005 (in molecules cm−2): (a) Simulated by TM4-ECPL taking into account all secondary glyoxal sources (simulation S3).
(b) Simulated by TM4-ECPL taking into account only the CHOCHO source from biogenic VOC oxidation. (c) Observed by the satellite based sensor SCIAMACHY (reduced spatial resolution)
(d) Simulated by TM4-ECPL to be produced by the anthropogenic VOC oxidation (e) Simulated by TM4-ECPL to be produced by the biomass burning VOC oxidation
(f) Simulated by TM4-ECPL to result from primary emissions from biomass burning and other combustion sources.
the seasonal variability of the anthropogenic VOC emissions. The calculated hydroxyl radical concentration, the main tro-pospheric oxidant responsible for CHOCHO formation, ex-hibits a strong seasonality, having a summer-to-winter ra-tio that varies near the surface in the northern troposphere mid-latitudes from about 2 to more than 20, as presented in Fig. 4. The strong seasonality in oxidant levels and biogenic emissions leads to about 25% higher global production of CHOCHO during the NH summer than during the NH win-ter (Fig. 3g and h). In parallel, the losses of CHOCHO are
also about 25% higher during summer as a result of increased losses of CHOCHO by photodissociation (20%), by reaction with the OH radical (40%) and by deposition (25%). The overall result is an almost 10% enhancement of the CHO-CHO column during NH summer (global burden 0.019 Tg) compared to NH winter (global burden 0.017 Tg). The con-sideration of potential primary sources of CHOCHO (sim-ulation S4) is also introducing significant seasonality since biomass burning emissions maximize during the dry season. The estimated seasonal contribution of this primary source
(a) (b) (c) (d) (e) (f) (g) (h)
Fig. 3. NH winter (a, c, e, g, i, k) and NH summer (b, d, f, h, j, l) mean columns of glyoxal as retrieved from SCIAMACHY observations (a,
b) and as computed by TM4-ECPL taking into account formation of glyoxal from VOC emitted from (c, d) all sources; (e, f) only biogenic sources; (g, h) only anthropogenic sources and (i, j) only biomass burning, for the year 2005. (k, l) computed CHOCHO columns derived from biomass burning and other combustion primary sources. Columns are given in 1015molecules cm−2. Note the different color scale in figures g to j.
to CHOCHO column is shown in Fig. 3k and l. Finally, in the present study, a potential aerosol sink of CHOCHO that could be of relevance for atmospheric conditions is not taken into account, because of our limited current knowledge about this process.
4.4 Ratios of trace gases columns
As a result of the strong anthropogenic signal in the CHO-CHO column, it is expected that synergistic use of CHO-CHOCHO-CHO and HCHO observations from space provides a powerful tool to evaluate the impact of VOC emissions on tropospheric
(i) (j)
(k) (l)
Fig. 3. Continued.
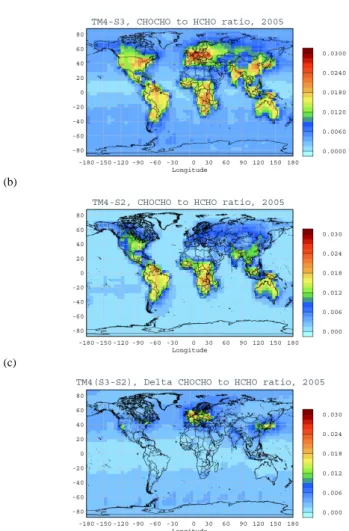
chemistry, as a function of source region and type. This proposition has been investigated by examining the com-puted ratios of CHOCHO to HCHO over the tropics and over the hot-spot areas in the Northern Hemisphere. The satel-lite observations of CHOCHO and HCHO molecules were used to compute the respective ratio above the 30 most pop-ulated areas of the world (http://www.infoplease.com/ipa/ A0884418.html). The mean CHOCHO/HCHO ratio above these regions is 0.037±0.014. This mean ratio is in good agreement with the value of 0.025 observed in Mexico City based on the data provided by Garcia et al. (2006), and tak-ing into account the diurnal profile of these carbonyls to match the satellite overpass time. The same analysis per-formed above biogenic sources gave an enhanced average value equal to 0.050±0.025. This latter number is in good agreement with the range of values 0.04–0.06 reported by Munger et al. (1995) and Spaulding et al. (2003). These val-ues are contrasted with those computed by the TM4-ECPL model (Fig. 5a): the model calculated ratios, derived from the 10–11 a.m. local time simulations, are in reasonable agree-ment with the satellite data (not shown) over the selected re-gions with intense anthropogenic emissions, namely Europe, China, India and the United States. Figure 5b illustrates the same ratio when the anthropogenically produced CHOCHO is ignored (simulation S2). As expected, the major impact of this photochemical source of CHOCHO is seen above the Northern Hemisphere urban areas.
The differences in the CHOCHO to HCHO ratio between simulations S3 and S2 that is attributed to the photochem-ical source of CHOCHO from human activities is shown in
Fig. 5c in which the anthropogenically influenced regions are clearly identified.
4.5 CHOCHO annual global budget
According to the TM4-ECPL simulations, CHOCHO global annual chemical production totals 56 Tg CHOCHO y−1. Ap-proximately 70% results from the oxidation of biogenics, iso-prene and terpenes, among which the predominant portion is formed via formation of glycolaldehyde and hydroxyace-tone and subsequent degradation. To a smaller extent CHO-CHO is formed from AVOCs, i.e. 17% from acetylene, 11% from aromatics, and 2% from ethene and propene. Accord-ing to the TM4-ECPL model simulations, the contribution of anthropogenic VOCs oxidation to the CHOCHO column is limited to 3–20% over the tropics and maximizes over ur-ban areas and downwind in the Northern Hemisphere, reach-ing values of 20–70%. However, the CHOCHO column is relatively low (∼2 to ∼4 1014 molecules cm−2)in the an-thropogenic influenced regions. This is consistent with find-ings in Mexico City, where aromatics contribute some 70– 80% to the CHOCHO production rate. A direct comparison of the relative contribution of individual VOC sources and CHOCHO sinks is possible for Mexico City (data from Ta-ble 1 of Volkamer et al., 2007) and the Pearl River Delta (Volkamer et al., 2006b), and shows good agreement with the model results of this study. Consideration of primary CHOCHO sources would further increase by about 20% the anthropogenic and by about 160% the biomass burning an-nual CHOCHO sources. TM4-ECPL also evaluates that the glyoxal secondary production from biogenic and biomass
(a)
(b)
Fig. 4. NH Summer to NH winter ratios of (a) computed OH
radi-cal, (b) of computed glyoxal column (simulation S3-H).
burning VOC oxidation has been significantly enhanced (al-most doubled) due to the changes in oxidants levels induced from anthropogenic activities.
CHOCHO is destroyed by photolysis (63%), and OH rad-ical reactions (23%), but it is also removed from the atmo-sphere through wet deposition (8%) and dry deposition (6%). As a result, for CHOCHO the global annual mean burden in the model domain equals 0.02 Tg (equal to the global burden seen by SCIAMACHY over land in the year 2005) and the lifetime is around 3 h.
It is also remarkable that according to our model simula-tions, on an annual basis about 5 Tg of CHOCHO are re-moved from the atmosphere via wet deposition. The robust-ness of this result is investigated by simulation S5 that used a 2 orders of magnitude lower KH for CHOCHO. In that
sim-ulation, both the lifetime and the global burden of CHOCHO increase by about 2% as a result of a reduction in its wet de-position by about 8%. Note that this loss of CHOCHO in clouds has the potential to form secondary organic aerosol as the result of cloud processing of glyoxal, and has to be con-sidered as an indication of the order of magnitude for glyoxal contribution to SOA formation via this procedure. Recently, Fu et al. (2008) have evaluated this source of SOA from gly-oxal at 2.6 Tg y−1. Evidence for glyoxal related SOA
forma-(a)
(b)
(c)
Fig. 5. Annual mean ratios of CHOCHO to HCHO as simulated by
TM4-ECPL (a): simulation S3 and (b): simulation S2. (c) Differ-ence in this ratio is attributed to the anthropogenic contribution to the CHOCHO column.
tion in the absence of clouds as recently indicated by Volka-mer et al. (2007) may however add further SOA. This topic requires further investigation and refinement.
5 Conclusions
The global 3-dimensional chemistry/transport model TM4-ECPL has been adapted to simulate the temporal and spa-tial distribution of CHOCHO columns in the global tropo-sphere. This study has focused on the anthropogenic contri-bution to the CHOCHO column amounts and their season-ality. Aromatics and other hydrocarbons of anthropogenic origin play an important role in determining CHOCHO col-umn abundances. Wittrock et al. (2006) showed significant amounts of CHOCHO above highly populated regions re-trieved from the measurements by the SCIAMACHY sen-sor aboard ENVISAT. The enhanced CHOCHO columns
above these regions are confirmed by ground-based satel-lite validation efforts in Mexico City, and the Pearl River Delta, China (Volkamer et al., 2006b). The global annual chemical production of CHOCHO has been calculated by the TM4-ECPL model to be 56 Tg CHOCHO y−1. Com-pounds of anthropogenic origin account for about 30% of the total chemical production of CHOCHO; acetylene produc-ing about 17% and aromatic hydrocarbons (toluene, xylene and benzene) about 11%. According to TM4-ECPL model calculations, the contribution of anthropogenic VOC to the CHOCHO column is in the range of 3–20% over the trop-ics and maximizes over urban-influenced areas in the North-ern Hemisphere where it reaches 70%. Primary emissions of CHOCHO could increase the anthropogenic contribution to the global annual CHOCHO source by about 5%. The improvements in the model chemistry of CHOCHO com-pared to the earlier study by Wittrock et al. (2006) resulted in better agreement between the model results and the gly-oxal observations in the mid latitudes. However, comparison of model results that take into account only the secondary source of CHOCHO with satellite observations indicates a missing CHOCHO source of about 20 Tg y−1or an overesti-mate of its sinks by the model. In particular, the model does not capture the enhancement of CHOCHO columns over the tropical ocean seen by SCIAMACHY. This points to the ex-istence of primary and/or secondary tropical and/or oceanic sources of CHOCHO, currently neglected or underestimated by the model.
Our model simulations evaluate that 5 Tg CHOCHO y−1 are removed by precipitating clouds. This amount indicates the order of magnitude of a potential CHOCHO contribution to the SOA formation via multiphase chemistry in clouds. This estimate deserves careful and further refinement. The current limited description of the role of primary production in oceans, the release of particles and organic compounds from oceans, the physics and chemistry of clouds and pos-sibly aerosols introduce significant uncertainties in the mod-eled CHOCHO and require further study.
Acknowledgements. This study has been facilitated by the EU
Network of Excellence ACCENT. SM. acknowledges support by a PENED 03ED373 grant co-financed by EU-European Social Fund (75%) and the Greek Ministry of Development – GSRT (25%). M. V. acknowledges consecutive supporting fellowships by the A. v. Humbolt Foundation and the EU (Marie Curie – Intra European Fellowships). The research undertaken for this study at the University of Bremen has been supported by the University and State of Bremen. The SCIAMACHY data is a nationally funded contribution to the ESA ENVISAT. We thank K. Feierabend and J. Burkholder for communication of their results prior publication. Edited by: A. Nenes
References
Atkinson, R., Baulch, D. L., Cox, R. A., Crowley, J. N., Hampson, R. F., Hynes, R. G., Jenkin, M. E., Rossi, M. J., Troe, J., and IU-PAC Subcommittee: Evaluated kinetic and photochemical data for atmospheric chemistry: Volume II - gas phase reactions of organic species, Atmos. Chem. Phys., 6, 3625–4055, 2006, http://www.atmos-chem-phys.net/6/3625/2006/.
Bloss, C., Wagner, V., Jenkin, M. E., Volkamer, R., Bloss, W. J., Lee, J. D., Heard, D. E., Wirtz, K., Martin-Reviejo, M., Rea, G., Wenger, J. C., and Pilling, M. J.: Development of a de-tailed chemical mechanism (MCMv3.1) for the atmospheric ox-idation of aromatic hydrocarbons, Atmos. Chem. Phys., 5, 641– 664, 2005,
http://www.atmos-chem-phys.net/5/641/2005/.
Bovensmann, H., Burrows, J. P, Buchwitz, M, Frerick, J., Noel, S., Rozanov, V. V. Chance, K. V, and Goede, A. P. H.: SCIA-MACHY: Mission objectives and measurement modes, J. Atmos. Sci., 56, 127–150, 1999.
Borrego, C., Gomes, P., Barros, N., and Miranda, A. I.: Importance of handling organic atmospheric pollutants for assessing air qual-ity, J. Chromatography A., 889, 271–279, 2000.
Bracher, A. and Tilzer, M.: Underwater light field and phytoplank-ton absorbance in different surface water masses of the Atlantic Sector of the Southern Ocean, Pol. Biol., 24, 687–696, 2001. Burrows, J. P., H¨olzle, E., Goede, A. P. H., Visser, H., and Fricke,
W.: SCIAMACHY – Scanning Imaging Absorption Spectrome-ter for Atmospheric Chartography, Acta Astronautica, 35, 5 445– 451, 1995.
Calvert, J. G., Atkinson, R., Kerr, J. A., Madronich, S., Moortgat, G. K., Wallington, T. J., and Yarwood, G.: The Mechanisms of Atmospheric Oxidation of the Alkenes, Oxford University Press, New York, 2000.
Calvert, J. G., Atkinson, R., Becker, K. H., Kamens, R. M., Sein-feld, J. H., Wallington, T. J., and Yarwood, G.: The Mechanisms of Atmospheric Oxidation of Aromatic Hydrocarbons, Oxford University Press, Oxford, 2002.
Evans, J., Levy, J., Hammitt, J., Santos-Burgoa, C., Castille-Jos, M., Caballero-Ramirez, M., Hernandez-Avila, M., Riojas-Rodriguez, H., Rojas-Bracho, L., Serrano-Trespalacios, P., Spen-gler, J. D., and Suh, H.: Health benefits of air pollution control, in: Air Quality in the Mexico Megacities: An Integrated As-sessment, edited by: Molina, L. T. and Molina, M. J., Kluwer Academic Publishers, 103–136, 2002.
Feierabend, K., Zhu, L., Talukdar, R. K., and Burkholder, J. B.: Rate coefficients for the OH+HC(O)C(O)H (Glyoxal) re-action between 210 and 390 K, J. Phys. Chem. A, 112, 73–82, doi:10.1021/jp0768571 , 2008.
Fu, T.-M., Jacob, D. J., Wittrock, F., Burrows, J. P., Vrek-oussis, M., and Henze, D.: Global budgets of atmospheric glyoxal and methylglyoxal, and implications for formation of secondary organic aerosols, J. Geophys. Res., 113, D15303, doi:10.1029/2007JD009505, 2008.
Ganzeveld, L. and Lelieveld, J.: Dry deposition parameterization in a chemistry general circulation model and its influence on the distribution of reactive trace gases, J. Geophys. Res., 100, 20 999–21 012, 1995.
Garc´ıa-Alonso, S., P´erez-Pastor, R., and Sevillano-Casta˜no, M. L.: Determination of glyoxal and methylglyoxal in atmospheric particulate matter by 2,4-dinitrophenylhydrazine derivatisation,
Toxicological and Environmental Chemistry, 88(3), 445–452, doi:10.1080/02772240600796837, 2006.
Garcia, A. R., Volkamer, R., Molina, L. T., Molina, M. J., Samuels-son, J., Mellqvist, J., Galle, B., Herndon, S., and Kolb, C. E.: Separation of emitted and photochemical formaldehyde in Mex-ico City using a statistical analysis and a new pair of gas-phase tracers, Atmos. Chem. Phys., 6, 4545–4557, 2006,
http://www.atmos-chem-phys.net/6/4545/2006/.
Gottwald, M., Bovensmann, H., Lichtenberg, G., Noel, S., von Bar-gen, A., Slijkhuis, S., Piters, A., Hoogeveen, R., von Savigny, C., Buchwitz, M., Kokhanovsky, A., Richter, A., Rozanov, A., Holzer-Popp, T., Bramstedt, K., Lambert, J.-C., Skupin, J., Wit-trock, F., Schrijver, H., and Burrows, J. P.: SCIAMACHY, Mon-itoring the Changing Earth’s Atmosphere, Published by DLR, 2006.
Gregg, J. W., Jones, C. G., and Dawson, T. E.: Urbanization, air pol-lution and tree growth in the vicinity of New York City, Nature, 424, 183–187, 2003.
Granier C., Guenther, A., Lamarque, J.F., Mieville, A., Muller, J. F., Olivier, J., Orlando, J., Peters, J., Petron, G., Tyndall, G., and Wallens, S.: POET, a database of surface emissions of ozone precursors, available on the internet at: http://www.aero.jussieu. fr/project/ACCENT/POET.php, 2005.
Griffin, R. J., Cocker III, D. R., Flagan, R. C., and Seinfeld, J. H.: Organic aerosol formation from oxidation of biogenic hydrocar-bons, J. Geophys. Res. 104, 3555–3567, 1999a.
Griffin, R. J., Cocker III, D. R., Seinfeld, J. H. and Dabdub, D.: Estimate of global atmospheric organic aerosol from oxidation of biogenic hydrocarbons, Geophys. Res. Lett. 26, 2721–2724, 1999b
Grosjean, E., DeAndrade, J. B., and Grosjean, D.: Carbonyl prod-ucts of the gas-phase reaction of ozone with simple alkenes, En-viron. Sci. Technol., 30, 975–983, 1996a.
Grosjean, E. and Grosjean, D.: The reaction of unsaturated aliphatic oxygenates with ozone, J. Atmos. Chem., 32, 205–232, 1999. Grosjean, D., Grosjean, E., and Gertler, A. W.: On-Road Emissions
of Carbonyls from Light-Duty and Heavy-Duty Vehicles, Envi-ron. Sci. Technol., 35, 45–53, 2001.
Guenther, A., Hewitt, C. N., Erickson, D., Fall, R., Geron, C., Graedel, T., Harley, P., Klinger, L., Lerdau, M., McKay, W. A., Pierce, T., Scholes, B., Steinbrecher, R., Tallamraju, R., Taylor, J., and Zimmerman, P.: A global model of natural volatile or-ganic compound emissions, J. Geophys. Res. 100, 8873–8892, 1995.
Guenther, A., Karl, T., Harley, P., Wiedinmyer, C., Palmer, P. I., and Geron, C.: Estimates of global terrestrial isoprene emissions using MEGAN (Model of Emissions of Gases and Aerosols from Nature), Atmos. Chem. Phys., 6, 3181–3210, 2006,
http://www.atmos-chem-phys.net/6/3181/2006/.
Hays, D. M., Geron, D. C., Linna, J. K., Smith, D. M., and Schauer, J. J.: Speciation of Gas- Phase and Fine particle emissions from burning of foliar fuels, Environ. Sci. Technol., 33, 11, 2281– 2295, doi:10.1021/es0111683, 2002.
Heald, C. L., Jacob, D. J., Park, R. J., Russell, L. M., Huebert, B. J., Seinfeld, J. H., Liao, H., and Weber, R. J.: A large organic aerosol source in the free troposphere missing from current mod-els, J. Geophys. Res. 32, L18809, doi:10.1029/2005GL023831, 2005.
Ho, S. S. H. and Yu, J. Z.: Feasibility of collection and analysis
of airborne carbonyls by on-sorbent derivatization and thermal desorption, Analytical Chemistry, 74 1232–1240, 2002. IUPAC Subcommittee on Gas Kinetic Data Evaluation for
At-mospheric Chemistry, Summary of Evaluated Kinetic and Photochemical Data for Atmospheric Chemistry, Web Ver-sion February, http://www.iupac-kinetic.ch.cam.ac.uk/summary/ IUPACsumm web Feb2006.pdf, 2006.
Jeuken, A., Veefkind, J. P., Dentener, F., Metzger, S., and Gonzalez, C. R.: Simulation of the aerosol optical depth over Europe for August 1997 and a comparison with observations, J. Geophys. Res., 106, 28 295–28 311, 2001.
Jang, M. and Kamens, R. M.: Atmospheric secondary aerosol for-mation by heterogeneous reactions of aldehydes in the presence of a sulfuric acid aerosol catalyst, Environ. Sci. Technol., 35(24), 4758–4766, 2001.
Jing, L. H., Steinberg, S. M., and Johnson, B. J.: Aldehyde and monocyclic aromatic hydrocarbon mixing ratios at an urban site in Las Vegas, Nevada, J. Air Waste Management Association, 51 1359–1366, 2001.
Sander, S.P., Ravishankara, A. R., Golden, D. M., Kolb, C. E, Kurylo, M. J., Molina, M. J., Moortgat, G. K., Finlayson-Pitts, B. J., Wine, P. H., Huie, R. E.: Chemical Kinetics and Photochemical Data for Use in Atmospheric Studies Evalua-tion Number 15, JPL PublicaEvalua-tion 06-2, available on the web at http://jpldataeval.jpl.nasa.gov/, 2006.
Kanakidou, M. and Crutzen, P. J.: The photochemical source of carbon monoxide: Importance, Uncertainties and feedbacks, Chemosphere: Global Change Science, 1, 91–109, 1999. Kanakidou, M., Seinfeld, J. H., Pandis, S. N., Barnes, I., Dentener,
F. J., Facchini, M. C., van Dingenen, R., Ervens, B., Nenes, A., Nielsen, C. J., Swietlicki, E., Putaud, J. P., Balkanski, Y., Fuzzi, S., Horth, J., Moortgat, G. K., Winterhalter, R., Myhre, C. E. L., Tsigaridis, K., Vignati, E., Stephanou, E. G., and Wilson, J.: Organic aerosols and global climate modeling: a review, Atmos. Chem. Phys., 5, 1053–1123, 2005,
http://www.atmos-chem-phys.net/5/1053/2005/.
Kawamura, K., Kasukabe, H., and Barrie, L. A.: Source and reac-tion pathways of dicarboxylic acids, ketoacids and dicarbonyls in arctic aerosols: One year of observations, Atmos. Environ., 30, 1709–1722, 1996.
Kawamura, K., Steinberg S., and Kaplan I. R.: Homologous series of C-1-C-10 monocarboxylic acids and C-1-C-6 carbonyls in Los Angeles air and motor vehicle exhausts, Atmos. Environ., 34, 4175–4191, 2000.
Kean, A. J., Grosjean, E., Grosjean, D., and Harley, R. A.: On-Road Measurement of Carbonyls in California Light-Duty Vehi-cle Emissions, Environ. Sci. Technol., 35, 4198–4204, 2001. Kroll, J. H., Ng, N. L., Murphy, S. M., Varutbangkul, V.,
Fla-gan, R. C., and Seinfeld, J. H.: Chamber studies of sec-ondary organic aerosol growth by reactive uptake of sim-ple carbonyl compounds, J. Geophys. Res., 110, D23207, doi:10.1029/2005JD006004, 2005.
Landgraf, J. and Crutzen, P. J.: An efficient method for online cal-culation of photolysis and heating rates, J. Atmos. Sci., 55, 863– 878, 1998.
Lelieveld, J., Peters, W., Dentener, F. J., and Krol, M. C.: Stability of tropospheric hydroxyl chemistry, J. Geophys. Res., 107, 4715, doi:10.1029/2002JD002272, 2002.
compounds at a rural southeastern United States site, J. Geophys. Res. – Atmos., 100, 25 933–25 944, 1995.
Liggio, J. and McLaren, R.: An optimized method for the deter-mination of volatile and semi-volatile aldehydes and ketones in ambient particulate matter, International Journal of Environmen-tal Analytical Chemistry, 83, 819-835, 2003.
Liggio, J., Li, S. M., and McLaren, R.: Heterogeneous reactions of glyoxal on particulate matter identification of acetals and sulfate esters. Environ. Sci. Technol., 39, 1532–1541, 2005a.
Liggio, J., Li, S. M., and McLaren, R.: Reactive uptake of gly-oxal by particulate matter. J. Geophys. Res., 110, D10304, doi:10310.11029/2004JD005113, 2005b.
Lim, H. J., Carlton A. G., and Turpin, B. J.: Isoprene forms sec-ondary organic aerosol through cloud processing: Model simu-lations, Environ. Sci. Technol., 39, 4441–4446, 2005.
Loeffler, K. W., Koehler, C. A., Paul, N. M., and de Haan, D. O.: Oligomer Formation in Evaporating Aqueous Glyoxal and Methyl Glyoxal Solutions, Environ. Sci. Technol., 40, 6318– 6323, 2006
Matsunaga, S., Mochida, M., and Kawamura, K.: Growth of or-ganic aerosols by biogenic semi-volatile carbonyls in the forestal atmosphere, Atmos. Environ., 37, 2045–2050, 2003.
Moortgat, G. K., Grossmann, D., Boddenberg, A., Dallmann, G., Ligon, A. P., Turner, W. V., Gab, S., Slemr, F., Wieprecht, W., Acher, K., Kilber, M., Schlomski, S., and Bachmann, K.: Hy-drogen Peroxide, Organic Peroxides and Higher Carbonyl Com-pounds Determined during the BERLIOZ Campaign, J. Atmos. Chem. 42, 443–463, 2002.
Munger, J. W., Jacob, D. J., Daube, B. C., Horowitz, L. W., Keene, W. C. and Heikes B. G.: Formaldehyde, glyoxal, and methyl-glyoxal in air and cloudwater at a rural mountain site in central Virginia, J. Geophys. Res., 100, 9325–9334, 1995.
Olivier, J., Peters, J., Granier, C., Petron, G., Muller, J. F., and Wal-lens, S.: Present and Future surface emissions of anthropogenic compounds, POET report #2, EU project EVK2-1999-00011, 2003.
Palmer, P. I., Jacob, D. J., Fiore, A. M., Martin, R. V., Chance, K., and Kurosu, T. P.: Mapping isoprene emissions over North America using formaldehyde column observations from space, J. Geophys. Res., 108(D6), 4180, doi:10.1029/2002JD002153, 2003.
Poisson, N., Kanakidou, M., and Crutzen, P. J.: Impact of Non Methane Hydrocarbons on tropospheric chemistry and particular the oxidizing power of the global troposphere: 3-Dimensional Modelling results, J. Atmos. Chem., 36, 157–230, 2000. Poisson, N., Kanakidou, M., Bonsang, B., Behmann, T., Burrows,
J., G¨olz, C., Harder, H., Lewis, A., Moortgat, G. K., Nunes, T., Pio, C., Platt, U., Sauer, F., Schuster, G., Seakins, P., Senzig, J., Seuwen, R., Trapp, D., Voltz-Thomas, A., Zenker, T., and Zitzelberger, R.: The Impact of Natural NonMethane Hydrocar-bon Oxidation on the Free Radical and Ozone budgets above a Eucalyptus forest, Chemosphere, Global Change Science, 3, 353–366, 2001.
Pope, C. A. and Dockery, D.W.: Health effects of fine particulate air pollution: Lines that connect. J Air and Waste Management Association. 54, 709–742, 2006.
Ramanathan, V. and Crutzen, P. J.: New directions: Atmospheric brown “Clouds”, Atmos. Environ., 37, 4033–4035, 2003. Saxena, P. and Hildemann, L. M.: Water-Soluble Organics in
At-mospheric Particles: A Critical Review of the Literature and Ap-plication of Thermodynamics to Identify Candidate Compounds, J. Atmos. Chem., 24, 57–109, 1996.
Saunders, S. M., Jenkin, M. E., Derwent, R. G., and Pilling, M. J.: Protocol for the development of the Master Chemical Mech-anism, MCM v3 (Part A): tropospheric degradation of non-aromatic volatile organic compounds, Atmos. Chem. Phys., 3, 161–180, 2003
Singh, H. B., Salas, L. J., Chatfield, R. B., Czech, E., Fried, A., Walega, J., Evans, M. J., Field, B. D., Jacob, D. J., Blake, D., Heikes, B., Talbot, R., Sachse, G., Crawford, J. H., Avery, M. A., Sandholm, S., and Fuelberg, H.: Analy-sis of the atmospheric distribution, sources, and sinks of oxy-genated volatile organic chemicals based on measurements over the Pacific during TRACE-P, J. Geophys. Res., 109, D15S07, doi:10.1029/2003JD003883, 2004.
Sinreich, R., Volkamer, R., Filsinger, F., Frieß, U., Kern, C., Platt, U., Sebasti´an, O., and Wagner, T.: MAX-DOAS detection of gly-oxal during ICARTT 2004, Atmos. Chem. Phys., 7, 1293–1303, 2007,
http://www.atmos-chem-phys.net/7/1293/2007/.
Shindell, D. T., Faluvegi, G., Stevenson, D. S., Emmons, L. K., Lamarque, J. F., Petron G., Dentener, F. J., Ellingsen K., Es-kes, H., and van Noije, T. P. C.: Multi-model simulations of carbon monoxide: Comparison with observations and pro-jected near-future changes, J. Geophys. Res., 111, D19306, doi:10.1029/2006JD007100, 2006.
Sorooshian, A., Lu, M. L., Brechtel, F. J., Jonsson, H., Feingold, G., Flagan, R. C., and Seinfeld, J. H.: On the source of organic acid aerosol layers above clouds, Environ. Sci. Technol., 41, 4647– 4654, 2007.
Spaulding, R. S., Schade, G. W., Goldstein, A. H., and Charles, M. J.: Characterization of secondary atmospheric photoxida-tion products: Evidents for biogenic and anthropogenic sources, J. Geophys. Res., 108 D(8), 4247 doi:10.1029/2002JD002478, 2003.
Stevenson, D. S., Dentener, F. J., Schultz, M. G., Ellingsen, K., and van Noije., T. P. C.: Multimodel ensemble simulations of present-day and near-future tropospheric ozone. J. Geophys. Res., 111, D08301, doi:10.1029/2005JD006338, 2006.
Tadic, J., Moortgat, G. K., and Wirtz, K.: Photolysis of glyoxal in air, Journal of Photochemistry and Photobiology A: Chemistry, 177, 116–124, 2006.
Tsigaridis, K. and Kanakidou, M.: Global modeling of secondary organic aerosol in the troposphere: a sensitivity analysis, Atmos. Chem. Phys. 3, 1849–1869, 2003.
Tsigaridis, K., Krol, M., Dentener, F. J., Balkanski Y., Lathiere J., Metzger S., Hauglustaine, D. A., and Kanakidou, M.: Change in global aerosol composition since preindustrial times, Atmos. Chem. Phys., 6, 5143–5162, 2006,
http://www.atmos-chem-phys.net/6/5143/2006/.
Tsigaridis, K. and Kanakidou, M.: Secondary organic aerosol im-portance in the future atmosphere, Atmos. Environ., 41, 4682– 4692, doi:10.1016/j.atmosenv.2007.03.045, 2007.
Van Noije, T. P. C., van Eskes, H. J., van Weele, M., and van Velthoven, P. F. J.: Implications of the enhanced Brewer-Dobson circulation in European Centre for Medium-Range Weather Forecasts reanalysis ERA-40 for the stratosphere-troposphere exchange of ozone in global chemistry transport models, J.