HAL Id: hal-00328598
https://hal.archives-ouvertes.fr/hal-00328598
Submitted on 9 Aug 2005
HAL is a multi-disciplinary open access
archive for the deposit and dissemination of
sci-entific research documents, whether they are
pub-lished or not. The documents may come from
teaching and research institutions in France or
abroad, or from public or private research centers.
L’archive ouverte pluridisciplinaire HAL, est
destinée au dépôt et à la diffusion de documents
scientifiques de niveau recherche, publiés ou non,
émanant des établissements d’enseignement et de
recherche français ou étrangers, des laboratoires
publics ou privés.
How tight are the limits to land and water use?
-Combined impacts of food demand and climate change
H. Lotze-Campen, W. Lucht, C. Müller, Alberte Bondeau, P. Smith
To cite this version:
H. Lotze-Campen, W. Lucht, C. Müller, Alberte Bondeau, P. Smith. How tight are the limits to land
and water use? - Combined impacts of food demand and climate change. Advances in Geosciences,
European Geosciences Union, 2005, 4, pp.28. �hal-00328598�
SRef-ID: 1680-7359/adgeo/2005-4-23 European Geosciences Union
© 2005 Author(s). This work is licensed under a Creative Commons License.
Advances in
Geosciences
How tight are the limits to land and water use? – Combined impacts
of food demand and climate change
H. Lotze-Campen1, C. M ¨uller1,2, A. Bondeau1, P. Smith1,3, and W. Lucht1
1Potsdam Institute for Climate Impact Research (PIK), 14412 Potsdam, Germany
2Max Planck Institute for Meteorology, 20146 Hamburg, Germany
3Laboratoire des Sciences du Climat et l’Environnement (LSCE), Gif-sur-Yvette, France
Received: 1 August 2004 – Revised: 1 November 2004 – Accepted: 15 November 2004 – Published: 9 August 2005
Abstract. In the coming decades, world agricultural systems
will face serious transitions. Population growth, income and lifestyle changes will lead to considerable increases in food demand. Moreover, a rising demand for renewable energy and biodiversity protection may restrict the area available for food production. On the other hand, global climate change will affect production conditions, for better or worse depend-ing on regional conditions. In order to simulate these com-bined effects consistently and in a spatially explicit way, we have linked the Lund-Potsdam-Jena Dynamic Global Vegeta-tion Model (LPJ) with a “Management model of Agricultural Production and its Impact on the Environment” (MAgPIE). LPJ represents the global biosphere with a spatial resolution of 0.5 degree. MAgPIE covers the most important agricul-tural crop and livestock production types. A prototype has been developed for one sample region. In the next stage this will be expanded to several economically relevant regions on a global scale, including international trade. The two mod-els are coupled through a layer of productivity zones. In the paper we present the modelling approach, develop first joint scenarios and discuss selected results from the coupled mod-elling system.
1 Agriculture as a crucial link between society and na-ture
Agricultural production interacts more closely than most other human activities with socio-economic and environmen-tal conditions. In economic terms the agricultural sector is losing importance over time. The share of agriculture in GDP and labour force is now below five percent in most in-dustrialised countries. These trends occur despite widerang-ing government interventions to achieve the contrary. From an environmental point of view, however, agriculture is of key importance in rich and poor countries alike. On a global
Correspondence to: H. Lotze-Campen
(lotze-campen@pik-potsdam.de)
scale, agri-cultural production accounts for about 40 percent of total land use, it uses about 70 percent of all freshwater withdrawals, affects nutrient cycles and the climate, and it is the most important driver of biodiversity loss. At the same time, environmental changes strongly influence agricultural productivity (Kendall and Pimentel, 1994). Understanding the links between food consumption, agricultural production and related environmental impacts is challenging, as socio-economic and environmental driving forces and impacts oc-cur at different spatial, temporal and thematic scales. We present a coupled modelling framework as a tool for an inte-grated environmental-economic analysis of the food system across different scales. While our scope is global in prin-ciple, for the purpose of demonstrating the viability of our concept we chose Germany as a pilot sample region.
2 Agricultural challenges in the 21st century
Whether food production will keep pace with the demand for improved diets for a rapidly growing world population is still under debate. Optimists note relatively low average crop yields, inefficiencies throughout the food production and consumption chain, and the ample reserves of poten-tial arable land in many developing countries. Sounder gov-ernment policies, wider application of green revolution tech-nology, reduced inefficiencies, upgraded rural infrastructure, and greater investments in human resources and research will make much larger harvests possible and no insurmountable environmental constraints are foreseen (Alexandratos, 1999). Pessimists point at many signs of environmental stress and increasing difficulties encountered in expanding agricultural land, water supply and crop yields, and in controlling pests. Large expansion of agricultural output may not be feasible and it seems doubtful that current levels of crop production can be sustained in a number of countries. With global warm-ing the prospects for increased food production would be-come even less favourable than they are at present (Kendall and Pimentel, 1994).
24 H. Lotze-Campen et al.: Combined impacts of food demand and climate change World population will probably grow to about 10 billion
people by the year 2100, with a median projection at 8.8 bil-lion for the year 2050 (Lutz et al., 2001). As income rises, people tend to consume more calories in total, and the share of animal calories increases, especially the consumption of animal fats. Global meat consumption can be expected to rise by up to 3 percent annually over the next decades, due to a combination of population growth, growth in percapita income and a high income elasticity of meat demand. Aver-age global meat consumption per capita could increase from 32.6 kg/year now to 44–54 kg/year in 2030 (Keyzer et al., 2001).
Even at conservatively reduced growth rates in crop yields, global food supply may still outpace demand up to 2020 and real prices for agricultural commodities are likely to continue to fall (Rosegrant and Ringler, 1997). However, the assump-tion of exponential growth paths instead of logistic curves has been questioned for projections in the very long run (Har-ris and Kennedy, 1999). The potential of biotechnology and genetic engineering for accelerating agricultural productivity growth remains unclear and subject to a strong public debate. Some initial trials show positive effects, but environmental consequences have to be further investigated and widespread social acceptance remains questionable (Qaim and Zilber-man, 2003).
The total land area available for agricultural production is determined, apart from biophysical conditions, by land requirements for other economic and environmental pur-poses. Infrastructure development and urbanisation may re-duce agricultural areas around the major population centres. In the course of a major energy transition a significant de-mand for bio-fuel production may arise, either from fast growing forests or from agricultural crops. Moreover, a cer-tain share of land may have to be set aside for biodiversity protection (Sands and Leimbach, 2003).
More intensive production systems may lead to land degra-dation. This is a very important issue in some geographic re-gions and could become a serious threat to global food sup-ply (D¨o¨os, 2002). In order to assure sufficient nutrient supsup-ply for more intensive production on a global scale, the demand for fertilizer will rise. Especially nitrogen requirements will strongly increase up to 50 percent above current consumption by 2050. The consequences for sensitive environmental sys-tems and the nitrogen cycle remain unclear (Gilland, 2002).
Water may pose the most serious limitation to future global food supplies. Irrigated areas account for nearly two-thirds of world rice and wheat production. Rising irrigation out-put per unit of land and water is essential to feed growing populations. Since the development of traditional irrigation and water supplies is increasingly expensive and new sources like desalination are not expected to play a major role soon, water savings at every level are absolutely necessary. Crop output per unit of evaporative loss has to be increased and water pollution has to be reduced. However, the size of po-tential water savings in agricultural irrigation systems is un-clear. While specific water uses can be made more efficient through better technology, the potential overall savings in
many river basins are probably much smaller, because much of the water currently lost from irrigation systems is reused elsewhere. Increasing water demand from households and industry will further exacerbate the challenge (Rosegrant and Cai, 2003). The specific water requirements for various agri-cultural products differ widely, from less than 200 litres per kg output for potatoes, sugar beets or vegetables, to more than 1000 litres per kg output for wheat and rice (Barth´elemy et al., 1993). A typical diet with meat consumption at Amer-ican levels requires about 5400 litres of water for crop evap-otranspiration, while a comparable vegetarian diet requires only about half the amount. The future global challenge with respect to agriculture and water implies that over the next 25 years food production has to be increased by about 40 per-cent while reducing the renewable water resources used in agriculture by 10–20 percent (Rijsberman, 2001).
An additional constraint to agricultural production in the second half of the 21st century is global climate change. A
rise in atmospheric CO2-levels and a corresponding rise in
global temperatures will not only affect plant growth and yields, but also alter the regional patterns of precipitation and water availability as well as land erosion and fertility. So far, sensitivity studies of world agriculture to potential cli-mate changes have indicated that global warming may have only a small overall impact on world food production be-cause reduced production and yields in some areas are offset by increases in others. However, regional impacts vary quite significantly, with tropical regions especially suffering from droughts. Moreover, the combined effects of various changes are still highly uncertain (IPCC, 2001).
3 An integrated environmental-economic modelling framework
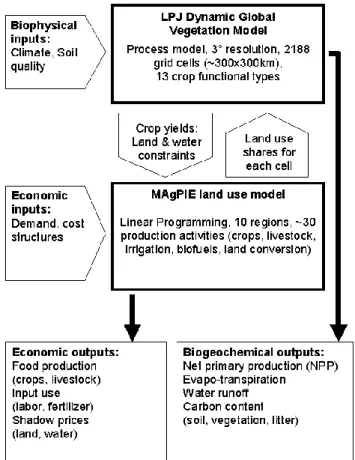
The impacts of agricultural production on natural conditions strongly depend on specific local conditions. Changes in wa-ter or nutrient cycles are related to soil conditions, wa-terrain type and local climate conditions. Hence it is necessary to link economic conditions of agricultural production to the placespecific biophysical conditions, in order to better un-derstand their interactions. The key challenge with respect to modelling is to link place-specific models of agricultural production and land use with models representing important elements of the biosphere and hydrology. Our starting point for improving the understanding of society-biosphere inter-actions is the extension of one of the most prominent models of the global biosphere – the Lund-Potsdam-Jena (LPJ) Dy-namic Global Vegetation Model. We suggest a way to inte-grate human activities into LPJ and come up with a coupled climate-biosphere-economy modelling framework, including the water cycle (Fig. 1). This is an important improvement on existing research, as LPJ endogenously models the dy-namic linkages between climate and soil conditions, water availability and plant growth. It can be used to define plau-sible biophysical constraints to agricultural production and other human activities (Sitch et al., 2003).
The global version of LPJ has a spatial resolution of 0.5 degrees, which is equivalent to a grid size of about 50×50 km at the equator. The fundamental entity simulated in LPJ is the average individual of a plant-functional type (PFT). This concept provides a simple way for process acting at the level of the plant individual to be scaled up to the “population” over a grid cell. The grid cell is treated as a mosaic divided into fractional coverages of PFTs and bare ground. LPJ sim-ulates the global terrestrial carbon pool sizes and fluxes, and captures the biogeographical distribution of Earth’s major biomes. In addition to the PFTs representing natural vegeta-tion, 13 crop functional types (CFTs) have been implemented in order to simulate potential agricultural production. These CFTs represent 8 classes of agricultural crops, e.g. temperate cereals (wheat), tropical cereals (millet), rice, maize, pulses (lentil), oil crops (sunflower, soybean, groundnut, rapeseed), roots and tubers (sugar beet, maniok), and fodder crops (C3 and C4 grass). Input data required by LPJ are monthly fields of mean temperature, precipitation and cloud cover. Standard LPJ outputs include changes in net primary production and different fractions of biomass, changes in carbon pools and water balances. Under given climate conditions, soil type and water supply, the CFTs generate crop yields in terms of aboveground biomass as well as har-vested organs. LPJ is written in C++ code.
The socio-economic part of the coupled modelling system, MAgPIE, is a linear-programming model with a focus on agricultural production, land and water use. The goal func-tion is to produce a required amount of food energy at mini-mal costs. Food demand is defined for an exogenously given population in three energy categories (crops, meat, milk). Energy can be produced with 8 cropping activities (bread grain, feed grain, oil crops, sugar crops, roots/tubers/pulses, vegetables/fruits/nuts, rice, fodder crops) and 3 livestock ac-tivities (ruminant meat, nonruminant meat, milk). Variable inputs of production are labour, chemicals, and other capital (measured in US$). Crop land, pasture and water are fixed inputs in limited supply, measured in physical units. MAg-PIE is written in Python code. Currently the two models are coupled offline by exchanging text files. Later, we will use the typed data transfer (TDT) protocol.
Currently we only look at one pilot region without exter-nal trade. The regioexter-nal demand for intermediate inputs like feed grain and green fodder has to be met by regional produc-tion. Water supply is currently defined purely by precipita-tion inflows. We abstract from groundwater reservoirs, lakes or other water storages. Water demand from production ac-tivities is calculated using fixed coefficients per unit of crop or livestock output. In order to keep the cropping mix within plausible bounds we introduce rotational constraints. Aver-age production costs are based on data from FAO and the Global Trade Analysis Project. MAgPIE output includes the shares of different crops in total food energy production and land use, purchases of variable inputs, and shadow prices for fixed inputs and other constraints. The generation of shadow prices is especially useful, as it facilitates the assignment of internal use values to factors of production for which no
Fig. 1. The coupled modelling structure.
proper markets and, hence, no observable prices exist. Several challenges have to be overcome in coupling the two models. First, thematic scales have to be matched. CFTs in LPJ, based on plantphysiological properties, have to be matched with groups of crops which provide a similar type of output for human consumption. Oil crops, for instance, com-prise a wide variety of plant species (e.g. rapeseed, ground-nuts, sunflowers, oil palms etc.), but they all deliver similar types of oil, which are almost perfectly substitutable in the processing of agricultural products. Second, temporal scales have to be made consistent. While LPJ is usually run over a period up to the year 2100, most economic forecasts do not go beyond 2020, as changes in technology and input use are very hard to predict in the longer run. Third, we have to bridge the gap between the national or regional scale in MAgPIE and the 50×50 km-grid scale in LPJ. While it is hardly possible to model economic activity on a 0.5-degree-grid for a larger region, it does not make much sense either to model environmental impacts on the aggregated national level. In order to bridge this gap, we grouped LPJ cells into a small number of “productivity zones”, according to the nor-malised level of crop yields in each grid cell.
For our sample case of Germany we have 185 grid cells grouped in 6 different zones. Effectively this means, that MAgPIE can choose among 8 cropping activities and 3 live-stock activities in 6 different zones, yielding in total 66 different production activities in the given region. We can
26 H. Lotze-Campen et al.: Combined impacts of food demand and climate change
Temperate cereal yields 1991−2000
6 7 8 9 10 11 12 13 14 48 49 50 51 52 53 54 55
yield (tons DM / ha)
6.5 7 7.5 8 8.5 9
Fig. 2. Regional distribution of potential cereal yields in Germany
in 2000 (model results).
distinguish between constraints to be fulfilled in each zone and constraints to be fulfilled at the regional level. This in-troduces aspects of trade between zones. For instance, feed grain produced in any zone is pooled across all zones and can be used in the whole region, as long as the overall balance is maintained. In contrast, green fodder has to be used locally and, hence, we impose a separate constraint for each zone. Land and water are also constrained in each zone. Having separate constraints for different zones implies that MAg-PIE generates different land use shares and shadow prices for each zone.
4 Scenarios and selected model results
Our reference scenario in this paper is the situation in Ger-many in the year 2000, defined by climate conditions, yields, the fraction of arable land and pasture in total area, and cost structures in agricultural production at this point in time. Then we look at 4 different drivers of agricultural produc-tion: a change in climate conditions as predicted for the year 2020 (“environmental change”); an increase in total food en-ergy demand by 10% (“income change”); a decrease in meat energy demand by 10% (“lifestyle change”); a decrease in
available crop land by 10% (“demand for land from energy sector”). The different impacts of these drivers can be anal-ysed separately, but here we only present the combined re-sults.
In step 1 of our analysis we run LPJ separately with each CFT in order to define potential yields for each grid cell. Fig. 2 shows yield distributions for “temperate cereals” in 2000. The map reveals significant variation in yields across the region. Currently, yields in LPJ strongly depend on pre-cipitation and less on soil conditions. This is partly due to the rather crude soil classification in the FAO soil data set used in LPJ.
In step 2 we use normalised yields for cereals and maize as the most important crops in terms of land use share, in or-der to define 6 productivity zones. In step 3 of our analysis these characteristics of zones and yields are implemented in MAgPIE, and in step 4 agricultural production and resource use are optimised for the sample region. Total food energy demand for Germany is calculated by multiplying a popula-tion of 82 million by an average daily food availability of 3411 kcal or 14 272 MJ (according to the FAO food balance sheets). More precise data on effective food intake are not available. The shares in total food energy consumption are 69% for plant-based energy, 17% for meatbased energy, and 14% for milk-based energy. With the current specification of MAgPIE, in the reference situation total food demand in Germany can be met, the self-sufficiency ratio is about 110%. Under these conditions the model leaves in the optimised so-lution about 10% of crop land and 9% of pasture unused (Ta-ble 1).
The shares of rapeseed and sugar beet in total land use are currently underestimated in the model compared to observed data. Climate change, a demand increase and reduced crop land tend to shift land use towards more feed grain and high-energy crops like sugar beets and rapeseed. Reduced meat consumption leaves room for more bread grain production. In the combined scenario some of these effects eliminate each other. The resulting shadow prices for the combined scenario show considerable variation between zones, as e.g. crop land and pasture are scarce in some zones, but not in all (Table 2). Water is not a binding constraint in any zone, i.e. the shadow price is always zero. The rotational constraint on cereals is binding in all zones, except zone 2, which is rather small in this scenario.
The fact that pasture has a higher shadow price than crop land is implausible and indicates that livestock production activities in MAgPIE have to be refined. In step 5 the land use patterns for each zone are implemented in LPJ and in step 6 the impacts on net primary production (NPP), carbon and wa-ter balances are calculated. Figure 3 shows the difference in NPP in the combined scenario compared to the reference sit-uation in 2000. Changes in NPP, water and carbon balances are dominated by climate impacts in our current scenarios, as these affect both crops and forest. Forest and unused land account for about 40 percent of the total area in Germany. It will be subject to future research, whether different cropping
Table 1. Average land use shares for Germany under various scenarios (model calculations, %).
Year 2000 Climate2020 Demand increase Reduced meat Reduced crop land Combined
Bread grain 16 11 11 21 11 13 Feed grain 50 53 55 45 55 52 Rape-seed 14 15 19 9 22 18 Sugar beet 0 0 3 0 1 0 Silage maize 10 11 12 10 11 12 Unused cropland 10 9 0 15 0 5 Unused pasture 9 1 4 9 10 1
Table 2. Regional and zone-specific shadow prices in combined
scenario (model calculations).
Zone 1 2 3 4 5 6 Regional constraints
Crop energy 17 Meat energy 852 Milk energy 526 Feed grain balance 18
Zone-specific constraints Fodder balance 14 127 12 14 11 13 Crop land 612 1288 319 213 16 0 Pasture 2800 0 2848 2819 2875 2841 Rotation cereals 291 0 319 310 301 272 Water 0 0 0 0 0 0
patterns have a significant impact on environmental indica-tors in other regions.
5 Conclusions
With the preceding analysis we have shown how a grid-based dynamic global vegetation model and a non-spatial economic optimisation model can be coupled. The preliminary results show the viability of the concept. This modelling approach can in principle be run on the small scale of a single grid cell or even a single farm as well as on the global scale. Hence, it provides the opportunity for consistent spatial aggregation and dis-aggregation and nested modelling structures. It can also be coupled to a food demand model or an economy-wide model, in order to make markets and prices for outputs and inputs endogenous. Here we will build upon recent develop-ments in the area of model coupling and meta-optimisation at PIK (Jaeger et al., 2002).
However, several caveats apply. The 0.5-degree-resolution of the current version of LPJ is appropriate on the global scale, but too coarse for the analysis of specific smaller re-gions. Crop yields and crop growth functions in LPJ have to be further evaluated. The specification of production activi-ties in MAgPIE is rather preliminary, especially the linkages between livestock and crop production, and water
require-Annual NPP: combined scenario − baseline (2000)
6 7 8 9 10 11 12 13 14 48 49 50 51 52 53 54 55 annual NPP (KgC/m2) −0.5 −0.2 −0.1 −0.04 −0.001 0.001 0.04 0.1 0.2 0.5
Fig. 3. Regional changes in Net Primary Production (NPP),
com-bined scenario compared to reference (model calculations).
ments by crops have to be refined. The linear-programming technique is powerful, flexible, and computationally very ef-ficient. However, a linear-programming model may not be robust under conditions of large structural breaks. Our cur-rent definition of productivity zones has to be reconsidered for global-scale applications.
Immediate further research steps include the definition of several economic regions and to allow for global trade in products among them. Activities of land conversion (e.g. deforestation, bio-fuel production) are also indispensable for modelling agricultural production on a global scale. A
28 H. Lotze-Campen et al.: Combined impacts of food demand and climate change dynamic version of MAgPIE would be required to model
perennial crops or forest management, and also to imple-ment manageimple-ment of stocks of natural resources. The most challenging task will be the implementation of technological change, which is crucial in the very long run. Many aspects of water and nutrient cycles are only poorly monitored and not yet well understood, but they are strongly influenced by agricultural production technologies. The model results have to be validated using satellite remote sensing and agricultural statistics.
Edited by: P. Krause, S. Kralisch, and W. Fl¨ugel Reviewed by: anonymous referees
References
Alexandratos, N.: World food and agriculture: Outlook for the medium and longer term, Proceedings of the National Academy of Sciences of the United States of America, 96 (11), 5908–5914, 1999.
Barth´elemy, F., Renault, D., and Wallender, W.: Water for a sus-tainable human nutrition: inputs and resources analysis for arid areas, UC Davis Internal report, 70 pages, 1993.
Bender, W. and Smith, M.: Population, food, and nutrition, Popula-tion Bulletin, 51 (4), 2–47, 1997.
Bender, W. H.: How much food will we need in the 21st century?, Environment, 39 (2), 7–28, 1997.
D¨o¨os, B. R.: Population growth and loss of arable land, Global Environmental Change-Human and Policy Dimensions, 12 (4), 303–311, 2002.
Gilland, B.: World population and food supply – Can food produc-tion keep pace with populaproduc-tion growth in the next half-century?, Food Policy, 27 (1), 47–63, 2002.
Harris, J. M. and Kennedy, S.: Carrying capacity in agriculture: global and regional issues, Ecological Economics, 29 (3), 443– 461, 1999.
Intergovernmental Panel on Climate Change (IPCC): Third Assess-ment Report – Climate Change 2001, 2001.
Jaeger, C. C., Leimbach, M., Carraro, C., Hasselmann, K., Hour-cade, J. C., Keeler, A., and Klein, R.: Integrated assessment mod-eling, modules for cooperation, FEEM Working Paper 53-2002, 2002.
Keyzer, M. A., Merbis, M. D., and Pavel, I. F. P. W.: Can we feed the animals? Origins and Implications of rising meat demand, Centre for World Food Studies, Amsterdam, Working paper WP-01-05, 2001.
Kindall, H. W. and Pimentel, D.: Constraints on the expansion of the global food supply, Ambio, 23 (3),198–205, 1994.
Lutz, W., Sanderson, W., and Scherbov, S.: The end of population growth, Nature, 412, 543–545, 2001.
Qaim, M. and Zilberman, D.: Yield effects of genetically modified crops in developing countries, Science, 299, 900–902, 2003. Rijsberman, F. R. and Molden, D.: Balancing water uses: water
for food and water for nature, in: Thematic background paper to the International Conference on Freshwater, Bonn, 43–56, 3–7 December 2001.
Rosegrant, M. W. and Cai, X.: Global water de-mand and supply projections. Part 2: results and prospects to 2025, Water Interna-tional, 27 (2), 170–182, 2003.
Rosegrant, M. W. and Ringler, C.: World food markets into the 21st century: environmental and resource constraints and policies, Australian Journal of Agricultural and Resource Economics, 41 (3), 401–428, 1997.
Sands, R. D. and Leimbach, M.: Modeling agriculture and land use in an integrated assessment framework, Climatic Change, 56, 185–210, 2003.
Sitch, S., Smith, B., Prentice, I. C., Arneth, A., Bondeau, A., Cramer, W., Kaplan, J., Levis, S., Lucht, W., Sykes, M., Thon-icke, K., and Venevski, S.: Evaluation of ecosystem dy-namics, plant geography and terrestrial carbon cycling in the LPJ Dy-namic Vege-tation Model, Global Change Biology, 9, 161–185, 2003.