HAL Id: tel-01376678
https://tel.archives-ouvertes.fr/tel-01376678
Submitted on 5 Oct 2016HAL is a multi-disciplinary open access archive for the deposit and dissemination of sci-entific research documents, whether they are pub-lished or not. The documents may come from teaching and research institutions in France or abroad, or from public or private research centers.
L’archive ouverte pluridisciplinaire HAL, est destinée au dépôt et à la diffusion de documents scientifiques de niveau recherche, publiés ou non, émanant des établissements d’enseignement et de recherche français ou étrangers, des laboratoires publics ou privés.
Characterization of xenobiotic substrates and inhibitors
of CYP26A1, CYP26B1 and CYP26C1 using
computational modeling and in vitro analyses
Robert Foti
To cite this version:
Robert Foti. Characterization of xenobiotic substrates and inhibitors of CYP26A1, CYP26B1 and CYP26C1 using computational modeling and in vitro analyses. Agricultural sciences. Université Nice Sophia Antipolis, 2016. English. �NNT : 2016NICE4033�. �tel-01376678�
1
Université de Nice-Sophia Antipolis
Thèse
pour obtenir le grade de
DOCTEUR DE L’UNIVERSITE NICE SOPHIA ANTIPOLIS Spécialité : Interactions Moléculaires et Cellulaires Ecole Doctorale : Sciences de la Vie et de la Santé (SVS)
Caractérisation des substrats xénobiotiques et des
inhibiteurs des cytochromes CYP26A1, CYP26B1 et CYP26C1
par modélisation moléculaire et études in vitro
présentée et soutenue publiquement par
Robert S. Foti Le 4 Juillet 2016
Membres du jury
Dr. Danièle Werck-Reichhart Rapporteur Dr. Philippe Roche Rapporteur Pr. Serge Antonczak Examinateur Dr. Philippe Breton Examinateur Pr. Philippe Diaz Examinateur Dr. Dominique Douguet Directrice de thèse
2 1. Table of Contents 1. Table of Contents ... 2 2. Acknowledgements ... 5 3. Funding Sources ... 6 4. List of Tables ... 7 5. List of Figures ... 8 6. List of Abbreviations ... 11
7. Chapter I: Introduction to Retinoic Acid Signaling and Cytochrome P450 26 ... 13
7.1. Introduction... 14
7.2. Retinoic Acid Signaling. ... 16
7.3. Cytochrome P450. ... 18
7.4. Role of CYP26. ... 20
7.5. CYP26 Pharmacology. ... 22
7.6. CYP26 Homology Modeling. ... 23
8. Aims and Scope. ... 27
9. Chapter II: Identification of Tazarotenic Acid as the First Xenobiotic Substrate of Human Retinoic Acid Hydroxylase CYP26A1 and CYP26B1 ... 30
9.1. Introduction... 31
9.2. Materials and Methods. ... 34
9.2.1. Materials. ... 34
9.2.2. Sequence Verification and Expression of CYP26B1. ... 34
9.2.3. IC50 Determination for Retinoic Acid Receptor Agonists. ... 35
9.2.4. Homology Modeling. ... 36
9.2.5. Metabolic Profiling. ... 39
9.2.6. Enzyme Kinetics. ... 39
9.2.7. Tazarotenic Acid Phenotyping. ... 40
9.2.8. LC-MS/MS Analysis. ... 40
9.2.9. Data Analysis. ... 41
9.3. Results. ... 43
9.3.1. Homology Modeling. ... 43
9.3.2. Metabolic Profile. ... 50
3
9.3.4. Tazarotenic Acid Phenotyping. ... 59
9.4. Discussion ... 61
10. Chapter III: Comparison of the Ligand Binding Site of CYP2C8 with CYP26A1 and CYP26B1: A Structural Basis for the Identification of New Inhibitors of the Retinoic Acid Hydroxylases... 67
10.1. Introduction ... 68
10.2. Materials and Methods. ... 71
10.2.1. Materials. ... 71
10.2.2. Homology Modeling and Computational Docking Simulations. ... 71
10.2.3. In Vitro Inhibition Assays. ... 72
10.2.4. Spectral Binding Determination. ... 74
10.2.5. Assessment of In Vitro Free Fraction. ... 75
10.2.6. In Vitro Stability of Candesartan Cilexetil. ... 75
10.2.7. Calculation of Cmax,u / IC50. ... 76
10.2.8. Liquid Chromatography – Mass Spectrometry Analysis. ... 77
10.3. Results ... 78
10.3.1. Evaluation of tazarotenic acid sulfoxide formation as a probe substrate of CYP26. 78 10.3.2. In Vitro Inhibition Screening and IC50 Determination. ... 80
10.3.3. Computational Docking Simulations... 87
10.3.4. Spectral Binding Studies. ... 89
10.3.5. Calculation of Cmax,u / IC50. ... 92
10.4. Discussion. ... 92
11. Chapter IV: Contribution of CYP26 to the Metabolism and Clearance of Retinoic Acid Receptor Agonists and Antagonists ... 101
11.1. Introduction. ... 102
11.2. Materials and Methods. ... 104
11.2.1. Materials. ... 104
11.2.2. In Vitro Clearance of Retinoic Acid Receptor Agonists and Antagonists by Recombinant CYP26s, CYP2C8 and CYP3A4. ... 104
11.2.3. Adapalene Phenotyping. ... 106
11.2.4. Metabolite Identification of Adapalene and Des-Adamantyl Adapalene in Recombinant CYP26s. ... 106
4
11.2.5. Computational Docking of Adapalene and Des-Adamantyl Adapalene in
CYP26A1, CYP26B1 and CYP26C1 homology models. ... 107
11.2.6. LC-MS/MS Analysis. ... 109
11.2.7. Data Analysis. ... 110
11.3. Results ... 111
11.3.1. In Vitro Clearance of Retinoic Acid Receptor Agonists and Antagonists by Recombinant CYP26s, CYP2C8 and CYP3A4. ... 111
11.3.2. Metabolite Identification of Adapalene and Des-Adamantyl Adapalene in Recombinant CYP26s. ... 115
11.3.3. Computational Docking of Adapalene and Des-Adamantyl Adapalene in CYP26A1, CYP26B1 and CYP26C1 homology models. ... 116
11.3.4. Adapalene Phenotyping. ... 121
11.4. Discussion ... 122
12. Chapter V: General Conclusions ... 128
13. References ... 140
5 2. Acknowledgements
Foremost, I would like to express my sincerest gratitude to Dr. Dominique Douguet and Dr. Philippe Diaz, whose guidance and willingness to think creatively allowed for a unique Ph.D. experience. I especially want to thank Dr. Nina Isoherranen, a true friend, colleague and mentor, for providing a continual source of personal encouragement and intellectual critique for as long as I’ve known her. I would also like to thank Dr. Larry Wienkers for stressing the importance of first-principle, hypothesis driven science and for enabling this opportunity to become a reality.
I am indebted to a multitude of professional and academic colleagues who have contributed directly or indirectly to this research over the years. Whether through generation of new reagents, assistance in designing experimental protocols or engaging in much needed coffee-chats, you have all played a key role in getting me to where I am today and for that, I thank you.
Finally, there are not enough words in the English and French languages combined to adequately describe my appreciation for the loving support, understanding and patience shown by my wife, Dr. Sally Moores, and my son, Liam Moores Foti, as I embarked on this long journey. I thank you with all of my heart for giving me the ability to pursue a dream and it is you to whom I dedicate this thesis.
6 3. Funding Sources
This research was supported in part by Amgen Inc. (Thousand Oaks, CA), l’Institut National de la Santé et de la Recherche Médicale (INSERM), the Centre National de la Recherche Scientifique (CNRS), by the National Institutes of Health National Institute of General Medical Sciences [Grants R01-GM081569, R01-GM111772], by the National Institutes of Health National Institute of Aging [Grant R41AG046987] and by a RRIA award from the Michael J. Fox Foundation for Parkinson's Research.
7 4. List of Tables
Table 9-1. Estimated parameters for CYP26A1 and CYP26B1 homology models. ... 44 Table 9-2. CYP26A1 and CYP26B1 IC50 values for retinoic acid receptor agonists and their
derivatives (95% confidence interval is shown in parentheses). ... 49 Table 9-3. Enzyme kinetic parameters for NADPH-dependent metabolism of tazarotenic acid to tazarotenic acid sulfoxide and hydroxytazarotenic acid (95% confidence interval is shown in parentheses). ... 58 Table 10-1. Previously published CYP2C8 IC50 values ± standard error. All IC50 values were
determined using recombinant CYP2C8 enzymes except where noted. (N.R. = Not Reported). ... 73 Table 10-2. Inhibition of tazarotenic acid sulfoxide formation in recombinant CYP26 enzymes by known inhibitors of retinoic acid hydroxylation. ... 79 Table 10-3. IC50 values for tazarotenic acid sulfoxide formation in recombinant CYP26 enzyme
preparations by inhibitors of CYP2C8. Values in parenthesis represent the 95% confidence intervals for the nonlinear regression analysis. ... 83 Table 10-4. Spectral binding properties for clotrimazole in recombinant CYP26A1, CYP26B1 and CYP2C8. Values in parenthesis represent the 95% confidence intervals for the nonlinear regression analysis. Standard error values are reported for fu and Ks data. ... 90 Table 10-5. Cmax,u / IC50 values for inhibitors of tazarotenic acid sulfoxidation. ... 93
Table 11-1. Estimated parameters for the CYP26C1 homology model. ... 108 Table 11-2. Percent remaining of RAR ligands at 20 min in CYP 26A1, 26B1, 26C1, 2C8 and 3A4. ... 111 Table 11-3. Intrinsic clearance parameters for RAR ligands in recombinant CYP26A1,
8 5. List of Figures
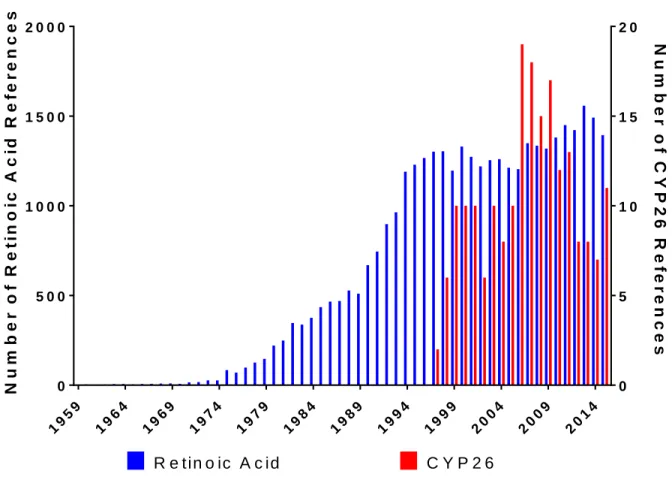
Figure 7-1. Publications related to “Retinoic Acid” or “CYP26” sorted by year. ... 15
Figure 7-2. Retinoic acid signaling pathway. ... 17
Figure 7-3. Cytochrome P450 reaction cycle. ... 19
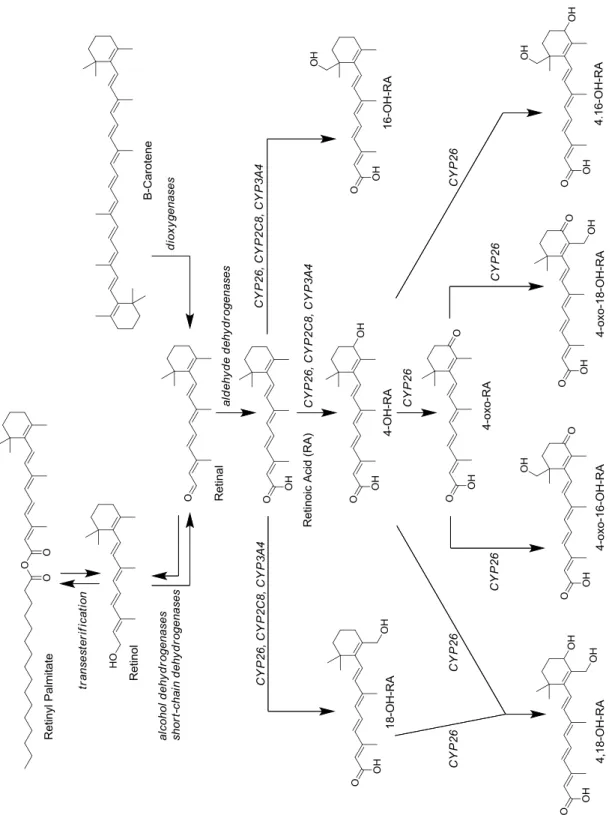
Figure 7-4. Metabolic scheme for the formation and elimination of at-RA. ... 21
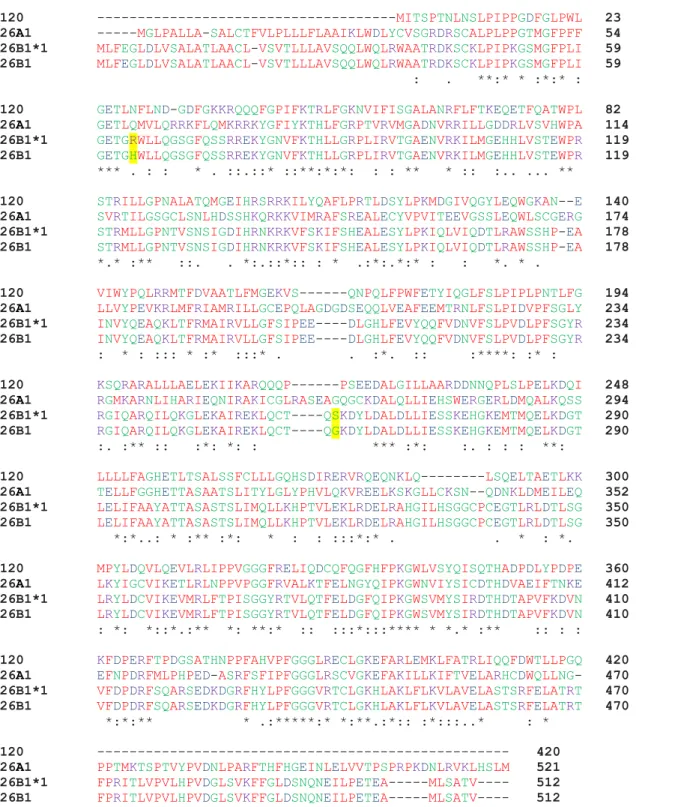
Figure 9-1. Multiple sequence alignment of CYP120, CYP26A1, CYP26B1*1 and CYP26B1 amino acid sequences. ... 37
Figure 9-2. CYP26A1 and CYP26B1 Ramachandran Plot. ... 38
Figure 9-3. Structural alignment of CYP26A1 (orange) and CYP26B1 (cyan) homology models. ... 45
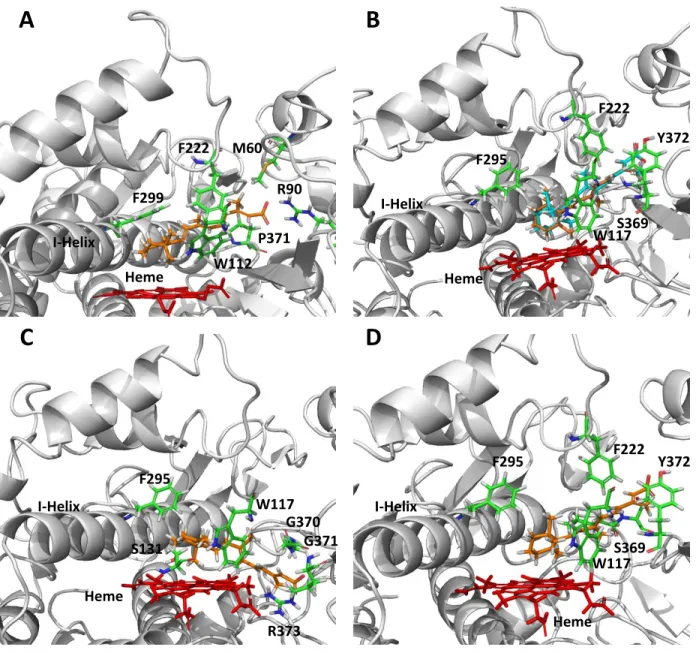
Figure 9-4. CYP26A1 (A) and CYP26B1 (B – D) homology models with at-RA docked in the active site. ... 47
Figure 9-5. Ligand interaction diagram for at-RA docked in the active site of CYP26A1 and CYP26B1. ... 48
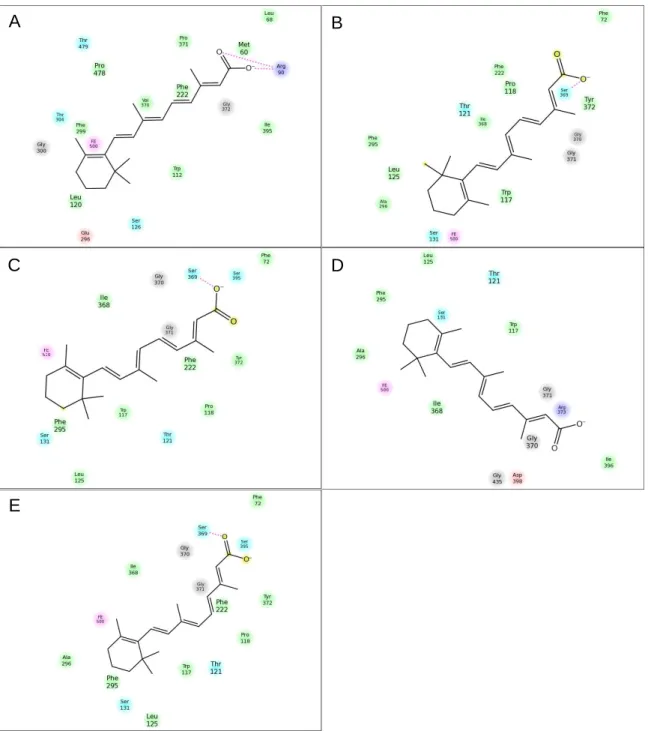
Figure 9-6. CYP26A1 and CYP26B1 homology models with tazarotenic acid docked in the active site. ... 52
Figure 9-7. Ligand interaction diagram for tazarotenic acid or tazarotenic acid sulfoxide docked in the active site of CYP26A1 and CYP26B1. ... 53
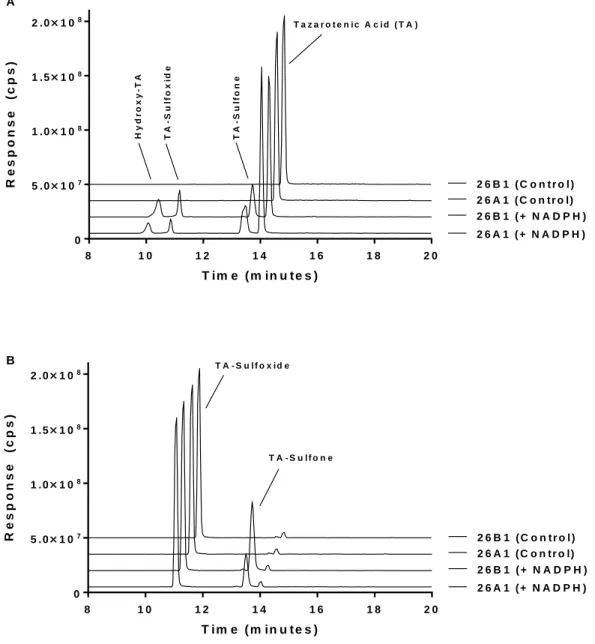
Figure 9-8. Extracted ion chromatograms for the metabolic profile of tazarotenic acid (A) and tazarotenic acid sulfoxide (B) by CYP26A1 and CYP26B1. ... 54
Figure 9-9. MRM spectra for tazarotenic acid and metabolites. ... 55
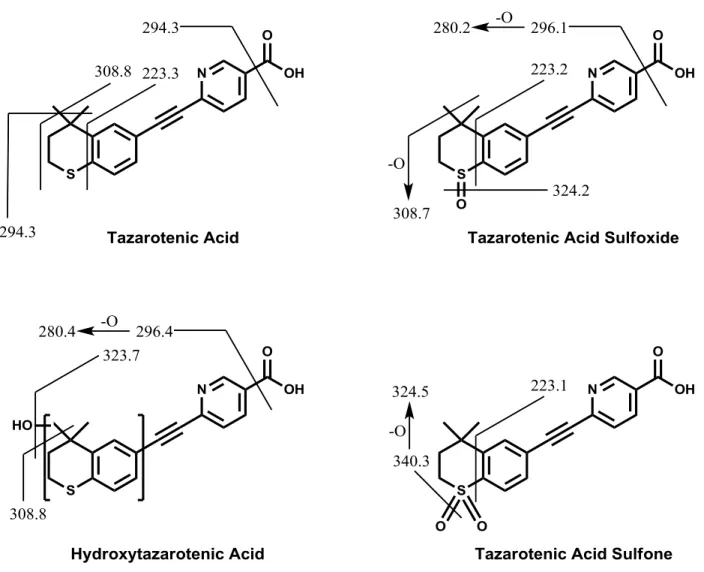
Figure 9-10. MS/MS fragmentation pattern for tazarotenic acid and metabolites. ... 56
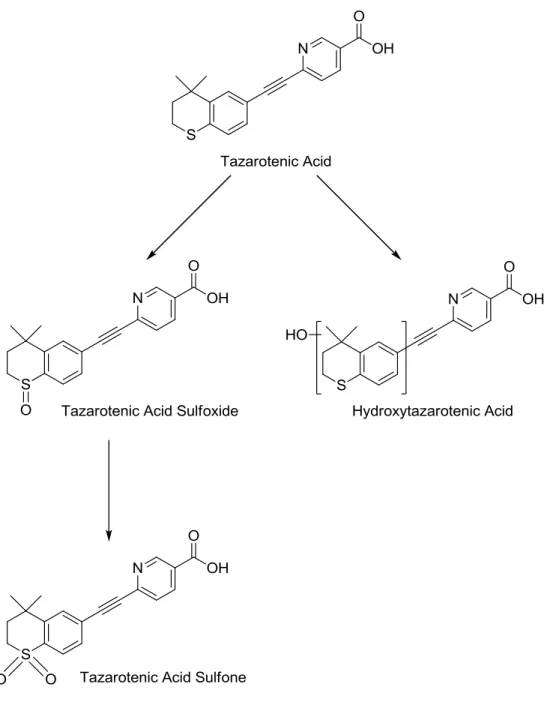
Figure 9-11. Proposed metabolic scheme of tazarotenic acid by CYP26A1 and CYP26B1. ... 57
Figure 9-12. Enzyme kinetic plots for the formation of tazarotenic acid sulfoxide and hydroxytazarotenic acid by CYP26A1 (circles) and CYP26B1 (squares). ... 58
9
Figure 9-13. Formation of tazarotenic acid sulfoxide and hydroxytazarotenic acid in a panel of recombinant enzymes. ... 60 Figure 10-1. CYP26-catalyzed metabolism of tazarotenic acid to tazarotenic acid sulfoxide. .... 78 Figure 10-2. Correlation between tazarotenic acid and 9-cis-retinoic acid derived IC50s. ... 80 Figure 10-3. Single concentration (10 µM) inhibition screen using tazarotenic acid as a probe substrate of CYP26 activity. ... 82 Figure 10-4. In vitro IC50 curves for select CYP26A1 or CYP26B1 inhibitors using tazarotenic
acid as a probe substrate. ... 84 Figure 10-5. Stability of candesartan cilexetil in recombinant CYP26A1, CYP26B1 and CYP2C8 enzymes. ... 85 Figure 10-6. Correlation Between IC50 Values for CYP2C8 and CYP26A1 or CYP26B1. ... 86
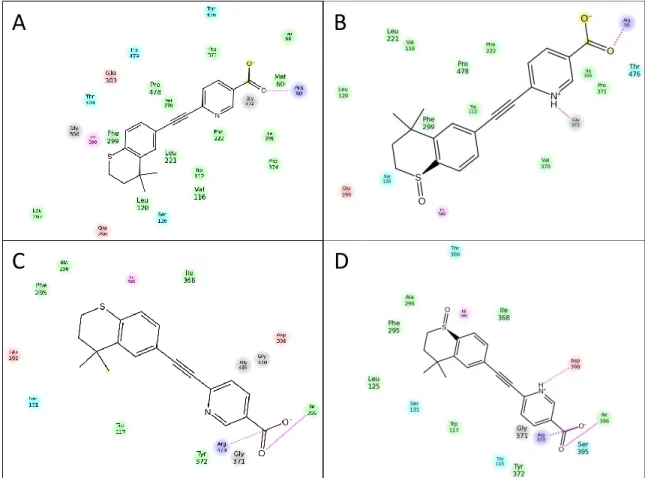
Figure 10-7. Computational Docking of Clotrimazole, Zafirlukast and Candesartan Cilexitil into CYP26 Homology Models. ... 88 Figure 10-8. Spectral binding results for clotrimazole with recombinantly expressed CYP26A1, CYP26B1 or CYP2C8. ... 91 Figure 11-1. Retinoic acid receptor agonists and antagonists included in intrinsic clearance experiments in recombinant CYP26A1, CYP26B1, CYP26C1, CYP2C8 and CYP3A4. ... 105 Figure 11-2. CYP26C1 Ramachandran Plot. ... 108 Figure 11-3. Depletion rates of retinoic acid receptor agonists and antagonists in recombinant CYP26A1, CYP26B1 and CYP26C1. ... 113 Figure 11-4. Metabolite formation rates of retinoic acid receptor agonists and antagonists 1n recombinant CYP26A1, CYP26B1 and CYP26C1... 114 Figure 11-5. Metabolite elucidation of adapalene in recombinant CYP26C1. ... 115 Figure 11-6. Assessment of des-adamantyl adapalene metabolite formation in recombinant CYP26C1. ... 116
10
Figure 11-7. Characterization of the active site of the CYP26C1 homology model. ... 118 Figure 11-8. CYP26C1 homology model with at-RA docked in the active site. ... 118 Figure 11-9. CYP26A1, CYP26B1 and CYP26C1 homology models with adapalene and des-adamantyl adapalene docked in the active site. ... 120 Figure 11-10. Formation of hydroxylated adapalene by recombinant drug metabolizing
11 6. List of Abbreviations
ADME Absorption, distribution, metabolism, excretion
at-RA all trans-retinoic acid Clint In vitro intrinsic clearance
Cmax Maximum drug concentration
Cmax,u Maximum unbound drug concentration
CYP Cytochrome P450
FMO Flavin containing monooxygenase Ks,u Unbound spectral binding constant
LC-MS/MS Liquid chromatography-tandem mass spectrometry NADPH Nicotinamide adenine dinucleotide phosphate, reduced PCR Polymerase chain reaction
RAMBA Retinoic Acid Metabolism Blocking Agent RAR Retinoic acid receptor
RMSD Root-mean-square deviation RXR Retinoid X receptor
12
Sous-titre de la thèse Rôle des CYP26s dans la métabolisation des medicaments
Mots-clés CYP26A1, CYP26B1, CYP26C1, modélisation par homologie, acide rétinoïque, acide tazaroténique, adapalène, interactions protéine-ligand
En l’absence de structures tridimensionnelles expérimentales des cytochromes P450 CYP26A1, CYP26B1 et CYP26C1, la caractérisation de leur substrats et ligands s’est basée sur l’analyse des modèles structuraux obtenus par modélisation par homologie avec la structure expérimentale du cytochrome P450 CYP120. La justesse des modèles a été validée par l’amarrage de l’acide rétinoïque all-trans dans des configurations compatibles avec les métabolites attendus. L’amarrage d’agonistes et d’antagonistes des récepteurs nucléaires RARs prédirent l’acide tazaroténique (TA) et l’adapalène comme des substrats potentiels. Les expériences in vitro confirmèrent la métabolisation de ces 2 médicaments par les CYP26s. L’analyse de la cinétique de sulfoxidation du TA par CYP26A1 and CYP26B1 a permis d’établir le TA comme la référence contrôle de l’activité de ces enzymes. Puis, la comparaison des modèles des CYP26s avec la structure cristalline de CYP2C8 a permis d’identifier des similarités structurales de leurs inhibiteurs. Une corrélation entre l’inhibition de CYP26A1 et de CYP2C8 par des inhibiteurs connus de CYP2C8 a été démontrée après détermination de leurs IC50 pour CYP26A1 et CYP26B1 en utilisant le TA comme substrat de référence. La mesure de l’inhibition in vitro fut ensuite utilisée pour évaluer la possibilité que les CYP26s soient impliquées dans des interactions médicamenteuses observées pour certaines molécules. Cette thèse caractérise et appuie le rôle encore mal connu des CYP26s dans la métabolisation in vivo de certains xénobiotiques ainsi que l’effet potentiel de leur inhibition qui favoriserait la survenue d'effets indésirables.
13
14 7.1. Introduction.
Cytochrome P450 26A1 (CYP26A1), B1 (CYP26B1) and C1 (CYP26C1) are enzymes belonging to the cytochrome P450 superfamily of drug metabolizing enzymes that catalyze the metabolism of all-trans retinoic acid (at-RA) and related structural isomers. Scientific interest in retinoic acid began to increase in the 1970s, while the study of the role of CYP26 in retinoic acid homeostasis began in the late 1990s (Figure 7-1). As no crystal structures for any of the CYP26 isoforms have been solved to date, the majority of the structural characterization efforts for the enzyme subfamily have utilized a computational approach. Further, while the catalysis of
at-RA and related endogenous substrates has been the core of many robust scientific
endeavors, the role of the enzymes in the metabolism of xenobiotic compounds and the inhibition of the enzymes by compounds other than retinoid-like molecules remains an area of considerable scientific focus.
The research presented in this thesis examined the metabolism and inhibition properties of CYP26 by xenobiotic compounds. Homology models were designed for each isoform and initially validated using the known metabolic profile of at-RA. Structural comparison of the active sites of the isoforms suggested similar hydrophobic binding regions proximal to the heme iron with differences in the amino acid residues distal to the heme and capable of stabilizing interactions with carboxylate moieties. Active site volumes for CYP26A1, CYP26B1 and CYP26C1 were estimated at 918 Å3, 977 Å3 and 1090 Å3, respectively, suggesting the ability of each of the enzymes to accommodate the molecular volumes of typical xenobiotic ligands. As such, the models were utilized to assess the active site characteristics of each CYP26 isoform that are essential in describing their ligand binding abilities. Based on homology model results, tazarotenic acid, adapalene and other retinoic acid receptor ligands were identified as metabolic substrates of CYP26.
15
Figure 7-1. Publications related to “Retinoic Acid” or “CYP26” sorted by year.
A comparison of the ligand binding characteristics of CYP26 and CYP2C8 pointed to a potential overlap between the inhibitory pharmacophores of the enzymes. Indeed, when a set of known CYP2C8 inhibitors was screened for their ability to inhibit CYP26A1 or CYP26B1, a correlation was observed between the inhibitory potencies (IC50) for CYP2C8 and CYP26A1 (r2 = 0.849), with clotrimazole being identified as a very potent inhibitor of both CYP26A1 and CYP26B1. In the process, the use of tazarotenic acid sulfoxidation as a probe reaction for CYP26 activity in recombinantly expressed single enzyme systems was verified. A cursory evaluation of the unbound Cmax concentrations and the IC50 values of the inhibitors in the screening set suggested the possibility for compounds such as clotrimazole or fluconazole to be involved in clinically-relevant drug interactions that involve CYP26.
19 59 19 64 19 69 19 74 19 79 19 84 19 89 19 94 19 99 20 04 20 09 20 14 0 5 0 0 1 0 0 0 1 5 0 0 2 0 0 0 0 5 1 0 1 5 2 0 N u m b e r o f R e ti n o ic A c id R e fe r e n c e s N u m b e r o f C Y P 2 6 R e fe r e n c e s R e tin o ic A c id C Y P 2 6
16
Collectively, the data presented in this thesis supports a significant role for CYP26 in both the metabolism of xenobiotics as well as xenobiotic drug interactions. To date, one manuscript is in press and has been highlighted on the cover of the Journal of Pharmacology and Experimental Therapeutics (see Chapter II) and a second manuscript is currently under peer review (see Chapter III). Future evaluations of the active site characteristics of CYP26A1, CYP26B1 and CYP26C1 that are integral to defining their substrate binding characteristics will increase the potential of identifying CYP26-selective inhibitors and may ultimately prove useful for the treatment of various disease states while increasing patient safety in regard to modulation of CYP26 activity in vivo.
7.2. Retinoic Acid Signaling.
The homeostatic control of endogenous retinoic acid concentrations is a highly conserved process because of its global role in the cellular lifecycle (Lotan, 1980; Sporn and Roberts, 1984; McCaffery and Drager, 2000; Ross et al., 2000; Clagett-Dame and DeLuca, 2002; Maden, 2002). In humans, retinoic acid exerts its mechanism of action by binding to the retinoic acid and retinoid X receptors, regulating the expression of genes that are directly involved in cellular proliferation, differentiation and apoptotic processes (Figure 7-2) (Levin et al., 1992; Mangelsdorf et al., 1992; Mark et al., 2006; Altucci et al., 2007; di Masi et al., 2015). Ligand-bound retinoic acid and retinoid X receptors form a heterodimeric protein complex which subsequently binds to retinoic acid response element to elicit a physiological response (Giguere et al., 1987; Petkovich et al., 1987; Brand et al., 1988; Duester, 2008; Niederreither and Dolle, 2008). Endogenous ligands for the retinoic acid receptors include all trans-retinoic acid (at-RA), 9-cis-RA and 13-cis-RA. Additional evidence suggests that cellular retinoic acid binding proteins (CRABP-I and CRABP-II) are responsible for the facilitation and transport of retinoic acid with its cellular receptors (Fiorella and Napoli, 1991; Giguere, 1994; Noy, 2000).
17
Physiologically, retinoic acid signaling plays a key role in immune function, brain activity, spermatogenesis, dermatological regulation and organ development (Ransom et al., 2014; Cunningham and Duester, 2015). Significant changes to circulating concentrations of retinoic acid are also known to factor into the onset or alleviation of various disease states (Miller, 1998; Kuenzli and Saurat, 2001; Njar, 2002; Ahmad and Mukhtar, 2004; Njar et al., 2006; Verfaille et al., 2008).
18 7.3. Cytochrome P450.
The cytochrome P450s are a superfamily of heme-containing enzymes that are responsible for the oxidation or reduction of the majority of drugs currently in use (Ortiz de Montellano and De Voss, 2002). The superfamily is comprised of over 57 individual enzymes in humans, though the major isoforms believed to be involved in drug metabolism are generally limited to CYP1A1, CYP1A2, CYP2B6, CYP2C8, CYP2C9, CYP2C19, CYP2D6, CYP2E1, CYP3A4 and CYP3A5 (Guengerich, 2005). Cytochrome P450s are predominantly localized to the endoplasmic reticulum of liver, intestinal, lung, kidney, brain and nasal mucosa cells (Ding and Kaminsky, 2003). Cytochrome P450 isoforms involved in homeostatic processes include CYP4B1, CYP4F2, CYP4F12, CYP17A1, CYP19A1, CYP26 (A1, B1 and C1) and CYP46A1, in addition to many others. They require the transfer of electrons from NADPH for catalytic activity, a process which occurs through interactions with multiple redox partners such as cytochrome P450 reductase and cytochrome b5 (Iyanagi and Mason, 1973; Vermilion and Coon, 1978; Vermilion et al., 1981; Schenkman and Jansson, 1999). An abbreviated reaction cycle is shown in Figure 7-3.
From a protein conformation standpoint, the overall structure of cytochrome P450 isoforms is relatively conserved across the family and appears designed specifically for catalyzing heme-thiolate reactions, interactions with cytochrome P450 reductase and cytochrome b5 and binding of endogenous and exogenous ligands (Poulous and Johnson, 2005). In general, structural conservation across family members increases as one is closer to the heme, and the I-helix of the different P450s is often used as a point of orientation in P450 modeling and crystal structures. Eukaryotic P450s are primarily membrane bound and located in the endoplasmic reticulum, with an N-terminal polypeptide chain responsible for anchoring the protein in the membrane (von Wachenfeldt et al., 1997; Cosme and Johnson, 2000; McDougle et al., 2013).
19
ligands, the inhibition of cytochrome P450 isoforms plays an important role in both the regulation of homeostatic functions as well as in clinical drug interactions. Inhibition of cytochrome P450 can be reversible (competitive, noncompetitive or mixed inhibition) or irreversible (mechanism-based inhibition) (Blobaum, 2006; Foti et al., 2010). The mechanism of inhibition can also be characterized by the interactions between the ligand and the heme iron. Of particular note is the type II interaction that is often observed for compounds such as anti-fungal compounds and select retinoids or retinoic acid metabolizing blocking agents, many of which contain an sp2 hybridized nitrogen capable of coordinating the heme iron. Owing to the tendency of the heme-thiolate bond to stretch depending on the type of ligand interaction and the resulting change in the spin state of the heme iron, such interactions can be characterized through the use of various spectroscopic techniques (Schenkman and Jansson, 2006).
Figure 7-3. Cytochrome P450 reaction cycle.
+H
+-H
2O
H
+RH
Fe
3+Fe
3+RH
Fe
3+ROH
Fe
2+RH
Fe
2+-O
2RH
Fe
2+-OOH RH
FeO
3+RH
FeO
3+R
•
e
-O
2e
-Fe
2+-O
2-RH
ROH
NADPH
NADP+
FAD
FADH
2FMNH
2FMN
Cytochrome P450 Reductase Cytochrome P450 Reductase or b5 Cytochrome P450 Reaction Cycle20 7.4. Role of CYP26.
Endogenous control of retinoic acid occurs through increasing or decreasing its rate of synthesis, which can take place through the modulation of a number of catalytic processes through which retinol is converted to all-trans-retinoic acid (at-RA) or through altering the elimination or metabolism of retinoic acid, which occurs through oxidative metabolism catalyzed by cytochrome P450 enzymes, which are responsible for the oxidative metabolism of both drugs and endogenous substances (Figure 7-4) (Nelson, 2006; Duester, 2008; Niederreither and Dolle, 2008; Zanger and Schwab, 2013). A subfamily within the cytochrome P450s, CYP26 (CYP26A1, CYP26B1 and CYP26C1) is primarily responsible for the oxidative metabolism of retinoic acid (Ray et al., 1997; Lutz et al., 2009; Thatcher and Isoherranen, 2009; Thatcher et al., 2010; Ross and Zolfaghari, 2011). CYP26A1 and CYP26B1 are the two most widely studied isozymes within the CYP26 family, with less known about the homeostatic and pharmacological significance of CYP26C1. Similar to the channeling pathways reported for the retinoic acid and retinoid X receptors, CRABPs are also thought to be involved in the transport of retinoic acid to CYP26 to facilitate metabolism (Nelson et al., 2013b). The expression of both CYP26A1 and CYP26B1 have also been shown to be induced by retinoic acid, representing a major hurdle in the use of retinoic acid as a pharmacological intervention (Muindi et al., 1992; van der Leede et al., 1997; Wang et al., 2002; Wang et al., 2009).
Quantitatively, CYP26 expression in the liver is primarily comprised of CYP26A1, with minimal amounts of hepatic CYP26B1 being present (Xi and Yang, 2008; Thatcher and Isoherranen, 2009; Thatcher et al., 2010; Topletz et al., 2012). The highest levels of CYP26B1 mRNA expression have been identified in the adult brain (White et al., 2000; Thatcher and Isoherranen, 2009; Topletz et al., 2012). Extra-hepatically, both isozymes are ubiquitously expressed, with corresponding mRNA having been identified in skin, kidney, testes and lung (CYP26A1) or skin, lung, testes, placenta, ovaries and intestine (Ray et al., 1997; White et al.,
21
2000; Wang et al., 2002; Xi and Yang, 2008; Tay et al., 2010; Thatcher et al., 2010; Osanai and Lee, 2011; Topletz et al., 2012; Nelson et al., 2013a).
22
The evolutionary importance of regulating endogenous retinoic acid concentrations is consistent with the functional overlap of CYP26A1 and CYP26B1, though interestingly the two isoforms share only a 42 – 44% sequence homology (Taimi et al., 2004; Topletz et al., 2012). Knowledge of the metabolic ligand profiles of each enzyme is relatively sparse, with in-depth characterizations limited to retinoic acid isomers and structurally-related metabolites (White et al., 1996; Sonneveld et al., 1998; White et al., 2000; Taimi et al., 2004; Thatcher et al., 2010; Ross and Zolfaghari, 2011; Topletz et al., 2012; Topletz et al., 2014). Previous reports indicated that the greatest catalytic efficiency is observed when all trans-retinoic acid (at-RA) is bound in the active site, though additional evidence suggests that CYP26A1, CYP26B1 and CYP26C1 are also able to catalyze the oxidative metabolism of other retinoic acid stereoisomers and structurally similar conformers. (White et al., 1996; White et al., 2000; Taimi et al., 2004; Ross and Zolfaghari, 2011). CYP26A1 and CYP26B1 are capable of catalyzing multiple steps in the metabolic clearance of at-RA (Figure 7-4), with roles in the sequential metabolism of 4-hydroxy-at-RA, 4-oxo-at-RA and 18-hydroxy-at-RA (Lutz et al., 2009; Shimshoni et al., 2012; Topletz et al., 2012; Topletz et al., 2014).
7.5. CYP26 Pharmacology.
Given the role of CYP26A1 and CYP26B1 in the endogenous control of retinoic acid concentrations in vivo, the identification of selective chemical inhibitors of the enzymes has been evaluated as a potential therapeutic approach in both inflammatory and oncological-related disease states (Miller, 1998; Kuenzli and Saurat, 2001; Njar, 2002; Ahmad and Mukhtar, 2004; Njar et al., 2006; Verfaille et al., 2008). Initial attempts to identify inhibitors of CYP26A1 or CYP26B1 resulted in the synthesis and characterization of retinoic acid metabolism blocking agents (RAMBAs). The majority of known RAMBAs share a conserved pharmacophore, with a bridging hydrophobic tether that couples a hydrophobic or aromatic functional group to a
23
hydrogen bond acceptor, an observation which can be exploited to both characterize the active site binding characteristics of the enzymes as well as to design new inhibitors of the enzymes (Purushottamachar et al., 2012; Sun et al., 2015). Often, the hydrophobic functional group is an azole-type moiety, integrated into the molecule to take advantage of a type II binding mechanism with the heme iron of CYP26A1 or CYP26B1, resulting in inhibition of the enzymes (Njar, 2002; Njar et al., 2006; Gomaa et al., 2008; Gomaa et al., 2011a; Thatcher et al., 2011; Nelson et al., 2013a).
Various structural analogs of retinoic acid, commonly referred to as retinoic acid receptor agonists or antagonists depending on their specific regulatory function, are also being pursued as therapeutic interventions across different therapeutic areas, including oncology, dermatology and regenerative medicine (Charpentier et al., 1995; Gudas and Wagner, 2011; di Masi et al., 2015). Often, the understanding of the adsorption, distribution, metabolism and excretion characteristics of these compounds is limited. However, the identification of these compounds has led to the evaluation of CYP26 as a potential drug target, as many of these compounds also have inhibitory activity against CYP26A1 or CYP26B1 (Thatcher et al., 2011).
7.6. CYP26 Homology Modeling.
Characterization of the three-dimensional structure of a protein and, perhaps more importantly, its ligand binding regions can prove crucial to understanding the biological functions of a given drug target or metabolic enzyme. Though a definitive assessment of a protein’s structure generally relies on experimentally-determined structural data, the prediction of the protein’s structure through homology modeling can also prove valuable in understanding the structural features which contribute to its ligand binding characteristics and biological mechanism of action (Hillisch et al., 2004; Cavasotto and Phatak, 2009). A homology modeling approach aims to develop a computationally derived three-dimensional model for a protein with
24
an unknown structure based on its similarity to other proteins with experimentally determined structures (Lesk and Chothia, 1986; Murzin, 2001; John and Sali, 2003; Zhang, 2008). The success of such an approach relies heavily on the degree of similarity between the two proteins as well as the generation of a correct sequence alignment between the two protein sequences (Khan et al., 2016). The data generated through the use of a homology model can be used to identify endogenous substrates or rationally design new xenobiotic ligands for the protein of interest, whose observed binding properties in the active site of the protein can then be used to further refine the model (Hillisch et al., 2004).
The first step in developing a homology model is the selection of a template protein with a known three dimensional structure and high degree of sequence similarity to the target protein with unknown structure using either comparative sequence assessment, multiple sequence assessments such as hidden Markov models and intermediate sequence searches for secondary structure prediction and fold recognition or a threaded template matching approach (Berman et al., 2000; Westbrook et al., 2002; Saxena et al., 2013). In general, a template structure with 30% or greater structural similarity to the target protein can provide the basis for a reliable homology model (Khan et al., 2016). After identification of an appropriate template, the two protein sequences must be aligned in such a manner to provide the greatest degree of sequence alignment, using either dynamic programming algorithms designed to take a relatively insensitive approach to aligning two sequences or a more complex approach where the target sequence is aligned to the protein sequences of multiple related proteins or where position specific information is incorporated into the sequence alignment (Sanchez and Sali, 1997a; Sanchez and Sali, 1997b). The latter approach becomes necessary for two proteins with less than optimal degrees of structural similarity (Xu et al., 1996; John and Sali, 2003).
Upon achievement of an acceptable degree of sequence alignment, a number of computational approaches are available with which to design and optimize the resulting homology model. Perhaps the most widely used approach is model assembly using a subset of
25
rigid protein sequences that are derived from the overall target sequence (Browne et al., 1969; Blundell et al., 1987; Greer, 1990; Blundell et al., 2006). A common approach to sub-dividing the protein sequence involves individually modeling the core backbone regions of the protein, followed by connecting variable loops and ultimately optimizing the individual amino acid side chains (Saxena et al., 2013). Additional approaches include coordinate reconstruction, where the segmentation of the target protein into hexapeptide segments leads to the ultimate structural assignments, spatial restraint modelling, where geometrical deviations from the template structure using a set of pre-defined spatial restraints are minimized, or loop modeling, used to define flexible regions in a protein structure (generally less than eight amino acid residues) based on known libraries and conformational searching or energy-based approaches (Krieger et al., 2003; Saxena et al., 2013).
Model optimization follows the initial model design. Owing to the dynamic interplay between the predicted structure of the backbone core regions and the geometry of the individual side chains, an iterative approach is often utilized where the effects of energy minimization of the side chains on the backbone and vice-versa are taken into account over multiple cycles until the entire model eventually converges into a global energy minimum (Krieger et al., 2003). In general, the energy minimization step is achieved by using either classical molecular dynamics or quantum force fields, which incorporate the positions of each atomic nucleus as well as the inherent charge distribution and treat the overall protein as a sum of the individual amino acids or a self-parameterizing force field, which build upon the aforementioned force fields by randomly changing a given parameter such as van der Waals radii and reminimizing the model to determine if an improvement in the model was obtained (Liu et al., 2001; Krieger et al., 2002). The final step in homology modeling is the validation of the model, which identifies errors inherent to all homology models. As homology modeling is an inherently iterative process, errors in model design are easily propagated and can result in serious deficiencies in the final model design. Commonly observed errors include sequence misalignments, incorrectly
26
assigned geographical sequences of the target protein, unacceptable side-chain conformations and abnormal bond lengths or angles (Morris et al., 1992; Czaplewski et al., 2000; Czaplewski et al., 2003; Krieger et al., 2003; Saxena et al., 2013). Validation of the model can involve the entire model or distinct subdivided regions of the model, with each approach generating scoring functions that evaluate template alignment, protein stereochemistry and protein misfolding, in addition to a plentitude of other parameters (Sippl, 1995; Hooft et al., 1996; Marti-Renom et al., 2000; Hillisch et al., 2004). The scoring functions can generally be divided into either statistical-based or physical-statistical-based energy functions (Sippl, 1995; Lazaridis and Karplus, 1999; Al-Lazikani et al., 2001; Xiang, 2006). The former scoring functions incorporate the well-characterized properties of amino acids in a given structure while the latter is based on calculating the conformational free energy of the overall protein structure (Xiang, 2006).
The homology models presented in this body of work were designed and validated using Prime (Schrodinger LLC, New York). Within Prime, structural alignments are calculated using both the overall sequence of the target and template proteins as well as the secondary structure of each protein (Nayeem et al., 2006). Contributions from protein structure, docked ligands, solvent and multiple force fields are combined to build the model using aligned atom positions. Nonaligned sequences between the target and template protein structures are calculated using solvation energies and ab initio approaches (Jacobson et al., 2004). The simulations utilize the commonly used OPLS (Optimized Potential for Liquid Simulations) force field, developed by William Jorgensen (Jorgensen and Tirado-Rives, 1988). The force field incorporates bonds and angles from known x-ray crystal structures, ab initio calculated dihedral angles, calculated partial charges from the equilibrated protein conformation and van der Waals parameters which account for solvent interactions (Weiner et al., 1984; Jorgensen and Tirado-Rives, 1988; Kaminski et al., 1994; Jorgensen et al., 1996; Mackerell, 2004; Jorgensen and Tirado-Rives, 2005).
27
With respect to the structural characteristics of the cytochrome P450 family of drug metabolizing enzymes, their relatively flexible and lipophilic active sites can often pose a challenge in regard to accurately simulating the binding of a substrate within the active site and subsequently predicting the preferred site of metabolism (Williams et al., 2000; Lewis, 2002; Eksterowicz et al., 2014). As no crystal structures currently exist, multiple CYP26A1 or CYP26B1 homology models are currently available, the majority of which have been used to characterize the ability of CYP26A1 to stereoselectively catalyze the formation of 4-(S)-OH-at-RA or to investigate the ligand site interactions of azole-based inhibitors of CYP26A1 or CYP26B1 which are designed to coordinate to the heme iron and whose conformation in the active site can be confirmed through various spectral analyses (Gomaa et al., 2006; Gomaa et al., 2008; Karlsson et al., 2008; Ren et al., 2008; Gomaa et al., 2011a; Gomaa et al., 2011b; Shimshoni et al., 2012; Sun et al., 2015).
8. Aims and Scope.
The use of a homology model approach to identifying xenobiotic molecules which are capable of being metabolized by the CYP26 family of drug metabolizing enzymes is currently undefined and serves as the basis of the work presented in this thesis. Homology models of CYP26A1, CYP26B1 and CYP26C1 were designed and utilized to compare the structural characteristics of each enzyme, especially in regard to active site architecture. The models were validated through docking simulations with at-RA and subsequently utilized to identify and characterize tazarotenic acid as the first known xenobiotic substrate of CYP26. Similar to earlier homology models, structural assessment of the models suggested active site similarities with CYP2C8, another cytochrome P450 isozyme capable of metabolizing at-RA (see Chapter II). Tazarotenic acid was used as an in vitro probe of CYP26A1 or CYP26B1 activity to determine the inhibitory potency of set of known CYP2C8 inhibitors against CYP26 activity and the models applied to propose binding orientations for the most potent inhibitors (see Chapter
28
III). Ultimately, in vitro inhibition properties were extrapolated to predicted in vivo outcomes in order to determine the ability of select CYP2C8 inhibitors to cause clinically meaningful drug interactions through inhibition of CYP26 activity. Finally, the role of CYP26A1, CYP26B1 and CYP26C1 in the metabolism of additional retinoic acid agonists or antagonists was evaluated using in vitro experiments and computational modeling (see Chapter IV). The metabolism of adapalene by CYP26 was evaluated and used to determine the ability of the CYP26 enzymes to alter the preferred sites of metabolism in response to sterically-hindering functional groups. Taken in their entirety, the results presented herein provide the basis for a significant role for the CYP26 family of drug metabolizing enzymes both in the metabolism of xenobiotic compounds as well as in the potential for clinical drug interactions through inhibition of CYP26-mediated catalytic pathways.
30
9. Chapter II: Identification of Tazarotenic Acid as the First Xenobiotic Substrate of Human Retinoic Acid Hydroxylase CYP26A1 and CYP26B1
Accepted for Publication: Journal of Pharmacology and Experimental Therapeutics, 2016. Highlighted as Cover Art in May 2016 Issue
31 9.1. Introduction.
Cytochrome P450 26A1 and 26B1 are members of the cytochrome P450 superfamily of heme-containing enzymes that are responsible for the metabolism of retinoic acid (Ray et al., 1997; Guengerich, 2006; Lutz et al., 2009; Thatcher and Isoherranen, 2009; Ross and Zolfaghari, 2011). In addition to metabolizing retinoic acid, both CYP26A1 and CYP26B1 are induced by retinoic acid (Muindi et al., 1992; van der Leede et al., 1997; Wang et al., 2002; Wang et al., 2009). The two enzymes are widely expressed throughout the adult human body, though CYP26A1 is the primary isoform expressed in the adult liver, with little to no hepatic expression of CYP26B1 observed (Xi and Yang, 2008; Thatcher and Isoherranen, 2009; Thatcher et al., 2010; Topletz et al., 2012). CYP26B1 mRNA expression has been reported to be the highest in the adult brain (White et al., 2000; Thatcher and Isoherranen, 2009; Topletz et al., 2012). Additional sites of expression for CYP26A1 mRNA include the skin, testes, kidney, and lung, while CYP26B1 mRNA has been identified in skin, lung, testes, placenta, ovaries and intestine (Xi and Yang, 2008; Osanai and Lee, 2011; Topletz et al., 2012). While CYP26A1 and CYP26B1 share only a 42 – 44% sequence homology with each other, a significant amount of functional redundancy is observed between the two enzymes, indicating the importance of their role in the regulation of endogenous retinoic acid concentrations (Taimi et al., 2004; Topletz et al., 2012). Reports on the catalytic activity of CYP26A1 and CYP26B1 are currently limited to various retinoic acid isomers and structurally-related metabolites (White et al., 1996; Sonneveld et al., 1998; White et al., 2000; Taimi et al., 2004; Thatcher et al., 2010; Ross and Zolfaghari, 2011; Topletz et al., 2012; Topletz et al., 2014). While the enzymes generally exhibit the highest degree of activity with all trans-retinoic acid (at-RA) as the substrate, they also metabolize other retinoic acid stereoisomers, albeit with much lower activities (White et al., 1996; White et al., 2000; Taimi et al., 2004; Ross and Zolfaghari, 2011). CYP26A1 and CYP26B1 also catalyze the in vitro clearance of the retinoic acid metabolites 4-hydroxy-at-RA,
32
4-oxo-at-RA and 18-hydroxy-at-RA (Lutz et al., 2009; Shimshoni et al., 2012; Topletz et al., 2012; Topletz et al., 2014).
Retinoic acid signaling and altered retinoic acid concentrations play a significant role in various disease states (Miller, 1998; Kuenzli and Saurat, 2001; Njar, 2002; Ahmad and Mukhtar, 2004; Njar et al., 2006; Verfaille et al., 2008). As a result of the contribution of CYP26A1 and CYP26B1 to retinoic acid metabolism, significant effort has gone into the design and synthesis of inhibitors of CYP26 activity, as increased retinoic acid concentrations have been considered beneficial in many instances. Recent efforts to characterize CYP26 as a drug target have focused on structurally-related analogs of retinoids, retinoic acid metabolism blocking agents (RAMBAs) and retinoic acid receptor agonists, as a number of these compounds have been characterized as inhibitors of CYP26A1 activity in vitro (Thatcher et al., 2011). While inhibitors of CYP26 have been identified, the role of these enzymes in the metabolism of xenobiotic compounds remains unclear. Of special interest are the synthetic retinoic acid receptor agonists that are structurally similar to retinoic acid and have structural moieties which can undergo metabolism by cytochrome P450 enzymes. One such retinoid is tazarotene, an acetylene-containing compound that is administered topically to stable plaque psoriasis or mild acne patients (Tang-Liu et al., 1999). Tazarotene acts as a pro-drug in the skin with its activity being attributed to an active metabolite, tazarotenic acid, which binds with a high affinity to the retinoic acid receptors (Chandraratna, 1996). The active metabolite shares key structural features with at-RA and has been reported to be metabolized by a number of drug metabolizing enzymes including CYP2C8, CYP3A4, FMO1 and FMO3 (Madhu et al., 1997; Tang-Liu et al., 1999; Attar et al., 2003; Attar et al., 2005). Whether tazarotenic acid is a substrate of CYP26A1 and CYP26B1 is currently unknown.
In the absence of experimentally-determined structural data, homology modeling is a commonly applied computational technique used to predict protein structure and function (Hillisch et al., 2004; Cavasotto and Phatak, 2009). The approach utilizes the known crystal
33
structure of a given protein to predict the three-dimensional properties of a second protein with a similar amino acid sequence but unknown structure (Lesk and Chothia, 1986; Murzin, 2001; Zhang, 2008). The hypotheses generated by a homology model can be used to assess target druggability, to aid in the rational design of ligands for the given protein and to predict drug metabolism and toxicity, all of which can then be used to iteratively refine the model (Hillisch et al., 2004). In regard to the cytochrome P450 family of drug metabolizing enzymes, the flexible and hydrophobic nature of their active sites often presents a challenge when attempting to use a homology model to accurately predict the site of metabolism for a given substrate (Williams et al., 2000; Lewis, 2002; Eksterowicz et al., 2014). While it may be possible to correctly predict whether or not a ligand binds as an inhibitor of a cytochrome P450, correctly identifying the site of metabolism for a cytochrome P450 substrate may prove more challenging and can be indicative of the overall quality of the homology model (Arimoto, 2006; Yu et al., 2015). Several homology models have been published for CYP26A1 and CYP26B1 and have been successfully used to rationalize the stereoselective product formation of 4-OH-at-RA by CYP26A1 or the binding of triazole- or imidazole-containing inhibitors of CYP26A1 or CYP26B1 within the active site of each enzyme (Gomaa et al., 2006; Gomaa et al., 2008; Karlsson et al., 2008; Gomaa et al., 2011a; Gomaa et al., 2011b; Shimshoni et al., 2012; Sun et al., 2015). There are currently no homology models that compare the structure and function of CYP26A1 and CYP26B1 based on the metabolism of a xenobiotic compound and attempts to crystallize either isoform have been largely unsuccessful.
The aim of this work was to evaluate and characterize the active sites of CYP26A1 and CYP26B1 using homology modeling supported by at-RA and xenobiotic metabolism data. Homology models were constructed for each enzyme and compared for structural similarities and differences. at-RA and tazarotenic acid were docked into the active site of each enzyme and the predicted sites of metabolism evaluated. Metabolite identification experiments in recombinantly expressed enzyme systems were used to confirm the hypotheses generated by
34
the homology models. Finally, in vitro experiments were carried out to compare the metabolism of tazarotenic acid across a panel of drug metabolizing enzymes and to determine the kinetic parameters for the formation of metabolites from tazarotenic acid by CYP26A1 and CYP26B1.
9.2. Materials and Methods. 9.2.1. Materials.
Tazarotenic acid and all metabolite standards were obtained from Tocris Chemicals (Bristol, United Kingdom). CYP26A1 was expressed and characterized as previously described (Lutz et al., 2009). All other reagents were obtained as noted below. Solvents were from Sigma-Aldrich (St. Louis, MO) and were of the highest grade available.
9.2.2. Sequence Verification and Expression of CYP26B1.
To express recombinant CYP26B1, the human CYP26B1 cDNA was obtained from OriGene Technologies (Rockville, MD) (catalog number TC120799). Upon sequencing of the obtained clone, two single nucleotide polymorphisms were discovered that differed from the sequence reported in NCBI (Q9NR63). The two SNPs were an A191G conversion resulting in an H>R amino acid change and a G788A conversion resulting in a G>S amino acid change (CYP26B1*1, Figure 9-1). To determine which of the possible SNPs would be reflective of the CYP26B1 sequence in the human population, genomic DNA was extracted from 12 human livers from the University of Washington human liver bank and the two sections of the CYP26B1 gene were sequenced in all 12 donors. In brief, genomic DNA (50 ng) was amplified by PCR using either forward (5’-TCTTTGAGGGCTTGGATCTG-3’) and reverse (
5’-GGCAGAGAGGGAAGG-3’) primers for the A191G SNP or forward (
5’-GACAAAGGGGAGAGGTGTCA-3’) and reverse (5’-GTAGAAATGGCTGGGCACAT-3’) primers for the G778A SNP at concentrations of 400 nM. The primers and template DNA together with a
35
Ready-to-Go bead (puReTaq Ready-to-Go PCR beads, Amersham Biosciences, Piscataway, NJ) were mixed in a final volume of 25 μL and PCR amplification was done as follows: after an initial denaturing step at 94°C for 4 min, amplification was performed for 32 cycles of denaturation (94°C for 30 s), annealing (55°C for 20 s), and extension (72°C for 30 s), followed by a final extension at 72°C for 30 s. PCR products were analyzed by gel electrophoresis, spin column-purified to remove unincorporated nucleotides and primers using the QIAquick® PCR Purification Kit (Qiagen Inc., Hilden, Germany) and sequenced for the forward and reverse direction on an ABI Prism 377Xl DNA Sequencer (Applied Biosystems, Foster City, CA) with the ABI Prism® BigDyeTM Terminator Cycle Sequencing Ready Reaction Kit (PerkinElmer, Waltham, MA). After the wild-type sequence was confirmed, the CYP26B1 coding sequence from the original clone was amplified while adding a 6xHis tag with a TEV cleavage site to maintain similarity with the commercially available clone as previously described (Topletz et al., 2012). CYP26B1 protein was expressed using the Bac-to-Bac baculovirus expression system (Life Technologies, Grand Island, NY) in Sf9 cells according to the manufacturer’s instructions as described previously (Topletz et al., 2012). Sf-900 II SFM liquid media (Life Technologies, Grand Island, NY) supplemented with 2.5% fetal bovine serum was used and during protein expression ferric citrate (0.2 mM) and δ-aminolevulinic acid (0.3 mM) were added to the media 24 hours post-infection to facilitate heme synthesis. The cells were harvested 48 hours post infection, washed once in PBS with 1 mM PMSF, pelleted and stored at –80˚C. Membrane fractions containing CYP26B1 were prepared by centrifugation as described previously (Topletz et al., 2012) and P450 content determined via CO-difference spectrum.
9.2.3. IC50 Determination for Retinoic Acid Receptor Agonists.
Six retinoic acid receptor agonists were assessed for in vitro inhibition of CYP26A1 and CYP26B1 catalyzed 9-cis-4-hydroxyretinoic acid formation. Various concentrations of each inhibitor (0 – 100 µM) were incubated with 5 pmol CYP26A1 or CYP26B1, 10 pmol cytochrome
36
P450 reductase, and 100 nM 9-cis-retinoic acid in 100 mM potassium phosphate buffer (pH 7.4). Incubations were initiated by the addition of 1 mM NADPH (final concentration) and quenched after 2 minutes (CYP26A1) or 5 minutes (CYP26B1) with 5 volumes of ethyl acetate containing acitretin as an internal standard. All samples were evaporated to dryness under a gentle stream of N2, reconstituted in methanol and assayed for 9-cis-4-hydroxyretinoic acid
concentrations by HPLC-UV as previously described (Thatcher et al., 2011). All IC50
determinations were conducted in triplicate.
9.2.4. Homology Modeling.
Homology models of CYP26A1 and CYP26B1 were constructed using Prime (Schrodinger LLC, New York). The amino acid sequence of human CYP26A1 was obtained from the NCBI protein server (GenBank ID: 2688846) and the CYP26B1 amino acid sequence was obtained as described above. CYP120 (crystal structure, pdb 2VE3) was used as the template for both homology models. Compared to CYP120, CYP26A1 had 33% sequence identity and 53% positive sequence coverage while CYP26B1 had 34% sequence identity and 54% positive sequence coverage. The heme prosthetic group was added to each homology model and ligated to Cys442 (CYP26A1) or Cys441 (CYP26B1), followed by energy minimization prior to ligand docking using OPLS_2005 force field constraints as defined within the MacroModel algorithm (Schrodinger LLC, New York). In order to flexibly dock at-RA, tazarotenic acid and tazarotenic acid sulfoxide, a ligand grid (12 x 12 x 12 Å) for which the center of mass of each ligand would be constrained to was defined and centered approximately 2 – 3 Å above the heme iron using Glide (Schrodinger LLC, New York). Structural rationalization of each homology model was performed through the evaluation of Ramachandran plots and model assessment of odd bond lengths and angles (Figure 9-2). Determination of model flexibility was assessed by comparison of helical versus loop motifs and by prediction of 2° structure characteristics using PSIPRED (University College London, UK) and SSPro (Schrodinger).
37
120 ---MITSPTNLNSLPIPPGDFGLPWL 23 26A1 ---MGLPALLA-SALCTFVLPLLLFLAAIKLWDLYCVSGRDRSCALPLPPGTMGFPFF 54 26B1*1 MLFEGLDLVSALATLAACL-VSVTLLLAVSQQLWQLRWAATRDKSCKLPIPKGSMGFPLI 59 26B1 MLFEGLDLVSALATLAACL-VSVTLLLAVSQQLWQLRWAATRDKSCKLPIPKGSMGFPLI 59 : . **:* * :*:* :
120 GETLNFLND-GDFGKKRQQQFGPIFKTRLFGKNVIFISGALANRFLFTKEQETFQATWPL 82 26A1 GETLQMVLQRRKFLQMKRRKYGFIYKTHLFGRPTVRVMGADNVRRILLGDDRLVSVHWPA 114 26B1*1 GETGRWLLQGSGFQSSRREKYGNVFKTHLLGRPLIRVTGAENVRKILMGEHHLVSTEWPR 119 26B1 GETGHWLLQGSGFQSSRREKYGNVFKTHLLGRPLIRVTGAENVRKILMGEHHLVSTEWPR 119 *** . : : * . ::.::* ::**:*:*: : : ** * :: :.. ... **
120 STRILLGPNALATQMGEIHRSRRKILYQAFLPRTLDSYLPKMDGIVQGYLEQWGKAN--E 140 26A1 SVRTILGSGCLSNLHDSSHKQRKKVIMRAFSREALECYVPVITEEVGSSLEQWLSCGERG 174 26B1*1 STRMLLGPNTVSNSIGDIHRNKRKVFSKIFSHEALESYLPKIQLVIQDTLRAWSSHP-EA 178 26B1 STRMLLGPNTVSNSIGDIHRNKRKVFSKIFSHEALESYLPKIQLVIQDTLRAWSSHP-EA 178 *.* :** ::. . *:.::*:: : * .:*:.*:* : : *. * .
120 VIWYPQLRRMTFDVAATLFMGEKVS---QNPQLFPWFETYIQGLFSLPIPLPNTLFG 194 26A1 LLVYPEVKRLMFRIAMRILLGCEPQLAGDGDSEQQLVEAFEEMTRNLFSLPIDVPFSGLY 234 26B1*1 INVYQEAQKLTFRMAIRVLLGFSIPEE----DLGHLFEVYQQFVDNVFSLPVDLPFSGYR 234 26B1 INVYQEAQKLTFRMAIRVLLGFSIPEE----DLGHLFEVYQQFVDNVFSLPVDLPFSGYR 234 : * : ::: * :* :::* . . :*. :: :****: :* :
120 KSQRARALLLAELEKIIKARQQQP---PSEEDALGILLAARDDNNQPLSLPELKDQI 248 26A1 RGMKARNLIHARIEQNIRAKICGLRASEAGQGCKDALQLLIEHSWERGERLDMQALKQSS 294 26B1*1 RGIQARQILQKGLEKAIREKLQCT----QSKDYLDALDLLIESSKEHGKEMTMQELKDGT 290 26B1 RGIQARQILQKGLEKAIREKLQCT----QGKDYLDALDLLIESSKEHGKEMTMQELKDGT 290 :. :** :: :*: *: : *** :*: :. : : : **: 120 LLLLFAGHETLTSALSSFCLLLGQHSDIRERVRQEQNKLQ---LSQELTAETLKK 300 26A1 TELLFGGHETTASAATSLITYLGLYPHVLQKVREELKSKGLLCKSN--QDNKLDMEILEQ 352 26B1*1 LELIFAAYATTASASTSLIMQLLKHPTVLEKLRDELRAHGILHSGGCPCEGTLRLDTLSG 350 26B1 LELIFAAYATTASASTSLIMQLLKHPTVLEKLRDELRAHGILHSGGCPCEGTLRLDTLSG 350 *:*..: * :** :*: * : : :::*:* . . * : *. 120 MPYLDQVLQEVLRLIPPVGGGFRELIQDCQFQGFHFPKGWLVSYQISQTHADPDLYPDPE 360 26A1 LKYIGCVIKETLRLNPPVPGGFRVALKTFELNGYQIPKGWNVIYSICDTHDVAEIFTNKE 412 26B1*1 LRYLDCVIKEVMRLFTPISGGYRTVLQTFELDGFQIPKGWSVMYSIRDTHDTAPVFKDVN 410 26B1 LRYLDCVIKEVMRLFTPISGGYRTVLQTFELDGFQIPKGWSVMYSIRDTHDTAPVFKDVN 410 : *: *::*.:** *: **:* :: :::*:::**** * *.* :** :: : :
120 KFDPERFTPDGSATHNPPFAHVPFGGGLRECLGKEFARLEMKLFATRLIQQFDWTLLPGQ 420 26A1 EFNPDRFMLPHPED-ASRFSFIPFGGGLRSCVGKEFAKILLKIFTVELARHCDWQLLNG- 470 26B1*1 VFDPDRFSQARSEDKDGRFHYLPFGGGVRTCLGKHLAKLFLKVLAVELASTSRFELATRT 470 26B1 VFDPDRFSQARSEDKDGRFHYLPFGGGVRTCLGKHLAKLFLKVLAVELASTSRFELATRT 470 *:*:** * .:*****:* *:**.:*:: :*:::..* : * 120 --- 420 26A1 PPTMKTSPTVYPVDNLPARFTHFHGEINLELVVTPSPRPKDNLRVKLHSLM 521 26B1*1 FPRITLVPVLHPVDGLSVKFFGLDSNQNEILPETEA---MLSATV---- 512 26B1 FPRITLVPVLHPVDGLSVKFFGLDSNQNEILPETEA---MLSATV---- 512
Figure 9-1. Multiple sequence alignment of CYP120, CYP26A1, CYP26B1*1 and CYP26B1 amino acid sequences.
The sequence identity between CYP26A1 and CYP26B1, CYP26B1*1 and CYP120 was 44.47%, 44.26% and 33.26%, respectively. For CYP26B1*1, a 99.61% and 34.69% sequence identity was observed with CYP26B1 and CYP120, respectively. Amino acids are represented in red (small/hydrophobic), blue (acidic), purple (basic) and green (hydroxyl/sulfhydryl/amine). Sequence consensus is indicated by an asterisk (residue is fully conserved across all sequences), a colon (consensus group contains very similar properties) or a period (consensus group contains weakly similar properties).
38
Ligand structures were also minimized using the OPLS_2005 force field constraints within LigPrep (Schrodinger LLC, New York). GlideScore and eModel scoring algorithms were used to assess the docking poses of the ligands within the active site of each enzyme (Friesner et al., 2004; Friesner et al., 2006). The use of the eModel scoring algorithm allowed for selection of the best docking pose based upon the GlideScore, grid score and ligand score of each docked ligand (Perola et al., 2004). The hydrogen atoms nearest the heme iron for the at-RA and tazarotenic acid docking poses with the highest GlideScores and eModel scores were used as the predicted sites of oxidative metabolism for each compound. The volume of the active site within each homology model was estimated using DoGSiteScorer (Volkamer et al., 2012).
Figure 9-2. CYP26A1 and CYP26B1 Ramachandran Plot.
Analysis of the Phi-Psi angles in the CYP26A1 and CYP26B1 homology model demonstrated 98.9% and 98.3%, respectively, were in the favorable or allowable regions.
39 9.2.5. Metabolic Profiling.
Due to its relative potency in the CYP26A1 and CYP26B1 inhibition assays, tazarotenic acid was selected for further evaluation. In vitro experiments to elucidate the metabolic pathways of tazarotenic acid in CYP26A1 and CYP26B1 recombinant preparations were carried out using previously optimized conditions of 20 nM recombinant enzyme, 200 nM purified human reductase and tazarotenic acid (10 µM) in 100 mM potassium phosphate buffer (pH 7.4; final volume 100 µL). Incubations were initiated with the addition of 1 mM NADPH (final concentration) and incubated at 37 ºC for 30 minutes. Control incubations were performed in the absence of NADPH. Subsequent incubations to confirm the sequential metabolism of tazarotenic acid by CYP26A1 and CYP26B1 utilized 10 µM tazarotenic acid sulfoxide (final concentration) as the substrate in the incubation. Upon completion, in vitro incubations were extracted into 4 volumes of ethyl acetate, dried under a gentle stream of N2 at 40 ºC and
reconstituted in 100 µL methanol prior to LC-MS/MS analysis and compared to synthetic standards of each metabolite, if available. LC-MS/MS analysis was performed as described below.
9.2.6. Enzyme Kinetics.
In vitro enzyme kinetic parameters were determined for tazarotenic acid metabolite formation using 5 nM CYP26A1 or CYP26B1, 25 nM purified human reductase and 0 – 10 µM tazarotenic acid. Incubations were carried out for 10 minutes at 37 ºC to ensure product linearity with regard to time and protein concentration. Additional experiments to determine the kinetic parameters for the sequential metabolism of tazarotenic acid metabolite sulfoxide used substrate concentrations ranging from 0 – 50 µM. Samples were prepared as described for in vitro metabolic profiling experiments.
40 9.2.7. Tazarotenic Acid Phenotyping.
To assess the relative contribution of CYP26A1 and CYP26B1 to the in vitro oxidative metabolism of tazarotenic acid, metabolite formation was monitored across a panel of drug metabolizing enzymes. Previously reported studies to characterize the enzymes responsible for the metabolism of tazarotenic acid were conducted at substrate concentrations of 1 – 200 µM (Attar et al., 2003). As total circulating plasma concentrations of tazarotenic acid are approximately 1 – 280 nM following typical doses of tazarotene, current studies were conducted using clinically relevant substrate concentrations. In vitro incubations consisted of 5 nM recombinant enzyme, 50 nM purified human reductase and 100 nM tazarotenic acid (final concentrations) in 100 mM potassium phosphate buffer (pH 7.4). Following a three minute pre-incubation at 37 ºC, reactions were initiated with the addition of 1 mM NADPH (final concentration). For incubations utilizing flavin-containing monooxygenase enzymes, the pre-incubation step consisted of enzyme and NAPDH followed by initiation with substrate due to the known instability of FMOs at 37 ºC in the absence of cofactor (Foti and Fisher, 2004). Incubations (50 µL, final volume) were carried out for 30 minutes at 37 ºC before being quenched with 3 volumes (v/v) of ice-cold acetonitrile containing tolbutamide as an internal standard. Samples were vortexed and centrifuged at 1240 x g for ten minutes before being transferred for LC-MS/MS analysis. Data was expressed as the percent of total metabolite formed across the panel of enzymes for each individual metabolite.
9.2.8. LC-MS/MS Analysis.
Analysis of tazarotenic acid and its metabolites was conducted using LC-MS/MS. The analytical platform was comprised of an Applied Biosystems API4000 fitted with an electrospray ionization source (Applied Biosystems, Foster City, CA). Liquid chromatography and sample introduction was achieved using two LC-20AD binary pumps with an in-line DGU-20A5 solvent degasser
41
(Shimadzu, Columbia, MD) and a LEAP CTC HTS PAL autosampler (CTC Analytics, Carrboro, NC). An injection volume of 10 μL was used for all analyses. For enzyme kinetic experiments, chromatographic separation was achieved using 0.1% formic acid (v/v) in water (mobile phase A) and 0.1% formic acid in methanol:acetonitrile (1:1; mobile phase B) on a Synergi 2.5 µm Hydro RP 100 Å (50 x 2.0 mm) column (Phenomenex, Torrance, CA). Gradient conditions consisted of 2.5% B (0 – 0.4 minutes), 2.5% B – 95% B (from 0.4 – 1.4 minutes), 95% B (from 1.4 – 2.5 minutes) and re-equilibration at 2.5% B for 0.5 minutes. For metabolite identification experiments, the same mobile phase system was used with a Kinetex 2.6 µm C18 100 Å (100 x 2.1 mm) column (Phenomenex, Torrance, CA). A gradient of 2.5% B (0 – 3 minutes), 2.5% B – 95% B (from 3 – 14 minutes), 95% B (from 14 – 17 minutes) followed by re-equilibration at 2.5% B for 3 minutes was used to achieve chromatographic separation of all analytes. Initial metabolite identification experiments used full scan analysis from 100 – 800 amu followed by analysis of the corresponding product ion spectra for each observed analyte. Subsequent LC-MS/MS analyses utilized multiple reaction monitoring (MRM) for each analyte. MRM transitions (positive ionization mode) were as follows: tazarotenic acid (m/z 324.2 / 294.3), tazarotenic acid sulfoxide and hydroxytazarotenic acid (m/z 340.3 / 280.3), tazarotenic acid sulfone (m/z 356.3 / 276.3) and the internal standard tolbutamide (m/z 271.2 / 91.1). Generic parameters applied to all MS analyses included the curtain gas (12 arbitrary units), CAD gas (medium), ion spray voltage (5000 V), source temperature (500 °C) and ion source gas 1 and gas 2 (30 arbitrary units, each).
9.2.9. Data Analysis.
Mass spectrometry data was evaluated using Analyst (version 1.5; Applied Biosystems, Foster City, CA). Analyte concentrations were determined by comparing peak areas in unknown samples to those obtained from standard curves with analytical standards (dynamic range: 1 –
42
2000 nM; weighting: 1/x). Parameter fitting for IC50 and enzyme kinetic data was performed
using Graphpad Prism as described below (version 6.03; Graphpad Software Inc., San Diego, CA).
IC50 values for retinoic acid receptor agonists in the 9-cis-4-hydroxyretinoic acid assay
were determined by nonlinear regression using Equation 1. In the following equation, 100%*(Vi/V) represents the percent activity remaining for a given inhibitor concentration, [I],
(Vi/V)max*100% is the maximum observed activity with no inhibitor present, and (Vi/V)min is the
remaining enzyme activity at infinitely high concentrations of inhibitor.
Equation 1 max
[ ] logmin50
min 1 10 % 100 * % 100 * * % 100 I IC i i i i v v v v v v v v
Enzyme kinetic parameters (Km and Vmax) were estimated through nonlinear regression
analysis using the Michaelis-Menten model as shown in Equation 2. In the equation below, Km
denotes half the substrate concentration ([S]) at maximal reaction velocity (Vmax).
Equation 2 ] [ ] [ * max S K S V V m