HAL Id: cea-02339670
https://hal-cea.archives-ouvertes.fr/cea-02339670
Submitted on 4 Nov 2019HAL is a multi-disciplinary open access archive for the deposit and dissemination of sci-entific research documents, whether they are pub-lished or not. The documents may come from teaching and research institutions in France or
L’archive ouverte pluridisciplinaire HAL, est destinée au dépôt et à la diffusion de documents scientifiques de niveau recherche, publiés ou non, émanant des établissements d’enseignement et de recherche français ou étrangers, des laboratoires
MC-ICPMS
B. Martelat, H. Isnard, L. Vio, E. Dupuis, T. Cornet, A. Nonell, F. Chartier
To cite this version:
B. Martelat, H. Isnard, L. Vio, E. Dupuis, T. Cornet, et al.. Precise U and Pu isotope ratio mea-surements in nuclear samples by hyphenating capillary electrophoresis and MC-ICPMS. Analytical Chemistry, American Chemical Society, 2018, 90, pp.8622-8628. �cea-02339670�
This document is confidential and is proprietary to the American Chemical Society and its authors. Do not copy or disclose without written permission. If you have received this item in error, notify the sender and delete all copies.
Precise U and Pu isotope ratio measurements in nuclear samples by hyphenating capillary electrophoresis and
MC-ICPMS
Journal: Analytical Chemistry Manuscript ID ac-2018-01884j Manuscript Type: Article
Date Submitted by the Author: 26-Apr-2018
Complete List of Authors: MARTELAT, Benoit; Laboratoire d'Analyses Nucléaires Isotopiques et Elémentaires, Physico Chemistry
Isnard, Helene; Laboratoire d'Analyses Nucléaires Isotopiques et Elémentaires, Physico Chemistry
Vio, Laurent; CEA Saclay
DUPUIS, Erwan; Laboratoire d'Analyses Nucléaires Isotopiques et Elémentaires, Physico Chemistry
CORNET, Terence; Laboratoire d'Analyses Nucléaires Isotopiques et Elémentaires, Physico Chemistry
Nonell, Anthony; CEA, DEN/DPC/SEARS/LANIE Chartier, Frederic; CEA, DEN/DPC
Precise U and Pu isotope ratio measurements in nuclear samples by hyphenating capillary electrophoresis and MC-ICPMS
Benoit Martelat1, Hélène Isnard*1, Laurent Vio1, Erwan Dupuis1, Terence Cornet1, Anthony Nonell1, Frédéric Chartier2
1. Den – Service d’Etudes Analytiques et de Réactivité des Surfaces (SEARS), CEA, Université Paris-Saclay, F-91191, Gif sur Yvette, France
2. Den – Département de Physico-Chimie (DPC), CEA, Université Paris-Saclay, F-91191, Gif sur Yvette, France
* Corresponding Author: Hélène Isnard, [email protected] 3 4 5 6 7 8 9 10 11 12 13 14 15 16 17 18 19 20 21 22 23 24 25 26 27 28 29 30 31 32 33 34 35 36 37 38 39 40 41 42 43 44 45 46 47 48 49 50 51 52 53 54
Abstract
Precise isotopic and elemental characterization of spent nuclear fuel is a major concern for the validation of the neutronic calculation codes and waste management strategy in the nuclear industry. Generally, the elements of interest, particularly U and Pu which are the two major elements present in spent fuel, are purified by ion exchange or extractant resins before off-line measurements by thermal ionization mass spectrometry. The aim of the present work was to develop a new analytical approach based on capillary electrophoresis (CE) hyphenated to a multicollector inductively coupled plasma mass spectrometer (MC-ICPMS) for online isotope ratio measurements. An electrophoretic separation protocol of U, Pu and the fraction containing fission products and minor actinides (Am and Cm) was developed using acetic acid as the electrolyte and complexing agent. The instrumentation for CE was designed to be used in a glove box and a laboratory-built interface was developed for hyphenation with MC-ICPMS. The separation was realized with only a few nL of a solution of spent nuclear fuel and the reproducibilities obtained on the U and Pu isotope ratios were on the order of a few ‰ which is comparable to those obtained by thermal ionization mass spectrometer (TIMS). This innovative protocol allowed a tremendous reduction of the sample amounts classically required for analysis: sample masses from µg to ng and sample volumes from µL to nL. also a drastic reduction of the liquid waste production from mL to µL. In addition, the measurement process was shorted by at least three orders of magnitude. All of these improved parameters are of major interest for nuclear applications.
3 4 5 6 7 8 9 10 11 12 13 14 15 16 17 18 19 20 21 22 23 24 25 26 27 28 29 30 31 32 33 34 35 36 37 38 39 40 41 42 43 44 45 46 47 48 49 50 51 52 53 54 55
1. Introduction
The precise knowledge of actinides and fission products in spent nuclear fuels is mandatory in order to qualify and validate neutronic calculation codes. These codes are used to improve nuclear fuel performances, waste management and associated safety-related applications.1 The major analytical requirement for such topics is to obtain the best uncertainties when it comes to the concentration measurements and isotopic compositions in the spent fuel samples.2 These samples are characterized by a complex matrix with a large diversity of elements produced by neutron capture, fission or activation reactions. Diluted nuclear fuel sample solutions contain uranium (more than 95% of the elements present) and transuranium radioelements (Np, Pu, Am, Cm) as well as a variety of fission products (FP) consisting mainly of lanthanides (La, Nd, Sm, Eu, Gd, …), alkali and alkaline earth metals (Cs, Sr …) as well as transition metals (Ag, Ru, Pd,…).
Mass spectrometric techniques involving multi-collection systems have the capacity to measure isotope ratios in a very precise and accurate way. However, prior to measurements, two steps of chromatographic separation 3-6 are in most cases required to prevent spectral (isobaric, polyatomic or doubly charged) or non-spectral (matrix effects) interferences on the isotopes of interest. The first step leads to the chemical purification of U and Pu by isolating them from the FP and minor actinides (Am) collected in a third fraction (FP+ Am). This purification is generally achieved by using ion exchange or extraction resins.7,8 The second step by High Performance Liquid Chromatography (HPLC) aims to separate certain elements of interest (for example Nd and Cs) from the complex FP fraction.3 These complex protocols 3 4 5 6 7 8 9 10 11 12 13 14 15 16 17 18 19 20 21 22 23 24 25 26 27 28 29 30 31 32 33 34 35 36 37 38 39 40 41 42 43 44 45 46 47 48 49 50 51 52 53 54
are required in order to isolate each element of interest prior to its isotopic characterization.3, 9,10
Apart from their complexity and duration, these protocols also present drawbacks such as the increased handling time of radioactive samples, the production of radioactive waste and the risk of natural contamination. Several analytical developments were designed in order to significantly limit the sample handling duration, the amount of sample required for accurate measurements and the amount of waste produced. For example, the use of ICPMS with collision or reaction cells allows the in-situ resolution of spectral interferences by using an appropriate gas selected on the basis of both thermodynamic and kinetic considerations.11-15 These systems, based on collision-induced processes and reaction chemistry in a gas-filled multipole device, avoid time-consuming chemical separation of the interfering elements and reduce risks of sample contamination.
Another improvement consists in the hyphenation of HPLC with MC-ICPMS, which has also been widely developed during the last two decades.16 In the particular case of nuclear fuel samples, several studies have evaluated the performance of HPLC-MC-ICPMS for isotope ratio measurements of U, Pu, Nd, Eu, Gd, Sm in nuclear fuel samples or simulated solutions.17-20 After taking into account the drift phenomenon occurring when transient signals are acquired 21-23, isotope ratios are measured with uncertainties on the order of or lower than 1‰. This approach is particularly attractive for reducing the analysis time and consequently the analyst’s exposure to ionizing radiation. Nevertheless, considering the typical flow rates of the chromatographic systems which are usually on the order of several hundreds of microliters per minute, further developments are required to reduce the associated liquid waste volumes. Since electrokinetic methods only involve ion migration under the influence 3 4 5 6 7 8 9 10 11 12 13 14 15 16 17 18 19 20 21 22 23 24 25 26 27 28 29 30 31 32 33 34 35 36 37 38 39 40 41 42 43 44 45 46 47 48 49 50 51 52 53 54 55
of an electric field, they enable a significant reduction of liquid waste production as well as sample consumption in the nano- or microliter range.
Very few studies have addressed the hyphenation of electrokinetic separations with ICPMS for isotope ratio measurements. Pitois et al.24 hyphenated a capillary electrophoresis (CE) device with a quadrupole ICPMS or a magnetic sector ICPMS to perform isotope ratios at 1% uncertainty of 14 lanthanides in less than 15 min with a liquid production as low as 4 µL.min-1 and quantification limits of a few tens of ng.mL-1. Vio et al.25 developed a method to separate lanthanides by isotachophoresis, an electrophoretic technique used to preconcentrate the sample while separating the analytes at the same time. In this study, 13 lanthanides were separated with a sample volume of 1.3 µL containing 6.5 ng of each lanthanide. This separation was then transposed on an ITP microchip and hyphenated to an MC-ICPMS for Sm and Nd isotopic measurements.26 The approach was extended in order to perform multi-elemental Nd, Sm, Eu, Gd isotope ratio measurements by stop-flow isotachophoresis. This analytical development enabled the isotope ratio measurements, within a single analytical run, of 4 elements and up to 23 isotopes with only 20 ng injected per element with isotope ratio reproducibilities better than 0.4% (k=2) and accuracies better than 0.2%.27 In addition, Martelat et al.28 investigated the isotopic fractionation and evaluated the analytical performances of electrokinetic separations hyphenated with MC-ICPMS for Nd isotope ratio measurements. The reproducibility obtained was lower than 0.2 ‰ regardless of the Nd isotope ratio and with 0.5 ng of sample injected for each analysis. This reproducibility was similar to that obtained with the hyphenation of LC to MC-ICPMS 19 but with significantly reduced sample volumes and liquid waste quantities.
3 4 5 6 7 8 9 10 11 12 13 14 15 16 17 18 19 20 21 22 23 24 25 26 27 28 29 30 31 32 33 34 35 36 37 38 39 40 41 42 43 44 45 46 47 48 49 50 51 52 53 54
Concerning U and Pu, CE is not commonly used to separate and purify these two elements for isotope ratio measurements by mass spectrometry, but several studies have been dedicated to the speciation of actinides and lanthanides in environmental or nuclearsamples. In these studies the separation of lanthanides and actinides have been achieved using different types of electrolytes.29-34 The separation of different Pu oxidation states was optimized by Kuczewski et al. 32 using La(III), Th(IV), Np(V) and U(VI). The background electrolyte was 1 mol.L-1 acetic acid at a pH of 2.4 (yielding a free acetate concentration of approximately 7 mmol.L-1). Subsequently, the same electrolyte was used to separate different Pu species, i.e., Pu(III), Pu(IV), Pu(V) and Pu(VI).
The first objective of this study was to develop the separation by capillary electrophoresis of U and Pu from the FP fraction also containing minor actinides (Am, Cm). The background electrolyte was chosen in order to obtain the highest difference of electrophoretic mobility between U, Pu and the FP and minor actinide fractions. The change in migration time as a function of the oxidation state of Pu was studied in order to obtain the best resolution between the U and Pu peaks and to resolve the main isobaric interference 238
U/238Pu encountered in nuclear fuel samples.
The second objective was the hyphenation of CE with MC-ICPMS in order to obtain precise and accurate isotope ratios for U and Pu within a single analytical run. A mass bias correction approach was developed and validated with the use of certified isotope reference materials of uranium.
The third objective was the application of this new analytical protocol to irradiated fuel samples. The direct measurement of U and Pu by CE-MC-ICPMS was performed on several 3 4 5 6 7 8 9 10 11 12 13 14 15 16 17 18 19 20 21 22 23 24 25 26 27 28 29 30 31 32 33 34 35 36 37 38 39 40 41 42 43 44 45 46 47 48 49 50 51 52 53 54 55
nL of a solution of mixed oxide (MOx) spent fuel. The reproducibility obtained on the U and Pu isotope ratios by this new CE-MC-ICPMS analytical approach are then compared to reference values determined by Thermal Ionization Mass Spectrometry (TIMS).
2. Materials and methods
2.1. Reagents and reference materials
2.1.1. Electrolyte solutions
For CE analysis, the background electrolyte (BGE) was prepared daily by diluting a solution of acetic acid (99.9% purity) in ultra-pure water (Millipore, Guyancourt, France). The pH was adjusted to 3.0 using an ammonia solution (25% v/v). In order to modify the electrolyte conductivity, ammonium chloride was added for the measurements performed on the spent nuclear fuel sample. For the oxidation step of Pu, a solution of concentrated perchloric acid (70%) was diluted in ultra-pure water. All chemicals were purchased from Sigma Aldrich (Saint Quentin Fallavier, France), and all the reagents used were of ultrapure analytical grade.
Prior to each analysis the capillary was successively flushed with H2O, HNO3 (0.3 mol L-1), H2O, NaOH (0.1 mol L-1), H2O and the BGE in the given order for 5 min each at a pressure of 1 bar. Sample plugs of 1 cm and 5 cm were injected. The injection parameters were determined by using a small plug of a standard solution of uranium pushed at 100 mbar through the capillary to ICPMS by the background electrolyte. Once the injection step was completed, the capillary inlet was immersed in a vial containing the BGE.
2.1.2. Samples and isotope reference materials 3 4 5 6 7 8 9 10 11 12 13 14 15 16 17 18 19 20 21 22 23 24 25 26 27 28 29 30 31 32 33 34 35 36 37 38 39 40 41 42 43 44 45 46 47 48 49 50 51 52 53 54
Three certified isotope reference materials of uranium (IRMM 184, IRMM 186 and IRMM 187) were employed in this study. IRMM 184 and IRMM 187 were used to evaluate the analytical performances and to validate the mass bias correction approach proposed in this work. IRMM 186 was the U isotopic standard used to perform external mass bias correction and its 235U/238U certified ratio (0.0307711(92)) was used as a reference. The standard solutions were prepared by evaporating aliquots of the IRMM 184 and 187 stock solutions and the dry extract was dissolved in adequate volumes of BGE. For IRMM 186, used for mass bias correction, the dry extract was dissolved in 2% nitric acid solution. The standard solution of IRMM 186 was used for signal optimization prior to analysis.
Two solutions of plutonium were used, one for the preliminary separation tests and one for the validation of the mass bias correction approach. The former was an enriched 242Pu solution (97.61%) conditioned in ultrapure 4M nitric acid. The second was a reference solution conditioned in the same media and used in the laboratory for quality control. Isotope ratios were qualified by TIMS using the total evaporation technique.
The spent nuclear fuel sample was solution of a MOx fuel diluted in nitric acid (8 M) and sent from a dedicated facility to the Laboratory of Analytical development for Nuclear Isotopic and Elemental Analysis in Saclay for isotopic and elemental characterization.
2.2. Instrumentation
A schematic description of the complete instrumental system and all the instrumental settings for CE and the interface with MC-ICPMS are presented in the Supporting information section S1. The electrophoretic system was composed of a high-voltage generator applying the 3 4 5 6 7 8 9 10 11 12 13 14 15 16 17 18 19 20 21 22 23 24 25 26 27 28 29 30 31 32 33 34 35 36 37 38 39 40 41 42 43 44 45 46 47 48 49 50 51 52 53 54 55
electric field to the capillary and a laboratory-built CE module adapted for manipulation in a glove box. In order to pressurize the CE module during the injection and separation steps, an MFC was used. A schematic description of this specially designed CE module setup for the separation is presented in Supporting information section S1. The hyphenation to the MC-ICPMS was achieved using a Mira Mist CE nebulizer (Burgener, Mississauga, Ontario, Canada). The MFC was used to deliver the makeup solution at a flow rate of 10 µL min-1. A specifically designed low volume cyclonic spray chamber (20 mL) was used at the interface. It was composed of 2 nebulizer inlets with an angle of 45° between them 27: one for the Mira Mist CE nebulizer and one for a Micro Mist nebulizer, with a nominal flow rate of 100 µl.min-1 used to inject a standard during the separation in order to perform mass bias correction.
The isotope ratios were determined using a Neptune Plus MC-ICPMS (Thermo Scientific, Bremen, Germany) modified to accommodate a glove box around the ion source. The operating parameters and Faraday cup configuration are detailed in the Supporting information section S1. A special configuration was used for analysis of the spent nuclear fuel sample with a first setup used for the acquisition of the Pu isotope signals and a second setup used for the acquisition of the U isotope signals. Mass bias was corrected using the Intra Injection Sample Standard Bracketing (IISSB) approach, first introduced for Nd isotope ratio measurements by dual inlet Liquid Chromatography-MC-ICPMS.19
3. Results and discussion
3.1. Development of U-Pu separation 3 4 5 6 7 8 9 10 11 12 13 14 15 16 17 18 19 20 21 22 23 24 25 26 27 28 29 30 31 32 33 34 35 36 37 38 39 40 41 42 43 44 45 46 47 48 49 50 51 52 53 54
A simulated nuclear fuel sample containing La (III), Lu(III), Am(III), U(VI) and Pu in different oxidation states was used in order to determine the migration time for each species and to establish the optimal concentration of acetic acid in the electrolyte. This sample was prepared by evaporation of two solutions: a solution containing La, Lu, U and Pu in nitric acid and a Pu solution treated with perchloric acid in order to oxidize Pu in its Pu(VI) state. Am was found as 241Am, produced by β- decay of 241Pu present in the Pu solutions used for these tests. After evaporation the residues of the two solutions were dissolved in 0.25M acetic acid and mixed to obtain a concentration of approximately 50 µg.g-1 for each element. Migration of all the species occurred in less than 70 minutes using a concentration of acetic acid lying between 0.25 and 0.5 M at a pH of 3.
Figure 1 presents the electropherogram obtained after injecting the simulated nuclear fuel sample. Four different Pu species were observed on the electropherogram. Plutonium is known to reach equilibrium with several oxidations states coexisting in solution, the relative abundance of the oxidation states depending on the chemical conditions.35 In our case, the four different species observed could be species containing Pu(III), Pu(IV), Pu(V) and Pu(VI). The migration time of La(III), Lu(III), Am(III) and Pu(III) was around 35 minutes. Pu(III) co-migrated with the lanthanides, in accordance with the similarity between the chemical behavior of An(III) and Ln(III). It was only present at a very low concentration and was formed by disproportionation and/or reduction of Pu(IV). The migration time for Pu(VI) was around 42 minutes. Pu(VI) migrated before U(VI) which appeared around 50 minutes. The behavior of the hexavalent state of Pu was similar to the one observed by Gräser et al.36 Another Pu species with a migration time equal to U(VI) and a low concentration was also observed. This species was probably Pu(V), formed by alpha reduction of Pu(VI). Finally, 3 4 5 6 7 8 9 10 11 12 13 14 15 16 17 18 19 20 21 22 23 24 25 26 27 28 29 30 31 32 33 34 35 36 37 38 39 40 41 42 43 44 45 46 47 48 49 50 51 52 53 54 55
Pu(IV) migrated last with a migration time of 60 minutes. A deformation of the Pu(IV) peak was also seen and was believed to be caused by plutonium hydrolysis.
The migration order observed here was Pu(III)>Pu(VI)>Pu(V)>Pu(IV). This migration order was interpreted by calculating the degree of complexation of Pu, knowing the pH, the total acetic acid concentration and the reviewed stability constants of Pu(III), Pu(IV) and Pu(VI) with acetate from the literature.37,38 The stability constants of Np(V) were used for Pu(V) as they were expected to be of the same order of magnitude. It was found that the speciation in our system was remarkably close to the one calculated by Kuckzewski et al. 32, owing to the very small difference in the free acetate concentration between the two studies. As the complexation was controlled by the free ligand concentration, the migration order was the same in both studies.
After the optimization of the electrolyte composition using the simulated sample, separation and resolution of isobaric interferences between Am, Pu and U in a MOx fuel sample was performed.The separation between Pu and Am, for which isobaric interferences occur at m/z=241, 242 and 244 in nuclear fuel samples, can be realized if Pu is present as Pu(IV) or Pu(VI). For the major interference in nuclear fuel samples between 238Pu and 238U, with a 238U/238Pu ratio generally higher than 500 in nuclear fuel samples, Pu(VI) is the most adapted oxidation state to totally resolve this isobaric interference and to avoid the peak tailing of 238U on 238Pu. An oxidation step was therefore performed prior to the injection. The sample solution was evaporated and the dry extract was dissolved in 1-M perchloric acid and heated to evaporate the latter, in order to oxidize the Pu into its Pu(VI) state.36 This process was repeated twice to ensure complete oxidation. The sample was finally dissolved in diluted perchloric acid (0.002 M) to preserve its stability over time.
3 4 5 6 7 8 9 10 11 12 13 14 15 16 17 18 19 20 21 22 23 24 25 26 27 28 29 30 31 32 33 34 35 36 37 38 39 40 41 42 43 44 45 46 47 48 49 50 51 52 53 54
Subsequently, the concentration of acetic acid in the electrolyte was increased in order to obtain a time difference between the migration peaks of Pu(VI) and U(VI) larger than 5 min. This was a mandatory step because the Faraday cups in our instrument could not be configured to detect all Pu and U isotopes with a single configuration. The time required to switch between Pu and U configurations was around 3 min. Therefore, the electrolyte concentration was increased to 0.4M in order to obtain a sufficient difference of migration time between Pu(VI) and U(VI), rendering it possible to change the detector configuration between Pu and U peak migration.
Figure 2 presents the electropherogram obtained after injecting a nuclear fuel sample solution. 50 µl of a 8M HNO3 solution of MOx nuclear fuel was evaporated to dryness, treated with perchloric acid and after two steps of evaporation finally diluted in 50 µL of 0.002M perchloric acid before injection. The injection volume was around 5nL which corresponded to injected quantities of U, Pu and Am of approximately 0.7, 0.05, and 0.003 ng, respectively. The electropherogram shows that the separation of Am(III), Pu(VI) and U(VI) was sufficient to perform direct measurements of U and Pu isotope ratios with a gap time between the Pu and U migration times of approximately 8 min, thus allowing the Faraday cups configuration to be switched from C2 to C3 at the end of the Pu migration peak.
3.2. Mass bias correction approach and validation
In this part, the validation of the analytical approach for mass bias correction was performed on certified isotopic standards. In LC-MC-ICPMS, the introduction of the reference isotopic standard to perform IISSB mass bias correction was performed using a T-junction located between the separation column and the ICPMS interface. In CE-MC-ICPMS, 3 4 5 6 7 8 9 10 11 12 13 14 15 16 17 18 19 20 21 22 23 24 25 26 27 28 29 30 31 32 33 34 35 36 37 38 39 40 41 42 43 44 45 46 47 48 49 50 51 52 53 54 55
this configuration is not possible due to the fact that a specific nebulizer is used to perform the separation until the extreme end of the capillary. Therefore, a cyclonic spray chamber with two nebulizer inlets was utilized in this study to allow the injection of the reference isotopic standards while the CE separation was running.26 The injection of the standard could be performed at any time during the separation.
The uranium isotopic standard (IRMM 186) solution was introduced five minutes before the injection of the sample, i.e., before the migration peak of Am. The second standard was injected at the end of the separation when the contribution of the baseline of the last migration peak was negligible. The data treatment methods were evaluated by injection of reference isotopic standard as samples. Different methods of data treatment have been intensively compared including point by point (PbP), linear regression slope (LRS)39 and peak area integration (PAI).39,40 The LRS and PAI methods are used for transient signals because they correct the isotope ratio drift.39,40 These methods have been used and compared in our particular case. In the PAI method the background was taken into account by subtracting the baseline 30s before the migration peak and an integration window of 95% was chosen.19,40 As the LRS method does not require the selection of a specific percentage of the peak area 39, 100% of the peak zone was considered.
Table 1 presents the results obtained on five injections of IRMM 184 reference isotopic standard and five injections of IRMM 187 reference isotopic standard. The injection volume was around 230 nL which corresponds to a quantity of injected U around 35 ng. Mass bias was corrected with the IISSB approach for all ratios using the 235U/238U ratio value of the IRMM 186 standard and using an exponential law. Data on the bracketing standard and simulated sample were evaluated using the same data treatment method. Comparing the different data treatment methods, better reproducibilities were obtained with the LRS method, 3 4 5 6 7 8 9 10 11 12 13 14 15 16 17 18 19 20 21 22 23 24 25 26 27 28 29 30 31 32 33 34 35 36 37 38 39 40 41 42 43 44 45 46 47 48 49 50 51 52 53 54
particularly when the signal intensity was lower than 5 mV. This observation is in agreement with previous studies performed by hyphenating separative techniques and MC-ICPMS.20,27
The 235U/238U and 234U/238U isotope ratio values for IRMM 184 and IRMM 187 obtained with the LRS method were in agreement within uncertainty with the certified ratio value of the isotopic standard. For the IRMM 184 standard 236U/238U ratio was not evaluated considering the very low abundance of 236U. For the 236U/238U isotope ratio of the IRMM187 standard, abundance sensitivity and hydrides rate are taken into account. They were evaluated at the beginning of the analytical session and were equal to 2x10⁻⁶ (237U/238U) and 5.6x10⁻⁶ (239/238U) respectively. The relative difference between corrected 236U/238U ratio value obtained with the LRS method and the certified value was around 6‰.The usefulness of the IISSB approach using the LRS method of data treatment was thus demonstrated for CE-MC-ICPMS applications in the nuclear field.
In order to minimize the number of standards injected during the separation we evaluated the possibility to correct Pu isotope ratios using the mass bias factor determined from U certified isotopic standards. A Pu sample with known 239Pu/240Pu= 0.2864(3), previously evaluated in the laboratory by TIMS using the total evaporation technique was injected in the capillary. The separation conditions were the same as those previously defined for the U-Pu separation by CE.Six independent injections were performed and the average 239
Pu/240Pu ratio corrected using β-values of the IRMM 186 injected before and after the Pu peaks was equal to 0.2863 with a relative standard deviation of 0.01% at k=2. This value was in very good agreement with the reference value obtained by TIMS. The strategy to correct the Pu isotope ratio using the β-value of a uranium standardwas therefore demonstrated to be consistent to obtain U and Pu isotope ratios values with an uncertainty around 1‰ required for nuclear application.42
3 4 5 6 7 8 9 10 11 12 13 14 15 16 17 18 19 20 21 22 23 24 25 26 27 28 29 30 31 32 33 34 35 36 37 38 39 40 41 42 43 44 45 46 47 48 49 50 51 52 53 54 55
3.3. U and Pu measurements on an irradiated nuclear fuel sample
The developed analytical procedure was applied to a MOx spent nuclear fuel sample solution. The 8M HNO3 solution was evaporated and treated with perchloric acid as previously described and then diluted in order to obtain a solution in 0.002M perchloric acid. The injection volume was around 20 nl which corresponded to injected quantities of U, Pu and Am around 4, 0.3 and 0.02 ng, respectively. The quantities were chosen in order to obtain signals higher than 1 mV on all isotopes of U and Pu. Mass bias correction was performed using the IISSB approach with the 235U/238U ratio value of the IRMM 186 reference isotopic standard.
3.3.1. U isotope ratio measurements
Table 2 presents the results obtained on U isotope ratios along with the values of Apex signals for U isotope migration peaks. The reproducibilities evaluated as the standard deviation expressed at k=2 were equal to 1.6‰, 6.2‰ and 3.8‰ for 235U/238U, 234U/238U and 236U/238U ratios, respectively. The major 235U/238U was in agreement with the ratio obtained by TIMS after chemical separation with relative difference between the two methods of 1.5‰. The 234
U/238U ratio was also in agreement within uncertainty with the ratio obtained by TIMS with relative difference of -7.7‰. For the 236U/238U ratio there was a bias around 13‰ between the two methods due to the fact that abundance sensitivity and hydride formation were not evaluated for each injection but at the beginning of the analytical session. Abundance 3 4 5 6 7 8 9 10 11 12 13 14 15 16 17 18 19 20 21 22 23 24 25 26 27 28 29 30 31 32 33 34 35 36 37 38 39 40 41 42 43 44 45 46 47 48 49 50 51 52 53 54
sensitivity is the major source of correction for such ratio and must be more properly corrected. This will be investigated in future work.
3.3.2. Pu isotope ratio measurements
Table 2 presents the results obtained on Pu isotope ratios along with the values of Apex signals for Pu isotope migration peaks. The reproducibility evaluated as the standard deviation expressed at k=2 was better than 1‰ for 240Pu/239Pu, 241Pu/239Pu and 242Pu/239Pu ratios and around 4‰ for the 238Pu/239Pu ratio in relation to intensity lower than 15 mV on the 238Pu isotope. The bias between the value obtained with this new protocol and the values acquired by TIMS after chemical separation by anion exchange resin 3 is presented in Table 2 and is lower than 3.5‰ for all ratios. All Pu isotope ratios values were in agreement within uncertainties between the two methods and no significant bias was detected in particular for the two interfered 238Pu/239Pu and 241Pu/239Pu ratios demonstrating the satisfactory separation obtained between 238Pu and 238U, and between 241Pu and 241Am.
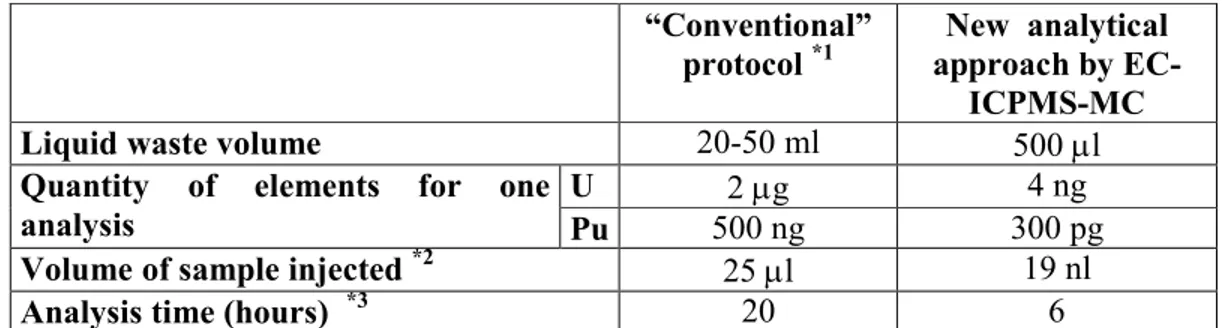
3.3.3. Comparison with an off-line analytical protocol
The reproducibilities obtained on U and Pu isotope ratios were on the order of a few ‰ and comparable with those obtained with the conventional analytical protocol after chemical separation by ion exchange resin and off-line thermal ionization mass spectrometric measurements. Table 3 compares the present on-line analytical approach with the “conventional” off-line protocol in terms of waste quantity, element masses required per analysis, sample volumes and times of analysis. The conventional protocol was developed in our laboratory for analysis of nuclear fuel samples 3 and the values presented here are comparable with those obtained by similar analytical protocols in other nuclear laboratories. 43-3 4 5 6 7 8 9 10 11 12 13 14 15 16 17 18 19 20 21 22 23 24 25 26 27 28 29 30 31 32 33 34 35 36 37 38 39 40 41 42 43 44 45 46 47 48 49 50 51 52 53 54 55
45
We observed a very significant decrease in term of analyzed quantities (from µg to ng), liquid waste volumes (from mL to µL) and sample volumes (from µL to nL). Moreover, the time of analysis was three times shorter. These reductions are very significant for nuclear applications.
4. Conclusion
This study aimed to demonstrate the capability of capillary electrophoresis hyphenated to MC-ICPMS to perform isotope ratio measurements of both U and Pu in nuclear fuel samples at sub-nanogram amounts of material per element and in a single analytical run. Instrumental developments were carried out to design a laboratory built module for CE that could be easily used in a glove box. Furthermore, a laboratory-developed interface was also used for hyphenation with MC-ICPMS.
The first part of the study was dedicated to the development of the separation of Am, U and Pu in order to prevent isobaric interferences for U and Pu isotope ratio measurements. A study of the migration time of all Pu states was performed. The concentration of the electrolyte was chosen in order to have time between the migration peaks of U and Pu to change the detector configuration of the MC-ICPMS necessary to detect every U and Pu isotope.
In the second part of the study, the method of Intra Injection Sample Standard Bracketing (IISSB) was adapted with the use of a home made spray chamber with two nebulizer inlets. One inlet was dedicated to the MiraMist nebulizer containing the separation capillary and the second one to a Microflow nebulizer for the injection of a reference isotopic standard during the separation. The reproducibilities obtained on the U and Pu isotope ratios were on the order of a few ‰ which is comparable to those obtained by TIMS.
3 4 5 6 7 8 9 10 11 12 13 14 15 16 17 18 19 20 21 22 23 24 25 26 27 28 29 30 31 32 33 34 35 36 37 38 39 40 41 42 43 44 45 46 47 48 49 50 51 52 53 54
These analytical developments demonstrated that considerable gains could be obtained in terms of sample amounts, handling time, and waste production in the case of elemental and isotopic characterization in irradiated nuclear fuel samples. Further perspectives of this work include the adaptation of the analytical procedure to other fission products and actinides of interest present in nuclear samples as well as the application of isotope dilution for elemental characterization. These analytical developments could be of interest other fields where isotope ratio measurements are required.
3 4 5 6 7 8 9 10 11 12 13 14 15 16 17 18 19 20 21 22 23 24 25 26 27 28 29 30 31 32 33 34 35 36 37 38 39 40 41 42 43 44 45 46 47 48 49 50 51 52 53 54 55
References
(1) Spent nuclear fuel assay data for isotopic validation. State-of-the-art Report. Nuclear Energy Agency, Nuclear Science, NEA/NSC/WPNCS/DOC (2011) 5, 2011.
(2) San-Felice, L.; Eschbach, R.; Bourdot, P. Nucl. Technol. 2013, 184, 217–232. (3) Chartier, F.; Aubert, M.; Pilier, M. Fresenius J. Anal. Chem. 1999, 364, 320-327.
(4) Garcia Alonso, J.I.; Sena, P.; Arbore, P.; Betti, M.; Koch, L. Fresenius J. Anal. Chem. 1995, 10, 381-393.
(5) Kim, J.S.; Jeon, Y.S.; Park, S.D.; Ha, Y.K.; Song, K. Nuclear Eng. Technol., 2015, 47, 924-933.
(6) Sharp, N.; Ticknor, B.W.; Bronikowski, M.; Nichols, T.; McDonough, W.F.; Mignerey, A.; Beals, D. J. Radioanal. Nucl. Chem. 2017, 311, 801-808.
(7) Kim, C.S.; Kim, C.K.; Martin P.; Sansone U. J. Anal. Atom. Spectrom. 2007, 22, 827-841. (8) Vadja, N.; Törvenyi, A.; Kis-Nenedek, G.; Kim, C.K. Radiochim. Acta 2009, 97, 9-16. (9) Isnard, H.; Brennetot, R.; Caussignac, C.; Caussignac, N.; Chartier, F. Int. J. Mass Spectrom. 2005, 246, 66-73.
(10) Isnard, H.; Granet, M.; Caussignac, C.; Ducarme, E.; Nonell, A.; Tran, B.; Chartier F. Spectrochim. Acta Part B 2009, 64, 1280–1286.
(11) Gourgiotis, A.; Granet, M.; Isnard, H.; Nonell, A.; Gautier, C.; Stadelmann, G.; Aubert, M.; Durand, D.; Legand, S.; Chartier, F. J. Anal. At. Spectrom., 2010, 25, 1939-1945.
(12) Granet, M.; Nonell, A.; Favre, G.; Chartier, F.; Isnard, H.; Moureau, J.; Caussignac, C.; Tran, B., Spectrochim. Acta B, 2008, 63, 1309-1314.
(13) Isnard, H.; Aubert, M.; Blanchet, P.; Brennetot, R.; Chartier, F.; Geertsen, V.; Manuguerra F. Spectrochim. Acta B 2006, 61, 150-156.
(14) Moureau, J. ; Granet, M. ; Chartier, F. ; Favre, G. ; Isnard, H. ; Nonell, A. J. Anal. At. Spectrom. 2008, 23, 1538-1544.
(15) Guéguen, F.; Nonell, A.; Granet, M.; Favre, G.; Isnard, H.; Chartier, F.; J. Anal. At. Spectrom. 2010, 25, 201-205.
(16) Rodrıguez-Gonzalez, P. ; Epov, V.N. ; Pecheyran, C. ; Amouroux, D. ; Donard, O.F.X. Mass Spectrom. Rev. 2012, 31, 504–521.
(17) Gunther-Leopold, I.; Kivel, N.; Waldis, J.K.; Wernli B. Anal. Bioanal. Chem 2008, 390, 503-510
(18) Günther-Leopold, I.; Kobler Waldis, J.; Wernli, B.; Kopajtic, Z. Int. J. Mass Spectrom. 2005, 242, 197-202.
(19) Guéguen, F.; Nonell, A.; Isnard, H.; Vio, L.; Vercouter, T.; Chartier, F. J. Anal. At. Spectrom. 2015, 30, 443-452.
(20) Guéguen, F.; Nonell, A.; Isnard, H.; Vio, L.; Chartier, F. Talanta 2017, 162, 278-284 (21) Gourgiotis, A.; Manhès, G.; Louvat, P.; Moureau, J.; Gaillardet, J. J. Anal. At. Spectrom. 2015, 30, 1582-1589.
(22) Krupp, E.M.; Donard, O.F.X. Int. J. Mass Spectrom 2005, 242, 233-242. (23) Tanner, M.; Gunther, D. Anal. Chim. Acta 2009, 633, 19-28.
(24) Pitois, A.; De las Heras, L.A.; Betti, M. Int. J. Mass Spectrom. 2008, 270, 118–126. (25) Vio, L.; Crétier G.; Chartier, F.; Geertsen, V.; Gourgiotis, A.; Isnard, H.; Morin P.; Rocca, J.L. J. Anal. At. Spectrom. 2012, 27, 850-856.
(26) Vio, L.; Crétier, G.; Chartier, F.; Geertsen, V.; Gourgiotis, A.; Isnard, H.; Rocca, J.L. Talanta 2012, 99, 586-593.
(27) Vio, L.; Martelat, B.; Isnard, H.; Nonell, A.; Chartier, F. Talanta 2018, 176, 582-588. (28) Martelat, B.; Vio, L.; Isnard, H.; Simonnet, J.; Cornet, T.; Nonell, A.; Chartier, F. J. 3 4 5 6 7 8 9 10 11 12 13 14 15 16 17 18 19 20 21 22 23 24 25 26 27 28 29 30 31 32 33 34 35 36 37 38 39 40 41 42 43 44 45 46 47 48 49 50 51 52 53 54
Anal. At. Spectrom. 2017, 32, 2271-2280.
(29) Liu, B.F.; Liu, L.B.; Cheng, J.K. Talanta 1998, 47, 291–299.
(30) Macka, M.; Nesterenko, P.; Andersson, P.; Haddad, P.R. J. Chromatogr. A 1998, 803, 279-290.
(31) Janos, P. Electrophoresis 2003, 24, 1982-1992.
(32) Kuczewski, B.; Marquardt, C.M.; Seibert, A.; Geckeis, H.; Volker Kratz, J.; Trautmann N. Anal. Chem. 2003, 75, 6769–6774.
(33) Ambard, C.; Delorme, A.; Baglan, N.; Aupiais, J.; Pointurier, F.; Madic, C. Radiochim. Acta 2005, 93, 665-673.
(34) Shiri-Yekta, Z.; Nilchi, A.; Yaftian, M.R.; Yousefnia, H. J. Radioanal. Nucl. Chem. 2014, 302, 1143-1150.
(35) Cleveland, J.M. The Chemistry of Plutonium, 2nd ed, American Nuclear Society, 1979. (36) Graser, C.H.; Banik, N.I.; Bender, K.A.; Lagos, M.; Marquardt, C.M.; Marsac, R.; Montoya, V.; Geckeis, H. Anal. Chem. 2015, 87, 9786-9794.
(37) NIST Standard Reference Database 46 v8, NIST Critically Selected Stability Constants of Metal Complexes Database, U.S. Department of Commerce, Washington, DC, 2004. (38) Nebel, E. ; Schwabe, K. Phys. Chem., 1969, 224, 29-50.
(39) Fietzke, J.; Liebetrau, V.; Günther, D.; Gürs, K.; Hametner, K.; Zumholz, K.; Hansteen, T.H.; Eisenhauer, A. J. Anal. At. Spectrom. 2008, 23, 955-961.
(40) Epov, V.N.; Berail, S.; Jimenez-Moreno, M.; Perrot, V.; Pecheyran, C.; Amouroux, D.; Donard, O.F.X. Anal. Chem. 2010, 82, 5652-5662.
(41) Rodriguez-Gonzalez, P.; Epov, V.N.; Pecheyran C.; Amouroux, D.; Donard, O.F.X. Mass. Spectrom. Rev. 2012, 31, 504-521.
(42) Boulyga, S.; Konegger-Kappel, S.; Richter, S.; Sangely, L. J. Anal. At. Spectrom. 2015, 30, 1469-1489.
(43) Jakopic, R.; Aregbe, Y.; Richter, S.; Zuleger, E.; Mialle, S.; Balsley, S.D.; Repinc, U.; Hiess, J. J. Radioanal. Nucl. Chem. 2017, 311, 1781-1791.
(44) Morgenstern, A.; Apostolidis, C.; Carlos-Marquez, R.; Mayer, K.; Molinet, R. Radiochim. Acta 2002, 90, 81-85.
(45) Vadja, N.; Törvenyi, A.; Kis-Nenedek, G.; Kim, C.K. Radiochim. Acta 2009, 97, 9-16. 3 4 5 6 7 8 9 10 11 12 13 14 15 16 17 18 19 20 21 22 23 24 25 26 27 28 29 30 31 32 33 34 35 36 37 38 39 40 41 42 43 44 45 46 47 48 49 50 51 52 53 54 55
Table1: 235U/238U, 234U/238U and 236U/238U isotope ratios obtained on two uranium isotopic standards (IRMM 184 and 187) by CE-MC-ICPMS. Two different methods of data treatment (linear slope regression (LRS) and peak area integration (PAI)) are compared. Mass bias is corrected with the IISSB method using the IRMM 186 reference standard solution. Apex signals of 235U, 234U and 236U are indicated. Standard deviations of the n measurements are expressed at k=2. *a represents the accuracy evaluated by the relative difference between the measured and the reference values of the isotopic standard. Standard deviation of the n measurements are expressed at k=2.
235U/238U 234U/238U 236U/238U IRMM 184 Certified value 0.0072623(22) 0.0000528(31) 0.0000002 Apex signals 40 - 42 mV 0.15 - 0.19 mV - SLR (2σ ‰, a* ‰) n=5 0.0072559 (0.6‰, -0.9‰) 0,0000530 (19.2‰, 3.7‰) - PAI (2σ ‰, a* ‰) n=5 0.0072559 (0.6‰, -0.9‰) 0.0000263 (770‰, 50‰) - IRMM 187 Certified value 0.047325(14) 0.00038700(16) 0.000071965(39) Apex signals 480 - 680 mV 3.9 - 5.4 mV 0.8 - 1.1 mV SLR (2σ ‰, a* ‰) n=5 0.047329 (1.2‰, 0.08‰) 0.0003875 (1.2‰, 1.2‰) 0.0000715 (6.6‰, 6.0‰) PAI (2σ ‰, a* ‰) n=5 0.047345 (1.2‰, 0.4‰) 0.0003838 (2.0‰, 8.2‰) 0.0000603 (67.4‰, -162‰) 3 4 5 6 7 8 9 10 11 12 13 14 15 16 17 18 19 20 21 22 23 24 25 26 27 28 29 30 31 32 33 34 35 36 37 38 39 40 41 42 43 44 45 46 47 48 49 50 51 52 53 54
22
235
U/
238U
234U/
238U
236U/
238U
Spent fuel MOX
TIMS value (uncertainty) 0.001320(3) 0.000261(2) 0.000331(2)
Apex signals 100 - 236 mV 2.0 - 4.5 mV 2.6 - 6.1 mV
CE-MC-ICPMS, LRS (2σ, ‰, b*‰) n=4 0.001318 (1.6‰, -1.5‰) 0.000259 (6.2‰, -7.7‰) 0.000335 (2.6‰, 13‰)
238
Pu/
239Pu
240Pu/
239Pu
241Pu/
239Pu
242Pu/
239Pu
Spent fuel MOX
TIMS value (uncertainty) 0.1164(4) 0.9122(18) 0.3600(8) 0.3543(7)
Apex signals 9 - 14 mV 70 - 105 mV 27 - 42 mV 27 - 42 mV
CE-MC-ICPMS, LRS (2σ ‰, b*‰) n=5 0.1160 (4.2‰, 3.4‰) 0.9122 (0.4‰, 0.04‰) 0.3592 (1.0‰, -2.2‰) 0.3543 (0.8‰, 0.08‰)
Table 2 : Results of uranium and plutonium isotope ratios obtained by CE-MC-ICPMS on a spent nuclear fuel sample. Apex signals for 238Pu,
240
Pu, 241Pu, 242Pu, 235U, 234U and 236U are indicated. *b represents the bias evaluated by the relative difference with the reference values obtained by TIMS after ion exchange resin separation.
ACS Paragon Plus Environment
3 4 5 6 7 8 9 10 11 12 13 14 15 16 17 18 19 20 21 22 23 24 25 26 27 28 29 30 31 32 33 34 35 36 37 38 39 40 41 42 43 44 45 46 47 48 49 50 51 52 53 54 55
“Conventional” protocol *1
New analytical approach by EC-ICPMS-MC
Liquid waste volume 20-50 ml 500 µl
Quantity of elements for one analysis
U 2 µg 4 ng
Pu 500 ng 300 pg
Volume of sample injected *2 25 µl 19 nl
Analysis time (hours) *3 20 6
*1 the conventional protocol consist of a separation step by anion exchange chromatography and off-line measurements by TIMS.4
*2 for concentration of U and Pu in a solution of MOx nuclear fuel samples around 250 ppm and 18 ppm of U and Pu respectively.
*3
including redox cycle, separation and isotope ratio measurements.
Table 3: Comparison of the “conventional” protocol with the new analytical approach developed in this work in terms of waste, quantity of elements, sample volume and analysis time. 3 4 5 6 7 8 9 10 11 12 13 14 15 16 17 18 19 20 21 22 23 24 25 26 27 28 29 30 31 32 33 34 35 36 37 38 39 40 41 42 43 44 45 46 47 48 49 50 51 52 53 54
0
200
400
600
800
1000
1200
1400
1600
1800
2000
30
35
40
45
50
55
60
65
70
75
80
Sig
na
l (
cp
s)
x10
3Time (min)
0
500
1000
1500
2000
2500
3000
33
34
35
36
37
38
Signal
(
cp
s)
Time (min)
Pu(III)
La(III)
Pu(IV)
U(VI)
Lu(III)
Pu(VI)
Am(III)
Pu(V) ?
*
*
ACS Paragon Plus Environment 3 4 5 6 7 8 9 10 11 12 13 14 15 16 17 18 19 20 21 22 23 24 25 26 27 28 29 30 31 32 33 34 35 36 37 38 39 40 41 42 43 44 45 46 47 48 49 50 51 52 53 54 55
0.000
0.005
0.010
0.015
0.020
0
0.2
0.4
0.6
0.8
0
5
10
15
20
25
30
x
Pu
and
x
Am in
tensity (V)
238
U
in
tensit
y (
V)
Time (min)
m/z=238
m/z=239
m/z=241
Am(III)
Pu(VI)
U(VI)
C2
C3
C
u
p
s
w
i
t
c
h
ACS Paragon Plus Environment 3 4 5 6 7 8 9 10 11 12 13 14 15 16 17 18 19 20 21 22 23 24 25 26 27 28 29 30 31 32 33 34 35 36 37 38 39 40 41 42 43 44 45 46 47 48 49 50 51 52 53 54