Demonstration and Implementation of Thermally
Passive Low-Income Housing: A Case Study in Bhuj
by
Emma Nelson
B.S., Massachusetts Institute of Technology (2015)
Submitted to the Department of Mechanical Engineering in partial fulfillment of the requirements for the degree of
Master of Science in Mechanical Engineering at the
MASSACHUSETTS INSTITUTE OF TECHNOLOGY
June 2017
MMAAUMT INS TITUWE
OF TECHNOLOGY
JUN 21
2017
LIBRARIES
ARCHIVES
@
Massachusetts Institute of Technology 2017. All rights reserved.Author ...
Certified by...
Signature redacted
Department of Mechanical Engineering May 12, 2017
Signature redacted
Leon Glicksman Professor of Building Technology and Mechanical Engineering Thesis Supervisor
Accepted by...
Signature redacted
Rohan Abeyaratne Chairman, Department Committee on Graduate Students
Demonstration and Implementation of Thermally Passive
Low-Income Housing: A Case Study in Bhuj
by
Emma Nelson
Submitted to the Department of Mechanical Engineering on May 12, 2017, in partial fulfillment of the
requirements for the degree of
Master of Science in Mechanical Engineering
Abstract
In a 2004 Global Health Risks report, the World Heath Organization identified insuffi-cient protection from extreme heat as one of the primary heath concerns in developing nations. The combination of a harsh environment and the lack of coping resources can lead to cardiovascular and respiratory disease and in some cases, death. Throughout May 2015, an estimated 2,500 Indian citizens lost their lives as a result of deadly heatwaves that topped 46'C. Globally, more than 7,500 deaths were caused by ex-treme heat the same year. Those living in resource-constrained communities without the means to construct substantial housing are the most vulnerable to these harsh weather conditions. As the developing world experiences increasing rapid urbaniza-tion, an energy gap, and frequent heatwaves due to climate change, there is a critical need for new construction techniques that can regulate indoor temperature using pas-sive means rather than energy consuming appliances. Though some thermal paspas-sive cooling techniques have been previously researched, they have yet to be successfully implemented in resource-constrained communities.
In collaboration with the Hunnarshala Foundation, an NGO located in Bhuj, Gu-jarat, India, this research seeks to bridge the gap between thermal passive techniques and the application of these methods in low-income housing. This thesis presents recommendations on roof design, wall design, and fan usage based on the results from prototype field work, simulations, and the implementation of pilot homes. With an appropriate building design, measured operative temperatures in pilot homes met the ASHRAE 80% acceptability criteria for more than 60% of operating hours and remained within the IMAC 80% acceptability range 88% of operating hours in the Bhuj climate. In the context of India, the discoveries from this case study in Bhuj can be used to write building guidelines to holistically improve the thermal comfort in Indian homes as a part of India's "Housing for All" program. Beyond the con-text of India, the more than 300 million people living in resource-constrained regions can adopt low-cost passive thermal control techniques to build housing capable of shielding against extreme heat.
Thesis Supervisor: Leon Glicksman
Acknowledgments
This research was sponsored by the MIT Tata Center for Technology and Design. I am deeply grateful to the Tata Center for its financial support and for establishing this unique program that encourages academic research while considering practical applications. I appreciate all the advice from my Tata mentor, Aditya Barve. This has been a truly enriching experience and a great opportunity to work within a global network to solve some of the world's greatest energy, housing, health, water, agricultural, and environmental challenges.
I would like to thank Professor Glicksman for his encouragement and guidance
throughout this research. It has been a wonderful learning experience to have his mentorship.
To all the members of the Hunnarshala Foundation, I sincerely appreciate your dedication and enthusiasm in making this research possible. It has been a privilege to work with you. Thank you, Mr. Tejas Kotak, the Director of Research at Hunnar-shala, for all your hospitality and invaluable support in this research endeavor. Thank you, Pradip Rangani, the Bhuj Project Manager for this research, for facilitating all the fieldwork.
Thank you to the entire MIT Building Technology Faculty and Staff for creating this rigorous and collaborative environment to pursue challenging academic research.
A special thanks to Professor Ochsendorf. I am truly appreciative for your
consulta-tion on structural design. To my colleagues in the Building Technology Lab, thank you for your constructive criticism, advice, and technical expertise. I would specif-ically like to thank Johnathan Kongoletos. It has been wonderful collaborating on this research project. I am truly grateful for all your help throughout the challenging travels/field visits.
To my family, words could never articulate the profound gratitude I feel for your unconditional encouragement, support, and love that has allowed me to pursue op-portunities including this research. Thank you for taking a chance 18 years ago and adopting/welcoming me into an extraordinary life.
Contents
1 Introduction
1.1 Bhuj: A Case Study . . . .
1.2 Government of India Housing for All Program
1.3 Thermally Passive Housing Design . . . . 1.3.1 Heat Avoidance . . . .
1.3.2 Earth-Air Heat Exchanger . . . .
1.3.3 Ventilation . . . .
1.3.4 Evaporative Cooling . . . .
1.3.5 Air Movement . . . .
1.3.6 Thermal Mass and Insulation . . . . .
1.3.7 Radiant Cooling . . . . 1.4 Design for Emerging markets. . . . .
1.5 Existing Designs and Research in Bhuj . . . .
1.5.1 Next Steps . . . .
1.6 Scope of Research . . . .
2 Defining Thermal Comfort and Performance Metrics
2.1 H eat Stress . . . .
2.2 Adaptive Thermal Comfort Standards . . . .
2.3 Peak Temperatures and Phase Lags . . . .
3 Field Experiment Setup
3.1 Inform al Hom e . . . . 27 . . . . 30 . . . . 31 . . . . 33 . . . . 33 . . . . 34 . . . . 35 . . . . 35 . . . . 36 . . . . 37 . . . . 38 . . . . 39 . . . . 41 . . . . 48 . . . . 50 51 52 55 57 59 59
3.2 Prototype Test Chambers . . . .
3.3 Housing for All Homes . . . .
4 Performance of Existing and Proposed Roof Types
4.1 Test Chamber Results and Discussion . . . . 4.2 Pilot Roofs Results and Discussion . . . .
4.2.1 Temperature Data . . . .
4.2.2 Perception Survey Results . . . .
5 Wall Design
5.1 Role of Diurnal Shifts . . . .
5.2 Role of Wall Insulation . . . .
5.2.1 Wall Insulation Changes on the North and South Test Chamber W alls . . . .
5.2.2 Comparisons of Test Chamber with Fully Insulated and Ex-posed W alls . . . .
5.3 Effects of Wall Color . . . .. . . .
5.4 Recommendations for Wall Design . . . .
6 Integration
6.1 Simulation Parameters . . . . 6.1.1 Roof Thermal Model . . . .
6.1.2 Wall Thermal Model . . . .
6.1.3 Boundary Conditions . . . .
6.2 Num erical Solver . . . .
6.3 Comparison of Measured Data with Simulations . . . .
6.4 R esults . . . .
6.4.1 Simulation Results: 2.4m by 2.4m by 2.4m Rooms .
6.4.2 Simulation Results: 5m by 5m by 2.4m Rooms . . .
6.4.3 Designs Considering Bhuj Winter Conditions . . . .
6.5 Recommendations . . . . 123 . . . . . 123 . . . . . 126 . . . . . 130 . . . . . 133 . . . . . 138 . . . . . 140 . . . . . 144 . . . . . 144 . . . . . 148 . . . . . 154 . . . . . 158 61 67 77 78 89 89 97 99 99 105 105 106 114 120
7 Effects of Ceiling Fans on Thermal Comfort 159
7.1 Ceiling Fans . . . . 159
7.2 Ceiling Fan Case Study in Bhuj . . . . 160
7.3 Methodology . . . . 162
7.3.1 Field Experiment Parameters . . . . 162
7.3.2 Simulation Parameters . . . . 166 7.4 Performance Metric . . . . 174 7.5 R esults . . . . 175 7.5.1 Field Experiments . . . . 175 7.5.2 CFD Simulations . . . . 180 7.6 Recommendations. . . . .. . . . 196 8 Conclusion 199 8.1 Thermally Passive Design Recommendations . . . . 199
8.1.1 Roof Design . . . . 199
8.1.2 Wall Design . . . . 205
8.1.3 Use of Ceiling Fan . . . . 207
8.2 Recommendations for Future Work . . . 209
8.2.1 Refining Thermal Autonomous Housing in Extreme Heat Cli-m ates. . . . . 209 8.2.2 Housing Design Adaption for Thermal Control in Cold Climates 211
A Tables 213
List of Figures
1-1 Average Annual Surface Temperature Map (World Climate Maps, 2007) 28
1-2 India Absolute Maximum Temperature Map (Tom Di Liberto, 2015) . 29
1-3 Bhuj 2015 Informal Settlements . . . . 31
1-4 Relationship Between Air Movement, Relative Humidity, and Upper
Bound Thermal Comfort Dry Bulb Temperature (Khedari et al., 2000) 36
1-5 Qualitative Mapping of Observed Design with Climate Strategies for
Case Study Buildings 1-7 (Gradillas, 2015) . . . . 42
1-6 Single-Room Dwelling with 15cm Thick Solid Concrete Masonry Unit (CMU) Walls and a Bare Asbestos Cement Corrugated Sheet Roof
(G radillas, 2015) . . . . 43
1-7 Single-Room Dwelling with 23cm Thick Uninsulated Compressed
Sta-bilized Earth Block (CSEB) Walls and 12cm Thick RCC Slab Roof
(G radillas, 2015) . . . . 43
1-8 A Stand-Alone Two-Room Dwelling with 15cm Thick Uninsulated CMU
Walls and a Single-Layer Mangalore Pattern Tile Roof (Gradillas, 2015) 43
1-9 Ceiling Temperatures for Existing Vernacular Homes, Buildings 1, 6,
and 7 Adapted from Analysis and Design for Thermally Autonomous
Housing in Resource-Constrained Communities (Gradillas, 2015) . . 44
1-10 Interior South Wall, Ceiling, Air Gap, and Ambient Air Temperature
Sensor Locations in Five 2015 Test Chambers with Insulated Walls and
1-11 Average Temperature Deviations from Daily Outdoor Ambient Air
Temperature Peaks for Two Test Chambers Fitted with a Single Layer
Roof and a Double Layer Roof (Gradillas, 2015) . . . . 48
1-12 Average Temperature Deviations from Nightly Outdoor Ambient Air Temperature Minimums for Two Test Chambers Fitted with a Single Layer Roof and a Double Layer Roof (Gradillas, 2015). . . . . 49
2-1 Heat Stress Color Map of Bhuj Weather Data in 2015 . . . . 53
2-2 Wet Bulb Globe Temperature (WBGT) Heat Stress Thresholds for Unacclimatized Individuals (NIOSH, 2017) . . . . 54
2-3 ASHRAE, EN-15251, and IMATC Adaptive Thermal Comfort Stan-dards and Comparison . . . . 56
3-1 Exterior View of Informal Home (Photo Courtesy of Bradley Tran) 60 3-2 Interior Ambient Air and Air Gap Sensor Placement in Informal Home 60 3-3 Five 2.4m by 2.4m by 2.4m Test Chambers with 0.23 cm Thick Sand-stone Walls Fitted with Different Roofs . . . . 63
3-4 Mean Radiant Temperature Measuring Apparatus . . . . 64
3-5 RI Single layer Tin Roof . . . . 64
3-6 R2 Reinforced Concrete Cement (RCC) Roof . . . . 64
3-7 R3 Reinforced Concrete Cement (RCC) Roof with Air Gap and Ther-m ocol Insulation . . . . 65
3-8 R4 I Double layer Tin Roof with Air Gap Radiant Barrier and Bubble W rap Insulation . . . . 65
3-9 R5 I Double layer Tin Roof with Air Gap Radiant Barrier and Mud R oll Insulation . . . . 65
3-10 Test Chamber Sensor Locations . . . . 66
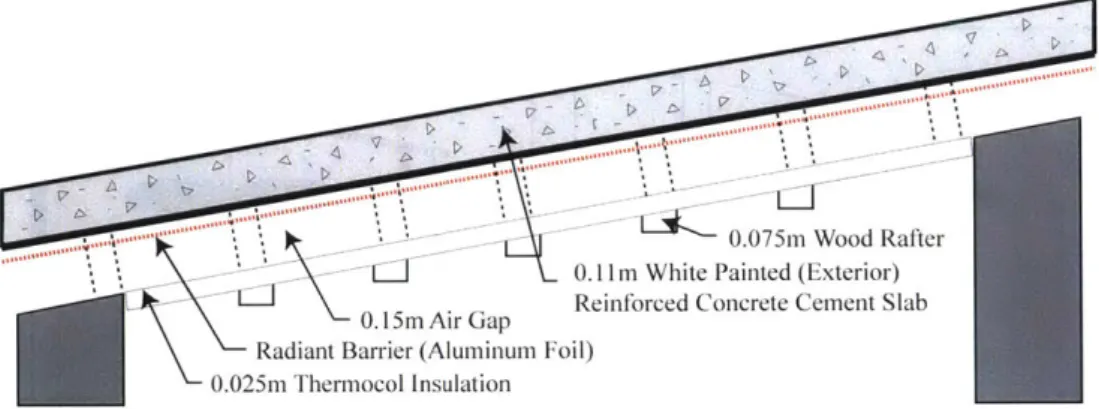
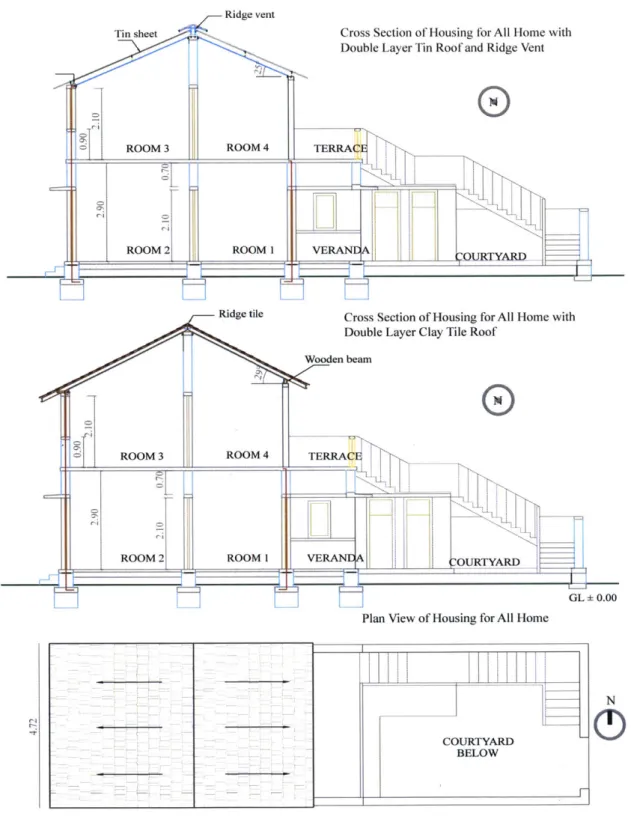
3-11 Cross Section and Plan View of Housing for All Homes (Image Adapted from Hunnarshala 2016) . . . . 69
3-13 Roof Design and Sensor Locations in Home with a Double Layer Clay
Tile, Radiant Barrier, and Mud Roll Insulated Roof (HI) Image Adapted
from Hunnarshala 2016 . . . . 71
3-14 Roof Design and Sensor Locations in home with a Double Layer Clay Tile, Radiant Barrier, and Wood Ceiling Roof (H2) Image Adapted
from Hunnarshala 2016 . . . . 72
3-15 Roof Design and Sensor Locations in Home with a Double Layer Tin,
Radiant Barrier, and Wood Ceiling Roof (H3) Image Adapted from
Hunnarshala 2016 . . . . 73
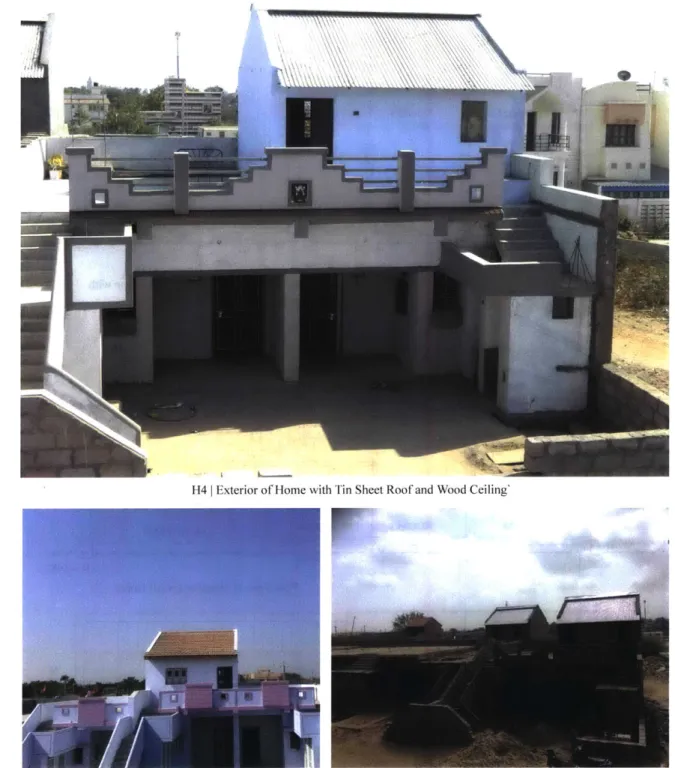
3-16 Roof Design and Sensor Locations in Home with a Double Layer Tin,
Radiant Barrier, and Bubble Wrap Insulation Roof (H4) Image Adapted
from Hunnarshala 2016 . . . . 74
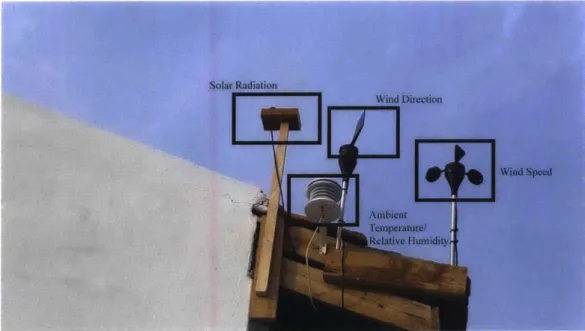
3-17 Weather Station Placed on the Southern Border of the Housing for All
S ite . . . . 7 5
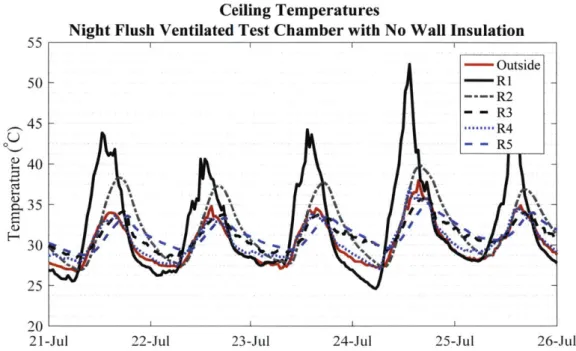
4-1 Transient Ceiling Temperatures for Test Chambers with Roof Types
R 1-R 5 . . . . 79
4-2 Color Map of Temperature Differences Between Ceiling and Outdoor
A m bient A ir . . . . 80
4-3 Transient Air Temperatures for Test Chamber with Roof Types R1-R5 82
4-4 Color Map of Temperature Differences Between the Indoor and
Out-door Am bient Air . . . . 83
4-5 Transient Interior South Wall Temperatures for Test Chamber with
Roof Types R1-R5 . . . . 84
4-6 Color Map of Temperature Differences Between Interior South Wall
and Outdoor Ambient Air . . . . 85
4-7 Transient Operative Temperatures for Test Chamber with Roof Types
R 1-R 5 . . . . 86
4-8 Color Map of Temperature Differences Between Indoor Operative and
4-9 Radiant Temperatures Plotted as a Function of Ceiling Temperatures
for Roofs R1-R2 . . . . 88
4-10 Radiant Temperatures Plotted as a Function of Ceiling Temperatures
for Roofs R1-R5 . . . . 88
4-11 Test Chamber Average Interior Temperature Deviations from Daily
Maximum Temperatures . . . . 89
4-12 Transient Indoor Air Temperatures in the Housing for All and Informal
Settlem ent Hom es . . . . 91
4-13 Transient Indoor Air Temperatures in the Housing for All Homes . . 91
4-14 Transient Ceiling Temperatures in the Housing for All Homes . . . . 92
4-15 Transient Interior South Wall Temperatures in the Housing for All Homes 93 4-16 Transient Operative Temperatures in the Housing for All Homes . . . 94
4-17 Interior Transient Air, South Wall, Ceiling and Operative
Tempera-tures for Existing Vernacular Homes . . . . 95
4-18 Housing for All and Existing Homes: Average Interior Air, South Wall, Ceiling, and Operative Temperature Deviations from Peak Ambient
Outdoor Air Temperatures . . . . 96
4-19 Percentage of Time in which Temperatures Exceeded the IMAC and
ASHRAE Upper 80% Acceptability Comfort Limits . . . . 97
5-1 Comparison of Measured Outdoor Air Temperatures during March,
a Period Characterized by 20'C Diurnal Shifts, and June, a Period
Characterized by 10'C Diurnal Shifts . . . . 101
5-2 Bhuj: Monthly Average Number of Cloudy, Sunny, and Overcast Days
(M eteoblue, 2014) . . . . 101
5-3 Comparison of Measured Relative Humidities During March, a Period
Characterized by 20'C Diurnal Shifts, and June, a Period
5-4 Comparison of Measured Night Flush Ventilated T2 Test Chamber Indoor Air Temperatures during March, a Period Characterized by
20'C Diurnal Shifts, and June, a Period Characterized by 10'C Diurnal
Shifts.. ... ... ... ... 102
5-5 Comparison of Measured Night Flush Ventilated T2 Test Chamber
Inside South Wall Temperatures during March, a Period Characterized
by 20'C Diurnal Shifts, and June, a Period Characterized by 10'C
D iurnal Shifts . . . . 103
5-6 Changes in Average Measured Indoor Air and South Wall
Tempera-tures Between March, a Period with 20'C Diurnal Shifts, and June, a
Period with 10'C Diurnal Shifts . . . . 104
5-7 Changes in Average Peak Temperature Deviations from Outdoor
Am-bient Air Temperatures for Indoor Air and South Wall Temperatures Between March, a Period with 20'C Diurnal Shifts, and June, a Period
with 10'C Diurnal Shifts . . . . 104
5-8 Measured South Wall Temperatures Before and After Wall Insulation
R em oval . . . . 106
5-9 Measured Operative Temperatures Before and After Wall Insulation
R em oval . . . . 107
5-10 Average Interior Wall, Operative, and Air Temperature Deviations
from Peak Outdoor Temperatures for Test Chambers Where Wall
In-sulation was Removed on June 20, 2015 . . . . 107
5-11 Maximum Interior Temperatures as a Function of Maximum Outdoor
Ambient Air Temperatures for 2015 Single Layer CGI Roof Test bers with Wall Insulation and 2016 Single Layer CGI Roof Test
Cham-bers without W all Insulation . . . . 110
5-12 Maximum Interior Temperatures as a Function of Maximum Outdoor
Ambient Air Temperatures for 2015 Test Chambers with Wall Insu-lation (T1, T2, T4, and T5) and 2016 Test Chambers without Wall Insulation (R2-R5) . . . .111
5-13 Average Interior Temperature Deviations from Daily Maximum for 2015 (Wall Insulation) and 2016 Test Chambers (No Wall Insulation) 112 5-14 Percent of Time in which Test Chamber Operative Temperatures
Re-main with in the ASHRAE and IMAC Comfort Standards . . . . 113
5-15 Infrared Images of Building Interior Illustrating the Effects of
Exte-rior Wall Colors on Indoor Environments (Images Courtesy of John K ongoletos) . . . 115
5-16 Black Tarp Covering the South Wall of a Monitored Housing for All
Home with a Muli-Layer Mangalore Tile and Mud Roll Insulated Roof 116
5-17 Transient Wall, Air, and Radiant Temperatures for Home with Black
Plastic Placed on the South Wall . . . . 116
5-18 South Wall Temperatures as a Function of Outside Temperatures . . 117
5-19 Radiant Temperatures as a Function of Outside Temperatures . . . . 118
5-20 Indoor Air Temperatures as a Function of Outside Temperatures . . 119 5-21 Average Temperatures and Precipitation for Bhuj, Gujarat, India
(Me-teoblue, 2014) . . . . 121
6-1 Geometry and Boundary Conditions for Test Chamber Control Volume 125
6-2 Single Layer Tin Roof Simulations Boundary Conditions and Geometry 128
6-3 RCC Roof Simulations Boundary Conditions and Geometry . . . 131
6-4 Radiant Barrier Placement Schedules for a Control Roof, Constant Radiant Barrier Roof, and Alternating Radiant Barrier Roof . . . 132
6-5 Boundary Conditions for Transient Wall Model . . . 134
6-6 Iterative Scheme for Calculating Interior Temperatures in Thermal Model139
6-7 Comparison Between Simulated and Measured Indoor Air
Tempera-tures for a 2.4m by 2.4m by 2.4m Test Chamber with a Single Layer
C G I R oof . . . . 141
6-8 Comparison Between Simulated and Measured Ceiling Temperatures
6-9 Comparison Between Simulated and Measured South Wall Tempera-tures for a 2.4m by 2.4m by 2.4m Test Chamber with a Single Layer
C G I R oof . . . . 143
6-10 March Transient Interior Air, Operative, South Wall, and Ceiling
Tem-peratures for a Control Single Layer Tin Roof and Modifications to the
Tin Sheet Roof, Wall Insulation R = Im2K/W Wall Absorptivity =
0 .75 . . . . 146
6-11 March Average Deviation from Nightly minimums and Daily
Maxi-mums of Simulated 2.4m by 2.4m by 2.4m Test Chambers with Vari-ous CGI Roof Types, Wall Insulation Resistivities, and Exterior Wall
A bsorptivities . . . . 147
6-12 March Transient Interior Air, Operative, South Wall, and Ceiling
Tem-peratures for a Control RCC and Modifications to the RCC Sheet Roof,
Wall Insulation R = lm2K/W, Wall Absorptivity = 0.75 . . . . 149
6-13 March Average Deviation from Nightly minimums and Daily
Maxi-mums of Simulated 2.4m by 2.4m by 2.4mTest Chambers with Various RCC Roof Types, Wall Insulation Resistivities, and Exterior Wall
Ab-sorptivities . . . . 150
6-14 March Average Deviation from Nightly minimums and Daily Maxi-mums of Simulated 5m by 5m by 2.4 m Test Chambers with Various
CGI Roof Types, Wall Insulation Resistivities, and Exterior Wall
Ab-sorptivities . . . . 152
6-15 March Average Deviation from Nightly minimums and Daily
Maxi-mums of Simulated 5m by 5m by 2.4 m Test Chambers with Various RCC Roof Types, Wall Insulation Resistivities, and Exterior Wall
Ab-sorptivities . . . . 153
6-16 February Transient Interior Air, Operative, South Wall, and Ceiling
Temperatures for a Control Single Layer Tin Roof and Modifications
to the Single Layer Tin Roof, Wall Insulation R = Om2K/W, Wall
6-17 February Transient Interior Air, Operative, South Wall, and Ceiling
Temperatures for a Control RCC Slab Roof and Modifications to the
RCC Slab Roof, Wall Insulation R = Om2K/W, Wall Absorptivity =
0.75 . . . . 156 6-18 February Average Interior Temperature Deviations from Daily Peaks
and Nightly Minimums for 5m by 5m by 2.4m Rooms with Various
CGI Roof Types, Wall Insulation R = Om2K/W, Wall Absorptivity =
0 .75 . . . . 157 6-19 February Average Interior Temperature Deviations from Daily Peaks
and Nightly Minimums for 5m by 5m by 2.4m Rooms with Various
RCC Roof Types, Wall Insulation R = Om2K/W, Wall Absorptivity
= 0.75 . . . . 157
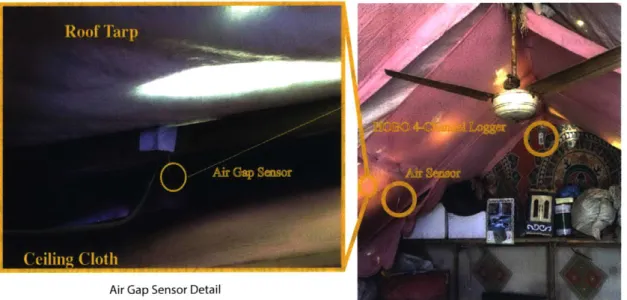
7-1 Informal Home with a Multilayer Tarpaulin, Cloth Roof and Ceiling
F an . . . . 160
7-2 Temperature Map of the Temperature Difference Between the Outside
and the Air Adjacent to the Ceiling . . . . 161
7-3 Single Layer Corrugated CGI Roof . . . . 163
7-4 Exterior View of Test Chamber with Single Layer Roof (Photo
Cour-tesy of John Kongoletos) . . . . 163
7-5 Double Layer Roof with Air Gap, Radiant Barrier, and Bubble Wrap
Insulation . . . . 164
7-6 Exterior View of Test Chamber with Double Layer Roof (Photo
Cour-tesy of John Kongoletos) . . . . 164
7-7 Sensor Placements for Test Chamber with a Single Layer Roof . . . . 165 7-8 Sensor Placements for Test Chamber with a Double Layer Roof . . . 166
7-9 September 16, 2016 Transient Wall and Ceiling Temperatures for a
Test Chamber with a Single Layer CGI Roof . . . . 168
7-10 September 16, 2016 Transient Wall and Ceiling Temperatures for a
7-11 September 16, 2016 Transient Wall and Ceiling Temperatures for a
Test Chamber with a Double Layer Insulated Roof . . . . 170
7-12 CFD Geometries for Test Chamber Simulations . . . . 171 7-13 CFD Geometries for Single Story Housing for All Home with an RCC
R oof . . . . 172
7-14 CFD Geometries for the Housing for All Archytpe with a Peaked Roof 174
7-15 Changes in Temperature Stratification for the Test chamber with a
Single Layer tin Sheet Roof . . . . 176
7-16 Changes in Temperature Stratification for the Test Chamber with a
Double Layer Insulated Roof . . . . 177
7-17 Changes in Average Peak Temperatures as a Result of Ceiling Fan
Usage ... ... 178
7-18 Changes in Average Peak Temperatures as a Result of Ceiling Fan
U sage . . . . 178
7-19 Effects on Thermal Comfort due to Ceiling Fan Use in the Test
Cham-ber with a Single Layer Roof . . . . 181
7-20 Effects on Thermal Comfort due to Ceiling Fan Use in the Test
Cham-ber with a Double Layer Roof . . . . 182
7-21 Comparison of Simulation and Field Experiment Results for the Test
Chamber with a Single Layer Roof . . . . 183
7-22 Comparison of Simulation and Field Experiment Results for the Test
Chamber with a Double Layer Roof . . . . 184
7-23 Temperature Contours of Simulated Test Chambers without and with
a C eiling Fan . . . . 185
7-24 Temperature Contours of Simulated Test Chambers with Various Fan
Configurations . . . . 186
7-25 Velocity Along a Horizontal Line Placed 1.5 m Above the Floor in a
Test Chamber with a Single Layer Tin Sheet . . . . 187
7-26 Comparison of the Velocity Profiles Along a Vertical Line in the Center
7-27 Comparison of the Velocity Profiles Along a Vertical line 0.5 m from
the Upright Fan for a Test Chamber with a Single Layer Tin Sheet . 188
7-28 Temperatures Along a Vertical Line in the Center of the Simulated
Test Chamber with a Single Layer Tin Roof . . . . 189
7-29 Temperatures Along a Vertical Line in the Center of the Simulated
Test Chamber with a Double Layer Insulated Roof . . . . 189
7-30 Temperature Contours of Simulated RCC Roof Housing for All Archetype
with Different Fan Configurations . . . . 190
7-31 Velocity Along a Horizontal Line Placed 1.5 m Above the Floor in a
Room with an RCC Roof . . . . 191
7-32 Temperatures Along a Vertical Line in the Center of the Simulated
Housing for All home with an RCC Roof . . . . 191
7-33 Calculated PMV Values for CFD Simulations of Test Chambers and
Homes with RCC Roofs . . . . 192
7-34 Temperature Contours of Simulated Housing for All homes with Peaked
Roofs with Various Fan Configurations . . . . 194
7-35 Average Room Temperatures as a Function of Ceiling Fan Placement 195
7-36 Velocity Profile Along a Vertical Line from the Floor to the Roof Peak 195
7-37 PMV Values for Simulated Housing for All Archetypes with Peaked
R oofs . . . 196
8-1 Percentage of the Data Collection Period (June 17, 2016 to
Decem-ber 30, 2016) in which 2016 Test ChamDecem-ber Operative Temperatures
Exceeded IMAC and ASHRAE 80% Acceptability Limits . . . . 202
B-1 Comparison Between Indoor Air Temperatures in Simulated Test Cham-bers with Full Scale Prototype Test ChamCham-bers with Roof Types R2-R5 220 B-2 Comparison Between Interior Ceiling Temperatures in Simulated Test
Chambers with Full Scale Prototype Test Chambers with Roof Types
B-3 Comparison Between Interior South Wall Temperatures in Simulated Test Chambers with Full Scale Prototype Test Chambers with Roof
List of Tables
1.1 MoHUPA Income Group Definition and Affordability Criteria . . . . 32
2.1 Universal Thermal Comfort Index categorizations of thermal stress . 52
2.2 OSHA: Permissible Heat Exposure Limit Value . . . . 53
2.3 ASHRAE, EN-15251, and IMATC Comfort Standards and Criteria 55
3.1 Thermal Conductivities of Various Insulation Materials . . . . 61
5.1 2015 and 2016 Test Chamber Comparisons . . . . 108
6.1 Independent Variables and Input Parameters in Thermal Simulations 124
6.2 Thermal Properties of the RCC Roof . . . . 130
6.3 Thermal Properties of Simulated Walls . . . . 133
7.1 Boundary Conditions for a Room with a Single Layer Roof . . . . 167
7.2 Boundary Conditions for a Room with an RCC Roof . . . . 168
7.3 Boundary Conditions for a Room with a Double Layer Insulated Roof 169
7.4 Summary of Simulation Cases . . . . 173
8.1 Performance Rankings of Test Chamber Roof Types Based Operative
Temperatures Peak Deviations . . . . 201
8.2 Performance Rankings of Housing for All Homes Based Operative
Tem-peratures Peak Deviations . . . . 203
8.4 Performance Rankings of Wall Treatments Based on Simulated Op-erative Temperature Deviations from Outdoor Ambient Temperature
P eaks . . . . 207
8.5 Home with a Well Insulated Roof: Performance Rankings of Fan
Lo-cation and Usage Based on PMV Values . . . 208
8.6 Home with a Single Layer Tin Sheet: Performance Rankings of Fan
Location and Usage Based on PMV Values Assuming a 90%RH . . . 209
8.7 Performance Rankings of Simulated CGI Roof Types Based Operative
Temperatures Peak Deviations . . . 210
A.1 Inputs for Calculating PMV of Field Experiment Test Chambers at
50% R H . . . . 214
A.2 Inputs for Calculating PMV of Field Experiment Test Chambers at
90% R H . . . . 214
A.3 Inputs for Calculating PMV of Simulated Single Layer Roof Test
Cham-bers at 50% RH . . . . 214
A.4 Inputs for Calculating PMV of Simulated Single Layer Roof Test
Cham-bers at 90% RH . . . . 215
A.5 Inputs for Calculating PMV of Simulated Double Layer Roof Test
Chambers at 50%RH . . . . 215
A.6 Inputs for Calculating PMV of Simulated Double Layer Roof Test
Chambers at 90%RH . . . . 215
A.7 Inputs for Calculating PMV of Simulated RCC Roof Room at 50%RH 216 A.8 Inputs for Calculating PMV of Simulated RCC Roof Room at 90%RH 216 A.9 Inputs for Calculating PMV of Simulated Housing for All Room with
Single Layer Peaked Roof at 50%RH . . . . 216
A.10 Inputs for Calculating PMV of Simulated Housing for All Room with
Single Layer Peaked Roof at 90%RH . . . . 217
A.11 Inputs for Calculating PMV of Simulated Housing for All Room with
A.12 Inputs for Calculating PMV of Simulated Housing for All Room with
Chapter 1
Introduction
In May 2015, an estimated 2,500 Indian citizens lost their lives as a result of a deadly heatwave (the Centre for Research on the Epidemiology of Disasters (CRED), 2015; Bob Kopp, 2015; Buzan and Huber, 2015). Unfortunately, adverse health effects due to inadequate protection against extreme heat occur globally and is among one of the top major health concerns identified by the World Health Organization (World Health Organization, 2010). The combination of a harsh environment and the lack of coping resources can lead to cardiovascular and respiratory disease and in some cases, death (World Health Organization, 2010). For regions that experience high temperatures, there is an increase of 11% mortality when the temperature rises above 40'C (Vijesh
Vasanth Joshi, 2015). With global climate change and average air temperatures
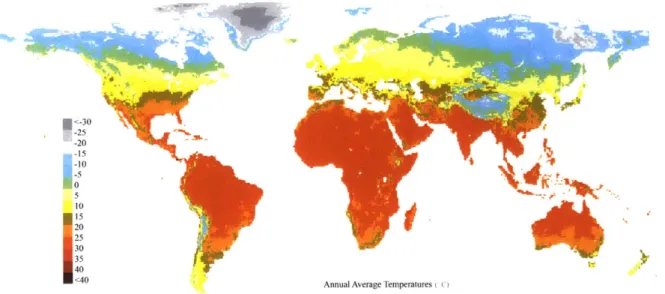
projected to rise 1-3'C within the 21st century (Lori Perkins, 2014; Jackson, 2017), there emerges a need to design housing capable of providing protection in extreme heatwaves. The negative effects of these frequent heatwaves will be predominantly felt in the hot/arid desert and tropic regions where most of the developing nations are located, as shown in Figure 1-1.
Citizens of these regions facing major economic and material constraints are dis-proportionately affected by the extreme heatwaves as many, due to lack of resources, tend to live in housing that provides little to no protection against extreme heat (World Health Organization, 2010). According to a 2011 census, in India alone, an estimated 10 million impoverished households earning less than 100,00ORs ( $1600)
-30 -25 20 -5
I00
-5 30 35 20 25<40 Annual Average Temperatures c)
Figure 1-1: Average Annual Surface Temperature Map (World Climate Maps, 2007) per household per year, (Census Population Data, 2015; Maps of India, 2012; C. Rangarajan et al., 2015) reside in climates considered hot and dry as shown in Figure 1-2.. An estimated 1.25 million of these households would be considered slum house-holds (Indian Agricultural Statistics Institute Research, 2011; Government of India Ministry of Housing and Urban Poverty Alleviation National Buildings Organization,
2013) where a slum is defined as one or a group of individuals living under the same
roof in an urban area, lacking in one or more of the following five amenities
1. "Durable housing (a permanent structure providing protection from extreme
climatic conditions)" (Nolan, 2015).
2. "Sufficient living area (no more than three people sharing a room)" (Nolan,
2015).
3. "Access to improved water (water that is sufficient, affordable, and can be
obtained without extreme effort)" (Nolan, 2015).
4. "Access to improved sanitation facilities (a private toilet, or a public one shared with a reasonable number of people)" (Nolan, 2015).
5. "Secure tenure (de facto or de jure secure tenure status and protection against
Absolute Maximum Temperature (fF)
40 50 60 70 80 90 100 110 120
Figure 1-2: India Absolute Maximum Temperature Map (Tom Di Liberto, 2015)
Given the aforementioned economic and climate challenges, the following research focuses on demonstrating and optimizing thermally passive housing design as a means to improve interior conditions in resource-constrained regions. Using passive thermal controls mitigates energy costs and allows housing solutions to be more accessible even for citizens who do not have a stable connection to electricity. The results and discoveries of this research can be applied to improve housing for not just the impoverished population in India, but also for those in other parts of the world who experience similar socioeconomic and climate challenges and those of a higher income brackets looking to conserve energy.
1.1
Bhuj: A
Case
Study
To study thermally passive design in low-income communities that experience extreme heatwaves, Researchers at the Massachusetts Institute of Technology have been col-laborating and co-designing with a non-government organization (NGO), The Hun-narshala Foundation, located in Bhuj, Gujarat, India. The case study city, Bhuj, exhibits climate conditions associated with hot, arid regions as well as frequent heat-waves. In the context of India, an extreme heat weather condition is declared when
" Temperatures exceed "normal daily historical maximum temperature (30 year
average) by 5YC given those averages are less than 40'C" (Azhar et al., 2014)
" Temperatures exceed "normal daily historical maximum temperature (30 year
average) by 4C given those averages are greater than 40'C" (Azhar et al., 2014)
" "Actual maximum temperature [exceeds] 45'C" (Azhar et al., 2014)
Based on this definition, throughout May to September, Bhuj is very susceptible to dangerous heatwaves as the temperatures frequently exceed 45 C (Gradillas, 2015).
In addition to facing extreme climate challenges, similar to the rest of India, many residents of Bhuj face major economic and resource constraints; an estimated 33 % of the population live in slums (Hunnarshala Foundation, 2016; Gradillas, 2015; Govern-ment of India Ministry of Housing and Urban Poverty Alleviation National Buildings Organization, 2013) as defined by the United Nations State of the World's Cities report. Bhuj is located near the epicenter of a 2001 earthquake which left hundreds of thousands homeless (Emily Buchanan and Bhasker, 2011). Since the earthquake, there have been efforts to rebuild the city. Today, as a part of a national housing program, the Slum Free Bhuj Project sets goals to improve the housing situations of impoverished families.
Currently, the low-income homes in Bhuj do not provide proper means to protect against extreme heat. Based on observation during site visits, residents often use corrugated asbestos concrete sheets, corrugated tin sheets, plastic sheets, cloth, and thin thatch for roofing materials. Uninsulated sandstone bricks, concrete, rock, and
stabilized earth bricks are used for the walls as shown in Figure 1-3. Residents may use ceiling fans as a low-cost means to provide some relief from the extreme heat. Only 6-9% of Indian households own air conditioners as many cannot afford a unit (Barry and Davenport, 2016).
Figure 1-3: Bhuj 2015 Informal Settlements
1.2
Government of India Housing for All Program
The Slum Free Bhuj project falls under a national housing initiative in India. In response to the housing challenges facing India, the Ministry of Housing and Ur-ban Poverty Alleviation (MoHUPA) has enacted a program "Housing for All" to provide housing for 20 million slum households by 2022. This program includes a technology submission to incorporate innovative technologies and materials, design green buildings using natural resources, and incorporate earthquake/disaster resistant technologies and designs (Ministry of Housing and Urban Poverty Alleviation, 2007). In alignment with this mission to provide affordable, durable, protective housing, MIT and the Hunnarshala Foundation, are currently collaborating to holistically im-prove design, construction, and integration of housing to address the issue of thermal comfort and reduce heat-related health risks. The proposed designs stress achieving thermal comfort through passive means as a way of reducing energy costs in resource-constrained locations where most citizens cannot afford the luxury of air conditioning. For households that can afford air conditioning, achieving thermal comfort through
passive means can help reduce energy costs and the urban heat island effect. In the context of India, these new building designs and guidelines are meant to serve the Economically Weak Sections (EWS), Low Income Group (LIG), and the Middle In-come Group (MIG) as defined by MoHUPA. Table 1.1 shows MoHUPA's definitions of various socioeconomic groups. MoHUPA asserts that affordable housing should not exceed four times a family's gross annual income (Deepak Parkh et al., 2008; The Hindu Business Line, 2012; Anshul Dhamija, 2009)
Table 1.1: MoHUPA Income Group Definition and Affordability Criteria
Income Annual Income Affordable Living Area per Household
Group (Rs) Given Income(m2)
EWG 100,000Rs 28-46
LIG 100,000-200,000 46-55
MIG 300,000-1,000,000 55-110
MIT and Hunnarshala seek to apply thermally passive/low-energy housing design that fits within the resource, economic, and social constraints of many low-income communities.
Beyond the context of India, the results and designs from this research will be used to write improved building guidelines that can be applied in other regions that face similar climate and economic challenges. Approximately 1 billion of the world's population live in slums (United Nations, 2016). Of the 1 billion slum dwellers, an estimated 300 million live in Sub-Saharan Africa (World Health Organization, 2009) in addition to the 10 million households that live in the extreme heat regions of India (Indian Agricultural Statistics Institute Research, 2011; Government of India Ministry of Housing and Urban Poverty Alleviation National Buildings Organiza-tion, 2013; Census Population Data, 2015). According to the United Nations,"The livelihoods of more than 1 billion people in some 100 countries are threatened by desertification. Nearly 1 billion of the poorest and most marginalized people will be the most severely affected by desertification" (United Nations, 2010; National Geo-graphic Society, 2017). With global climate change, this vulnerable population will
need housing that can protect from forecasted heatwaves. Furthermore, residents in more stable economic situations stand to benefit from thermally passive housing. The International Energy Agency estimates, "in hot climates, the energy savings poten-tial from reduced energy needs for cooling are estimated at between 10% and 40%"
(International Energy Agency, 2013).
1.3
Thermally Passive Housing Design
Thermal comfort through passive means or low energy means has been well researched and tested. In order to achieve thermal autonomy, "the percent of occupied time over a year where a thermal zone meets or exceeds a given set of thermal criteria through passive means only" (Brendon Levitt et al., 2013), early research first looked to an-cient vernacular architecture as a way to achieve thermal autonomy and reduce energy consumption (Gradillas, 2015). Through this study, researchers compiled qualitative data linking building characteristics and ambient conditions (B. Rudofsky, 1964; A.
Rapoport, 1969). The Manual of Tropical Housing and Building builds on
previ-ous Design with Climate research to suggest practicing night flush ventilation with proper thermal mass, heat avoidance, and evaporative cooling as the main methods for passive thermal cooling (Koenigsberger, 0. H., 1974). To quantitatively analyze the effectiveness of these methods, researchers conducted field experiments and sim-ulations, studying heat avoidance, use of earth air tunnels, ventilation, evaporative cooling, air movement, proper insulation combined with thermal mass, and radiant cooling. The following sections review past research on thermal autonomy or low energy thermal controls and assess the application of these methods in India.
1.3.1
Heat Avoidance
Heat avoidance attempts to achieve thermal comfort by reducing the heat absorp-tion from the sun. Many structures do this by shading areas from direct sunlight and incorporating radiant barriers. Examples of ways to reduce exposure to the sun include vegetation shading, constructing houses with common walls, window shade,
and building orientation. Additionally, visible and shortwave reflective coatings, such as white paint and white tiles, can be used to reduce the amount of incoming solar heat flux. In practice, the incorporation of white tiles in roof design can lower indoor air temperatures, by as much as "5.1'C...[when] compared to a regular room without any [roof] treatment" (Nahar et al., 2003). The method of heat avoidance is often combined with other passive cooling techniques such as proper ventilation and build-ing materials. Current communities in Bhuj practice this method of heat avoidance
by building communities with shared walls, thereby reducing solar gains on exterior
walls. However, heat avoidance methods have yet to be applied to roofs in Bhuj.
1.3.2
Earth-Air Heat Exchanger
The earth-air heat exchanger takes advantage of the earth's cool temperatures. One of the earliest applications of this method can be seen in ancient Iranian architecture (Bisoniya et al., 2013). Atmospheric air is blown through a tunnel or tube under-ground. By the time, the air reaches the house, the ground has already cooled the air below ambient temperatures. Earth air tubes have been installed in some buildings in Belgium, Switzerland, Germany, France, and India (Santamouris and Kolokotsa,
2013). In the France case study, "It is reported that the used exchanger improves
con-siderably comfort conditions during summer, while it keeps the indoor temperature of
the house below 270C without the use of air conditioning systems" (Santamouris and
Kolokotsa, 2013). Another experiment done in Western India showed earth-air heat exchangers "gives cooling in the range of 8.0-12.7'C for the flow velocities of 2-5m/s (Bisoniya et al., 2013). Though the earth-air heat exchangers show potential, they also have many design challenges such as optimizing size and ensuring cleanliness of the tube, making this method more difficult and expensive to implement. This method of cooling also requires the necessary ground space which, in the context of Bhuj, is not available. In addition, due to the hot arid climate conditions in Bhuj, the ground does not act as an effective heat sink at shallow depths.
1.3.3
Ventilation
Successful ventilation in hot arid climates flushes out hot air during the night, bring-ing in the cooler night air. The literature studies focus on operation schedules and optimizing natural buoyancy-driven ventilation. In hot arid regions, it is best to take advantage of the cool night temperatures to flush out the room's warm air and cool the thermally massive components of the building. Windows and wall openings should be placed at heights and locations to encourage the rising hot air to evacuate the room. "Most of the studies conclude that the use of night ventilation in free float-ing buildfloat-ings may decrease the next day peak indoor temperature [by] up to 3'C" (Santamouris and Kolokotsa, 2013).
1.3.4
Evaporative Cooling
Evaporative cooling occurs when air moves "over a wetted surface,
[causing]
some ofthe water to evaporate. This evaporation results in a reduced temperature" (Santa-mouris and Kolokotsa, 2013). Proposed methods range from water atomizers, thin film waterfalls, and evaporative roofs to porous materials. Simulations and optimiza-tion of some of these evaporaoptimiza-tion methods show a temperature decrease of up to 8 C
(Santamouris and Kolokotsa, 2013). The evaporative roof was tested with prototype chambers in hot-arid Rajasthan, India. Soaked gunny bags were placed on top of the roof for evaporative cooling. The room's ambient temperature decreased due to the heat transfer from the air required to evaporate the moisture in the soaked gunny bags. On average, the temperature of the 1.28m by 6.1m by 1.10m test chamber with
the evaporative cooling roof was 13.20C cooler than the control test chamber with
an untreated RCC slab roof (Nahar et al., 2003). When this temperature decrease is extrapolated for a regular building, a fall in temperature of about 5 0C can be
ex-pected. This method, however, required 50L/m2 of water per day (Gradillas, 2015;
Nahar et al., 2003) as well as the arduous work of constantly preparing and replacing evaporative roof covers. Consequently, this method does not fit in the context of
1.3.5
Air Movement
The correlation between air movement and perceived thermal comfort has been well
studied. Air movement helps enhance the human body's ability to release heat
through evaporative cooling and convective heat transfer. In a study done in the "hot dry climates of Northern India and Iraq," researchers showed that "the presence of air movement can be equivalent to a reduction in temperature of as much as 4'C" (Nicol, 2004). Figure 1-4 shows results from a study done in Thailand, where the lines drawn in the figure represent frontiers of equal comfort levels. This study helps illus-trate that increasing air velocities, such as those imparted by a fan, help to increase the Dry Bulb Temperature, temperature measurements shielded from radiation and moisture, at which occupants are comfortable.
100 A* velocities (m/s 90 2_ 80 - -* * A a 70 A 0 A A -2 60 . 50 40 26 28 30 32 34 36 38 40
Dry bulb temperature (C)
Figure 1-4: Relationship Between Air Movement, Relative Humidity, and Upper Bound Thermal Comfort Dry Bulb Temperature (Khedari et al., 2000)
As air velocities rise, humans are comfortable at higher temperatures. However, air movement effects become less pronounced with increased humidity (Khedari et al.,
2000) as the air has a finite capacity for holding moisture. Other case studies such as those in Pakistan (Nicol, 2004) draw similar conclusions.
Studies have also examined the air movement acceptability limits at given oper-ative temperatures and humidity levels (Candido et al., 2010), and researchers con-clude that ceiling fan use can improve thermal comfort (Mallick, 1996; Ho et al.,
2009; Arens, Edward et al., 2009; Schiavon and Melikov, 2008). Studies in Australia
go so far to conclude that in "low to middle-income housing, features such as ceiling fans.. .are an integral part of [housing] design" due to their low-cost (Soebarto and
Bennetts, 2014).
The prior research, however, does not explore the possibility that air movement from a ceiling fan can increase ambient indoor temperatures. Many informal set-tlements found in resource-constrained communities use tin sheet roofs that easily become greater than 10'C warmer than the ambient outdoor temperatures. To mit-igate risks that come with extreme heat, residents use ceiling fans as a low energy means to improve thermal comfort. Existing studies conclude that air movement pos-itively correlates with thermal comfort because it enhances the body's natural way of releasing heat through evaporative cooling and convection. However, in the context of many developing world homes, this approach may be sub optimal. As the ceiling transfers heat to the air directly underneath the ceiling, the ceiling fan circulates this hot air throughout the living space and increases the temperature at lower levels of the room surrounding the occupants.
1.3.6
Thermal Mass and Insulation
Often, the use of insulation and thermal mass are combined to achieve thermal com-fort. Insulation keeps the desired indoor temperature cooler by reducing heat transfer from the inside environment to the outside environment. Thermal mass acts as a way to dampen temperature amplitudes and delay external heat stresses. For example, in the desert region, a house's thermal mass can "store" the cool night temperatures and keep the house cool during the day. Previous experiments by Pearlmutter and Meir in Israel's Negev desert have shown that proper wall design can improve thermal
comfort (Pearlmutter and Meir, 1995). Givoni confirms these findings by conducting experiments with various test chambers in which wall construction was the indepen-dent variable. The results showed temperature amplitudes could drop from 66% of the outside swing temperature to about 33% of the outdoor swing temperature (Givoni, 2011). Another study in Morocco, showed, with proper thermal mass and insulation,
"the discomfort hours based on an acceptable thermal comfort zone of 16 C-280C
[were] reduced by 62%" (Mastouri et al., 2017).
1.3.7
Radiant Cooling
Radiant cooling releases heat from the building envelope through longwave radiation heat transfer to the sky. Given minimal cloud coverage and low humidity, the sky tem-peratures can often be 20-30'C cooler than outdoor ambient temtem-peratures (Balcomb,
1992). Though longwave radiation cooling occurs constantly, "the radiant balance
is negative only during the night" (Givoni, 1991) due to solar heat gains during the day counteracting longwave radiation cooling. Several roof concepts incorporating radiation cooling have been developed. One "concept of radiant cooling is ... a heavy and highly conductive roof [such as a concrete slab] exposed to the sky during the night" (Givoni, 1991). The concrete "stores" the night coolness for part of the day. Though this roof is effective at cooling during the night, it offers little protection from solar heat gains during the day.
Another roof concept, "The Skytherm" by Harold Hay, follows the same thermo-dynamic principle as the thermally massive highly conductive roof. This roof consists of a steel panel as the highly conductive component and water bags underneath as the thermally massive component. Removable insulation panels are used to protect from solar heat gains during the day (Hay, 1978). Unfortunately, "the conventional horizontally rolling (insulation) panels have.. .been expensive and mechanically unre-liable" (Clack and Cook, 1989). Alternatively, rather than modifying roofs to harness longwave radiation cooling for passive thermal controls, residents can place a ceiling fan under the ceiling of a radiantly cooled roof to mix the cold air directly beneath the ceiling throughout the room. Experiments have shown that this method can
decrease ambient temperatures by 3-50C on cloudless nights (Givoni, 1991). This
method however, still does not address the issue of solar heat gains during the day. Researchers are now developing and testing surface treatments that have low ab-sorptivity in the visible and shortwave spectrum emitted by the sun, but high emis-sivity in the longwave spectrum. This reduces the net heat gains during the day while allowing for nocturnal radiant cooling (Zhai et al., 2017). "However, converting a standard roof that's in good condition into a cool roof can be expensive" (De-partment of Energy, 2017) and out of the budget of those in resource-constrained communities. Painting a surface white is a more economic way of reducing the posi-tive radiant heat flux throughout the day. However, the coating becomes less effecposi-tive once dirt covers the white surface
1.4
Design for Emerging markets.
Though many solutions exist for achieving thermal comfort through low energy or passive means, those solutions have not been successfully implemented in constrained emerging markets. Dissemination of technology and new ideas in resource-constraints regions presents a challenge for many innovators. Oftentimes, the technol-ogy designed for customers in wealthy countries are introduced into emerging markets with simple modifications. However, "what works for the rich won't automatically receive wide acceptance in emerging markets" (Govindarajan et al., 2013).
Design for development requires
" Extensive research on available resources, the supply-chain, and user needs in
a specific region.
" Meeting the affordability criteria.
" Social acceptance.
The understanding of available materials in the case of designing housing for the developing world is especially important. In a research project on wall construction
in Gujarat, India, Porst found that many bricks used in India did not meet specified strength standards set by the Indian masonry code. Consequently, new models needed to be made for assessing seismic performances (Christopher Porst, 2015). Similarly, when engineering thermally passive controlled homes, initial research on material
inventory and behavior must be conducted.
Many housing construction materials commonly used in countries like the US might not be readily available in emerging markets or outside the affordability range of many residents. As a result, researchers have examined the reuse of available byproducts from manufacturing or agricultural processes for the purpose building construction. This encompasses using recycled materials for insulation as a way to reduce construction material cost and to start practicing more sustainable methods. Some examples of this research include a Portuguese research group that found similar thermal conductivities between mineral wool and insulation fabricated from textile waste (Briga-Sa et al., 2013). In Vilnius Gediminas Technical University and Oak Ridge National Laboratories, studies have found insulation constructed from straw to have conductivities as low as 0.04 W/mK (Vejeliene, 2012; Tav Commins and Jeff Christian, 1998). Other experiments used sunflower stalks as insulation (Binici et al., 2014).
Outside academia, companies, and projects, such as Green Roof, ModRoof, and
Resilient Modular Systems
[RMS],
have begun reusing recycled materials such asTetra Paks, coconut fibers, and reused plastic for roof construction (ReMaterials,
2017; Tetra Pak et al., 2014; Mendoza, 2014; WE DESIGNS LLC, 2014). This method
of using recycled and available materials has also been applied in India. Section 1.5 describes inital research in using material ubiquitous and indigenous to India
In addition to being cognizant of the local economy and available resources, the designed housing solution must fit within the social constraints of the region (Rogers,
2003). This involves understanding the socioeconomic aspirations of the end users as
well as proper identification of early adopters. "How potential adopters view a change agent affects their willingness to adopt new ideas" (Rogers, 2003). In this Bhuj case study, users aesthetic tastes are considered and input from respected community
leaders is incorporated into the design. Subsequent demonstration and testing of the design illustrate the advantages of the proposed concepts.
1.5
Existing Designs and Research in Bhuj
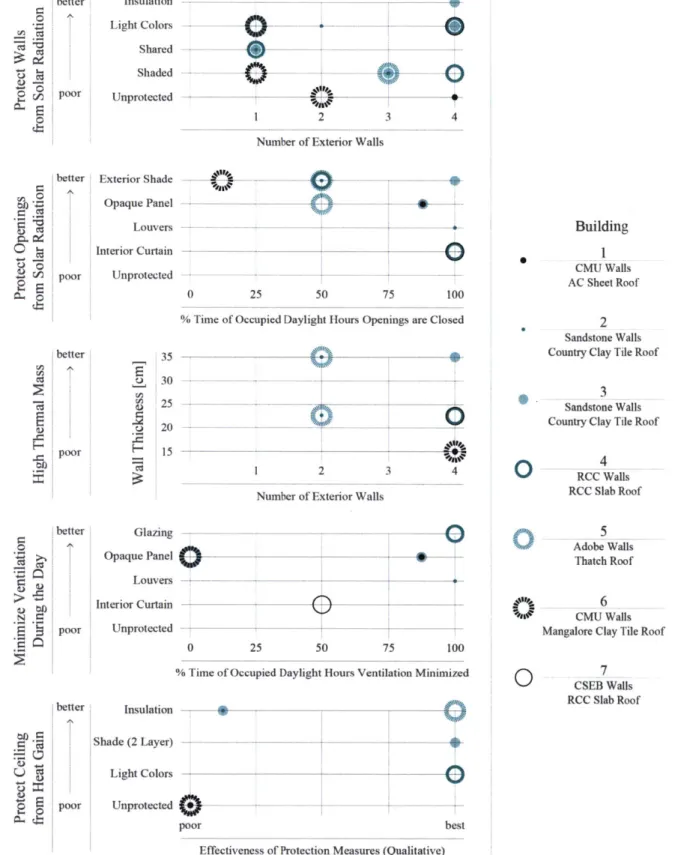
Initial work on passive cooling methods using locally available and recycled materi-als has been conducted in Bhuj. Madeline Gradillas collected temperature data on existing homes to establish a baseline of existing designs and their thermal comfort performance (Gradillas, 2015). Onset HOBO@ Four Channel Analogue External
Temp/RH Data Loggers
(U23-00)
were placed to measure wall, ceiling, and ambientair temperatures in 30-minute increments in seven buildings. The monitored buildings included those found in low-income communities and those found in middle-income and wealthier communities. Building performance and design characteristics are sum-marized in Figure 1-6, where Buildings 1-7 are ranked by level of effectiveness, y-axis and frequency, x-axis.
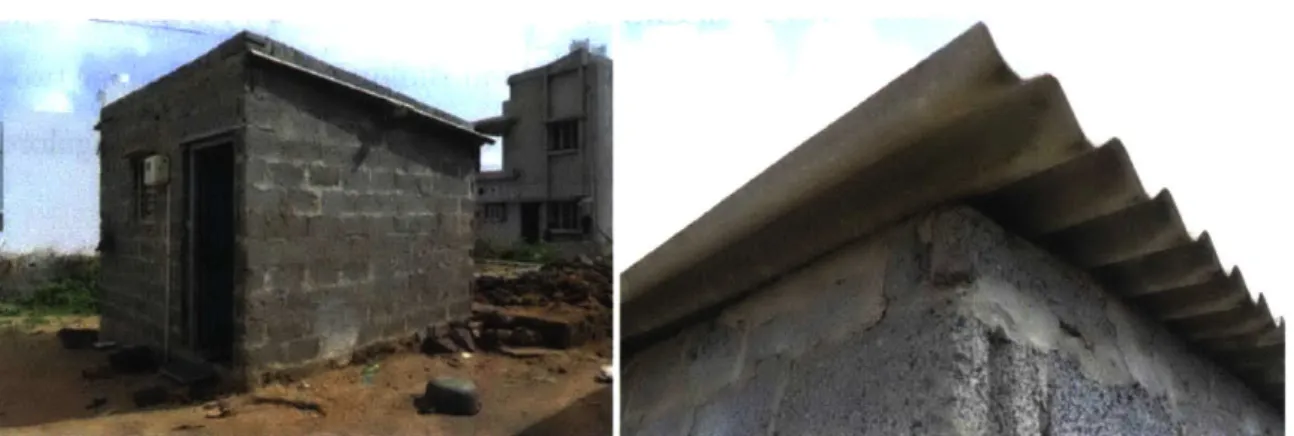
Figure 1-6, Figure 1-7 and Figure 1-8 show three of the seven monitored homes. Building 1 (Figure 1-6) is a single-room dwelling with 15cm thick solid concrete ma-sonry unit (CMU) walls and a bare asbestos cement corrugated sheet roof. Building
6 (Figure 1-7) is a single-room dwelling with 23cm thick uninsulated compressed
sta-bilized earth block (CSEB) walls and 12cm thick reinforced cement concrete (RCC) slab roof. Building 7 (Figure 1-8) is a stand-alone two-room dwelling with 15cm thick uninsulated CMU walls and a single-layer Mangalore Pattern tile roof.
Temperature data from existing occupied buildings showed the need for improved roof design. During the data collection period, the outdoor temperature peaked at 40'C. However, ceiling temperatures of the low-income homes reached up to 50'C. Oftentimes, these dwellings do not incorporate passive cooling design methods such as reflective coatings to reduce solar heat flux, radiant barriers, insulation, and ven-tilation. Thus, the exposed roofs are not protected from the intense solar radiation. Figure 1-9 shows the ceiling temperatures for Building 1, a single-room dwelling with 15cm thick solid CMU walls and a bare asbestos cement corrugated sheet roof,
Build-0 0 5) 0 better poor better poor better I poor better Glazing Opaque Panel Louvers Interior Curtain poor Unprotected better Insulation Shade (2 Layer) Light Colors poor Unprotected Insulation Light Colors Shared Shaded Unprotected Exterior Shade Opaque Panel Louvers Interior Curtain Unprotected 2 3 4
Number of Exterior Walls
*14
---
0
0 25 50 75 100
% Time of Occupied Daylight Hours Openings are Closed
4Ink
1 2 3 4
Number of Exterior Walls
0 25 50 75 100
% Time of Occupied Daylight Hours Ventilation Minimized
poor best
Effectiveness of Protection Measures (Qualitative)
2
Sandstone Walls Country Clay Tile Roof
Sandstone Walls Country Clay Tile Roof
0
RCC Walls RCC Slab Roof0
Adobe Wails Thatch Roof 6 CMU Walls Mangalore Clay Tile Roof0
7CSEB Walls RCC Slab Roof
Figure 1-5: Qualitative Mapping of Observed Design with Climate Strategies for Case Study Buildings 1-7 (Gradillas, 2015)
Building CMU Wails AC Sheet Roof 35 30 25 20 15 0 .~ .~ U* :0
Figure 1-6: Single-Room Dwelling with 15cm Thick Solid Concrete Masonry Unit
(CMU) Walls and a Bare Asbestos Cement Corrugated Sheet Roof (Gradillas, 2015)
Figure 1-7: Single-Room Dwelling with 23cm Thick Uninsulated Compressed Stabi-lized Earth Block (CSEB) Walls and 12cm Thick RCC Slab Roof (Gradillas, 2015)
Figure 1-8: A Stand-Alone Two-Room Dwelling with 15cm Thick Uninsulated CMU Walls and a Single-Layer Mangalore Pattern Tile Roof (Gradillas, 2015)