HAL Id: hal-01875845
https://hal-univ-lemans.archives-ouvertes.fr/hal-01875845
Submitted on 17 Sep 2018
HAL is a multi-disciplinary open access
archive for the deposit and dissemination of
sci-entific research documents, whether they are
pub-lished or not. The documents may come from
teaching and research institutions in France or
abroad, or from public or private research centers.
L’archive ouverte pluridisciplinaire HAL, est
destinée au dépôt et à la diffusion de documents
scientifiques de niveau recherche, publiés ou non,
émanant des établissements d’enseignement et de
recherche français ou étrangers, des laboratoires
publics ou privés.
Liquid Chromatography Coupled to Evaporative
Light-Scattering Detector
Florence Hubert, Céline Loiseau, Françoise Ergan, Gaëlle Pencréac’h, Laurent
Poisson
To cite this version:
Florence Hubert, Céline Loiseau, Françoise Ergan, Gaëlle Pencréac’h, Laurent Poisson. Fast Fatty
Acid Analysis by Core-Shell Reversed-Phase Liquid Chromatography Coupled to Evaporative
Light-Scattering Detector. Food and Nutrition Sciences, Scientific Research, 2017, 08 (12), pp.1051 - 1062.
�10.4236/fns.2017.812077�. �hal-01875845�
http://www.scirp.org/journal/fns ISSN Online: 2157-9458
ISSN Print: 2157-944X
DOI: 10.4236/fns.2017.812077 Dec. 4, 2017 1051 Food and Nutrition Sciences
Fast Fatty Acid Analysis by Core-Shell
Reversed-Phase Liquid Chromatography
Coupled to Evaporative Light-Scattering
Detector
Florence Hubert, Céline Loiseau, Françoise Ergan, Gaëlle Pencréac’h, Laurent Poisson
*Laboratoire Mer, Molécules, Santé (EA 2160) Le Mans Université, IUT de Laval, Laval, France
Abstract
A high-performance liquid chromatography analysis method with an evapor-ative light-scattering detector has been developed for the separation and quantitative analysis of free fatty acids in biological matrices. Coshell re-versed-phase high-performance liquid chromatography separation of 10 free fatty acids is achieved within 10.5 min using a methanol/water (0.05% trifluo-roacetic acid) eluent gradient. After optimization, the drift tube and nebuliza-tion temperature of the evaporative light-scattering detector was set at 35˚C, ni-trogen flow-rate at 1.1 standard liter per minute and column temperature at 25˚C. All calibration curves showed good regression (r2 > 0.9975). A validation procedure following the International Conference on Harmonisation guidelines was implemented to certify the method. Relative standard deviations did not exceed 1.5% and 4.25% for repeatability and reproducibility respectively.
Keywords
Free Fatty Acids, HPLC, Evaporative Light-Scattering Detector, Core-Shell Technology, Method Validation
1. Introduction
The development of fast high-performance liquid chromatography (HPLC) me-thods for routine analysis is of interest for a rapid identification and quantifica-tion of free fatty acids (FFAs).
Gas chromatography (GC) is obviously the most commonly used method for FFA analysis. However, before analysis, FFAs must be methylated to obtain fatty
How to cite this paper: Hubert, F., Loi-seau, C., Ergan, F., Pencréac’h, G. and Poisson, L. (2017) Fast Fatty Acid Analysis by Core-Shell Reversed-Phase Liquid Chro- matography Coupled to Evaporative Light- Scattering Detector. Food and Nutrition Sciences, 8, 1051-1062.
https://doi.org/10.4236/fns.2017.812077 Received: September 11, 2017
Accepted: November 30, 2017 Published: December 4, 2017 Copyright © 2017 by authors and Scientific Research Publishing Inc. This work is licensed under the Creative Commons Attribution International License (CC BY 4.0).
http://creativecommons.org/licenses/by/4.0/
DOI: 10.4236/fns.2017.812077 1052 Food and Nutrition Sciences
acid methyl esters which is tedious and time consuming. Moreover, there is a risk of structural degradation during this methylation process since it requires high temperature under alkaline conditions. For this reason, accuracy of GC analysis can be greatly affected when unstable molecules like long chain polyun-saturated FFAs need to be quantified [1]. Compared to GC, HPLC analysis can be conducted at low temperature thus limiting the risk of heat degradation of the samples. Moreover, FFAs can be directly assayed without any laborious prepara-tion step [2]. HPLC is also convenient because it is simple to implement and generally provides good reproducibility. The main drawback of using HPLC for FFA analysis when using standard UV detector is that only FFAs with double bonds can be detected. Moreover, the use of a non-absorbing solvent is required, thus limiting the choice of the mobile phase. To overcome this drawback, dif-ferent alternative detection systems can be implemented such as an evaporative light-scattering detector (ELSD). ELSD is a universal detector only sensitive to the mass of the vaporized analyte and is not limited by light absorption charac-teristics of the individual components and/or eluent nature [3]. In ELSD, the solvent is evaporated and the only requirement is a low volatility of the com-pounds as compared to the mobile phase. It also allows stable baselines even when multi-solvent gradients are used. Nevertheless, for an optimal operation, several ELSD parameters need to be tuned even though ELSD optimization is seldom reported in literature.
In recent years, HPLC columns have also been considerably improved. For example, core-shell silica particles have been increasingly used for highly effi-cient separation with fast flow rate and relatively low back pressure [4].
To the best of our knowledge, HPLC methods specifically dedicated to fatty acids in their free form are rarely described. An overview of the recent published papers is presented in Table 1. A wide range of equipment including HPLC columns and detectors are used. Even though some of these methods show clear advantages, they are either quite expensive or not fast enough, or present a low resolution.
The purpose of this study is to propose an HPLC method which is at a time, fast, simple and accurate for determination and quantification of numerous FFAs that can be found in different lipids and food matrices. Thus, the devel-oped HPLC method takes into account the advantages of both core-shell tech-nology and ELSD. Firstly, this study focuses on optimization of ELSD operating parameters, namely drift tube and nebulization temperatures and nitrogen flow rate. Column temperature was also optimized in order to reach maximal peak resolution. Then, the method was validated following the International Confe-rence on Harmonisation (ICH) guidelines [10].
2. Materials and Methods
2.1. Chemicals, Reagents and Standards
DOI: 10.4236/fns.2017.812077 1053 Food and Nutrition Sciences Table 1. Principal advantages and drawbacks of HPLC methods dedicated to free fatty acid analysis.
ref Column Detector Advantages/drawbacks
[5]
Hypersil Gold aQ (150 × 4.6 mm; 5 µm)
UV detector 210 nm
Reasonable run time (15 min) Standard UV detector
Short Ultraviolet wavelength near or below cut-off of many solvents Only short chain fatty acids can be analyzed
Hypersil Gold aQ (150 × 4.6 mm; 3 µm)
[6] Chromolith Performance-Si (100 × 4.6 mm) ELSD detector
Monolithic column allows high flow rates due to low back pressure
Complex mixtures of lipid classes can be separated. Not convenient for the separation of free fatty acid species
[7] (200 × 4.6 mm; 5 µm) Hypersil BDS C8 Fluorescence detector Fatty acids need to be derivatized Very high sensitivity
[8] RP Ascentis Express column (150 × 2.1 mm; 2.7 μm) mass spectrometer-ESI Triple quadrupole
Molecule identity can be obtained Run time of 20 min
May need UHPLC chromatographic system capable to undergo high back pressures
[9] Acclaim C30 column (250 × 3 mm; 3 µm) Charged Aerosol Corona ultra RS Detector.
Poor resolution
More sensitive than ELSD
(Millipore, Molsheim, France). All solvents were HPLC gradient grade and pre-viously filtered on nylon membrane (0.45 µm). Methanol was obtained from Fisher Scientific (Illkirch, France). Trifluoroacetic acid (TFA) was obtained from Sigma Aldrich (Saint-Quentin-Fallavier, France). Arachidic acid (C20:0), behen-ic acid (C22:0), palmitbehen-ic acid (C16:0) and laurbehen-ic acid (C12:0) were purchased from TCI (Antwerp, Belgium). Heptadecanoic acid (C17:0), octanoic acid (C8:0), myristic acid (C14:0) and stearic acid (C18:0) were obtained from Sigma Aldrich (Saint-Quentin-Fallavier, France). Linoleic acid (C18:2) was purchased from Acros Organics (Illkirch, France), oleic acid (C18:1) was purchased from Fisher Scientific (Illkirch, France). Docosahexaenoic acid (C22:6) was purchased from Larodan (Limhamn, Sweden). Sunflower Lecithin (Lipoid H 100) was kindly donated by Lipoid (Ludwigshafen, Germany).
2.2. Reversed-Phase HPLC Assays
After dissolution of FFAs in a methanol:TFA (0.05%) solution, 5 µL of sample were injected in an Agilent HPLC system 1260 Infinity (Les Ulis, France) equipped with a quaternary pump, an online degasser, an autosampler, a UV detector set at 205 nm and an ELSD (PL-ELS 2100, Varian, Palo Alto, Califor-nia). Column temperature control was operated by a specific thermostated mod-ule working with Peltier heating and cooling. Temperature accuracy given by
DOI: 10.4236/fns.2017.812077 1054 Food and Nutrition Sciences
Agilent is of 0.8˚C. Separation was performed with an Agilent Poroshell 120 EC-C18 column (50 × 4.6 mm, 2.7 μm). To achieve separation, a binary solvent gradient elution was optimized. Solvents were water with 0.05% TFA (solvent A) and methanol with 0.05% TFA (solvent B). The gradient was programmed as follows: 0 - 3.5 min, isocratic 87% B; 3.5 - 7.5 min, linear gradient elution, 87% - 98% B; 7.5 - 9.6 min, isocratic 98% B; 9.6 - 9.7 min, linear gradient elution, 98% - 87% B; 9.7 - 11.5 min, isocratic 87% B. Solvent flow rate was set at 1 mL/min.
2.3. Method Validation
Method validation was conducted according to ICH guidelines [10]. In this frame, the reliability of the HPLC method was established through its specificity, calibration, limit of detection (LOD), limit of quantification (LOQ), accuracy, precision, robustness and carry-over
2.3.1. Specificity
Sunflower lecithin, that does not contain FFAs, was chosen as the lipid matrix to investigate specificity.
Standard FFA solution (2 mM) was analysed in the absence and in the pres-ence of sunflower lecithin (20 mM) to ensure that FFAs and lecithin would not interfere with each other. Results were analyzed considering the peak area and the retention time (RT) of each FFA.
2.3.2. Calibration
Stock solutions of each FFA (100 mM) were prepared separately in a methanol: TFA (0.05%) solution. To plot the calibration curves, a fatty acid mixture solu-tion (10 mM of each FFA) was prepared by mixing together 200 µL of each FFA from stock solutions. Calibration curves were established according to peak area as a function of each FFA concentration (0.5, 1, 1.5, 2, 2.5, 3, 3.5, 4, 4.5, 5, 5.5 and 6 mM) prepared in a methanol:TFA (0.05%) solution.
2.3.3. Limit of Detection (LOD) and Limit of Quantification (LOQ)
For each FFA, the values of LOD and LOQ were determined using Agilent Chemstation Software. They correspond to the lowest concentrations giving rise to a particular signal-to-noise ratio. A signal-to-noise ratio between 3 or 2:1 is generally considered acceptable for estimating LOD and for the LOQ a typical signal-to-noise is 10:1.
2.3.4. Accuracy
The accuracy of an analytical method expresses the closeness between the ex-pected value and the value found. It is expressed by calculating for each compo-nent the percent of recovery (% R). In this case, to evaluate the accuracy of the proposed method, successive analyses (n = 6) of 2 mM standard FFA solution spiked in sunflower lecithin were carried out. Results were determined using the following formula:
DOI: 10.4236/fns.2017.812077 1055 Food and Nutrition Sciences
2.3.5. Precision
Precision was evaluated in terms of repeatability and reproducibility. Intra-assay precision (repeatability) and inter-assay precision (reproducibility) were calcu-lated respectively after six consecutive runs or six consecutive preparations for each studied FFA.
2.3.6. Robustness
Three selected analytical parameters (percentage of water in the mobile phase, flow rate and column temperature) were changed one by one and their effect was observed on each FFA. All assays were performed in triplicate and results were expressed as percentages of recovery.
2.3.7. Carry-Over
Carry-over was assessed by sequential injections of blank samples after a sample containing twice the amount of FFAs found in the highest points of the calibra-tion curves.
3. Results and Discussion
3.1. Optimization of ELSD Parameters
Working with ELSD requires optimization of two parameters: i) drift tube and nebulization temperature, ii) nebulizing gas flow rate [11].
3.1.1. Optimization of Drift Tube and Nebulization Temperature
According to manufacturer recommendations, drift tube and nebulizer temper-atures should be similar and should not exceed solvent boiling point (70˚C for methanol). Thus, the temperature range chosen for this study was from 25˚C to 55˚C. With increasing temperatures, an increase in peak area is observed, more due to a peak broadening than to a peak height increase. However, peak height is an important factor since peaks insufficiently high do not emerge from the base-line and therefore molecules cannot be detected. Peak symmetry is another cri-terion to take into account since a good symmetry indicates the absence of co-elution. In this frame, a peak symmetry in the range of 0.8 - 1.2 is considered as suitable. Thus, peak height and symmetry are used to determine the best set-ting. For optimization of drift tube and nebulization temperature, nebulizing gas flow rate was kept constant at 1.1 Standard Liter per Minute (SLM).
Presumably due to its short chain length, octanoic acid is not detected by ELSD in the concentration range studied whatever the temperature. Bravi et al.
[12] showed that ELSD is only suitable for the analysis of C12 - C22 FFAs since they are not evaporated at this drift tube temperature. FFAs with shorter chain length are not detected since they have been evaporated totally or partially with the solvent. This is the main drawback when working with ELSD.
As seen on Figure 1, peak height increases when the temperature rises up from 25˚C to 55˚C except for four fatty acids: lauric acid (C12:0), myristic acid (C14:0), arachidic acid (C20:0) and behenic acid (C22:0). The behaviors of ara-chidic and behenic acids are quite intriguing and the attempts of explanation
DOI: 10.4236/fns.2017.812077 1056 Food and Nutrition Sciences Figure 1. Effect of drift-tube and nebulization temperature on peak height obtained with a column temperature of 25˚C and a nitrogen flow rate of 1.1 SLM.
rather presumptive. Nevertheless this is not really crippling to consider an opti-mized setting for drift tube and nebulization temperature.
Above 50˚C, lauric acid is no longer detected. However, up to 35˚C, peak height is stable for lauric and myristic acid. As the peak height remains high for arachidic and behenic acids despite a decrease, it appeared that the temperature of 35˚C constituted the best compromise for an optimal detection of the 10 con-sidered FFAs. It has also been checked that all FFAs have a peak symmetry value above 0.8 or very close to 0.8 at 35˚C. Drift tube and nebulization temperature was thus set at 35˚C.
3.1.2. Nitrogen Flow Rate Adjustment
Influence of nitrogen flow rate was then studied with drift tube and nebulization temperature set at 35˚C. According to manufacturer recommendations, nitrogen flow rate should be set between 1 to 2 SLM. Nebulization gas flow rate deter-mines the size of droplets formed during nebulization. The highest signal is gen-erally obtained with the lowest gas flow rate [13].
In terms of peak height, the best ELSD response is at 1.1 SLM for all FFAs ex-cept for C12:0, C20:0 and C22:0 (Figure 2). As far as C12:0 is considered, in-creasing the flow rate above 1.1 SLM does not significantly improve peak height. In case of C20:0 and C22:0, the response, even though not the highest at 1.1 SLM, is high. Hence, the flow rate was kept at 1.1 SLM.
3.2. Optimization of Column Temperature
According to manufacturer recommendations, column temperature and ELSD drift tube temperature have to be close. Nevertheless, the column temperature also affects efficiency of chromatographic separation and to optimize this
para-DOI: 10.4236/fns.2017.812077 1057 Food and Nutrition Sciences
meter, theoretical plate number was considered. Indeed, the higher the theoreti-cal plate number, the better the resolution.
As seen on Figure 3, efficiency decreases when the temperature rises up ex-
Figure 2. Influence of nitrogen flow rate on peak height obtained with a column temperature of 25˚C and a drift tube and nebulization temperature of 35˚C.
Figure 3. Influence of column temperature on theoretical plate number obtained with a drift tube and nebulization temperature of 35˚C and a nitrogen flow rate of 1.1 SLM.
DOI: 10.4236/fns.2017.812077 1058 Food and Nutrition Sciences
cept for C20:0 and C22:0 which have a lower theoretical plate number at 20˚C than at 25˚C. To choose between 20 and 25˚C, the peak resolution between the two worst separated component, C18:2 and C22:6, was considered. Since no dif-ference is observed between the two temperatures, column temperature will be set at 25˚C to be closest to the drift tube temperature.
3.3. Fatty Acid Separation
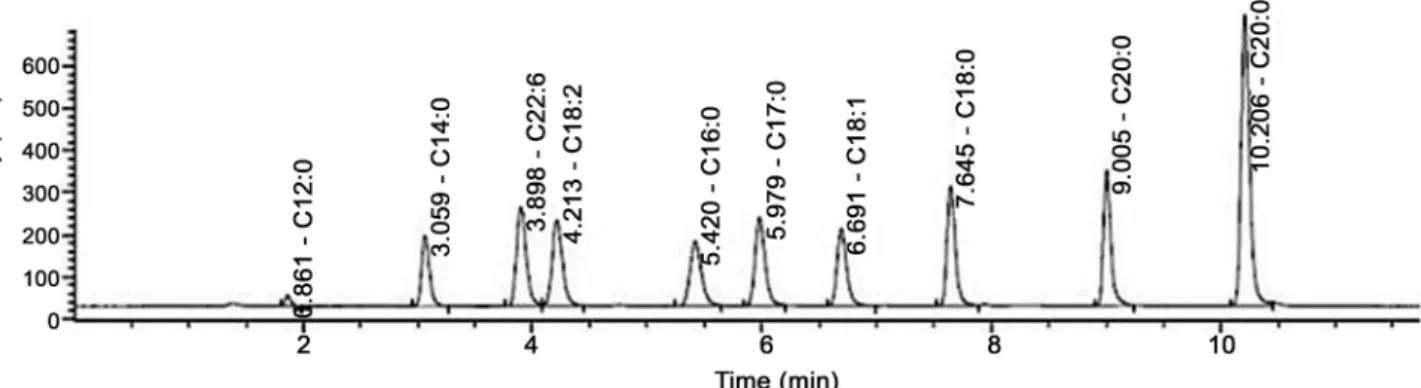
The chromatographic separation of 10 FFAs using ELSD is shown on Figure 4. The elution order is: C12:0, C14:0, C22:6, C18:2, C16:0, C17:0, C18:1, C18:0, C20:0 and C22:0. FFAs were separated to the baseline and eluted as sharp peaks within 10.5 min. ELSD chromatogram allows identification of all FFA standards with good resolution and without deflected baseline due to gradient elution.
These results have been in part obtained thanks to the addition of TFA in the mobile phase leading to ionization of the carboxylic group therefore increasing molecule polarity and allowing a better resolution and a faster separation. Due to the use of a core-shell C18 column (50 × 4.6 mm; 2.7 µm), the run time is also very short regarding the number of FFAs analyzed and shorter than those ob-tained in previous studies.
For example, Ilko et al. [14] separated 7 FFAs in 15 min on Kinetex C18 col-umn (100 × 3.0 mm; 2.6 µm) with an acetonitrile:water (0.05% formic acid) elu-ent. Separation of 5 plasmatic FFAs was also performed with an elution gradient in only 10 min with ethanol and water but a poor resolution was observed [15].
UV chromatograms only show unsaturated FFAs like C18:1, C18:2, C22:6 (data not shown). Moreover, UV detection leads to a slight deviation of the base-line. This is due to the increase in the percentage of methanol in the elution sol-vent which absorbs at 205 nm. These results clearly show the advantages of ELSD detection over UV detection.
3.4. Method Validation
3.4.1. Specificity
Specificity was assessed by analyzing a sample of sunflower lecithin supple-mented with a standard FFA solution. Since a good separation is observed be-
Figure 4. HPLC-ELSD chromatogram of a standard mixture of 10 FFAs (2 mM). Injection volume: 5 µL. Solvent flow rate: 1 mL/min.
DOI: 10.4236/fns.2017.812077 1059 Food and Nutrition Sciences
tween all components (data not shown), the method can be considered specific.
3.4.2. Calibration
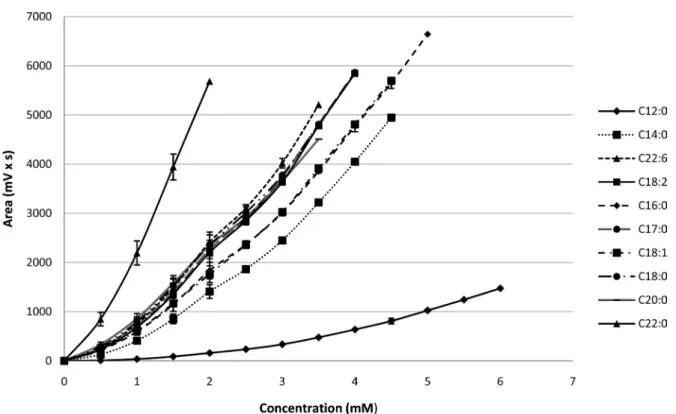
Since ELSD response depends on the analyzed molecules, it is necessary to es-tablish calibration curves for each FFA studied.
As seen on Figure 5, calibration curves are non-linear and the empirical mod-el that best describes this response is a polynomial modmod-el [16]:
(
)
bPeak area= ×a concentration
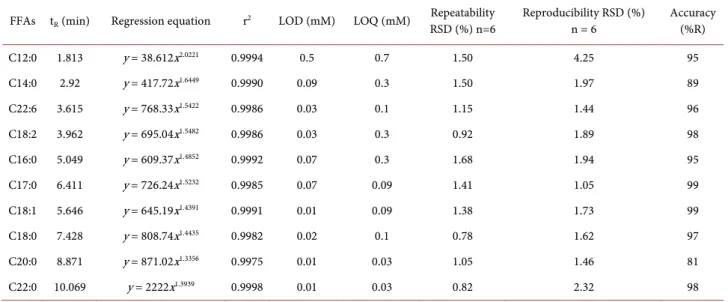
Polynomial regression of calibration curves was performed with Excel pro-gram giving a and b values for each FFA. For each standard, calibration curve shows a r2 value above 0.9975 (Table 2). It can also be seen that high molecular weight molecules saturate the ELSD with lower concentrations than those of smaller size.
3.4.3. LOD and LOQ
Limits of quantification and detection were determined according to a signal to noise approach. For fatty acids with a chain length of 14 or greater, satisfactory sensitivity is achieved with a LOQ value between 0.03 and 0.3 mM (Table 2). With shorter chains such as C12:0, volatility is more important and LOD and LOQ values increase considerably. Quantification of C12:0 requires an amount of at least 0.7 mM.
3.4.4. Accuracy
The results presented in Table 2 show that the recovery values are between 95%
DOI: 10.4236/fns.2017.812077 1060 Food and Nutrition Sciences
and 99% for all FFAs except for C14:0 and C20:0 which show lower values of 89% and 81% respectively. These results indicate that the accuracy of the pro-posed method is acceptable.
3.4.5. Precision
Repeatability and reproducibility were investigated to evaluate the precision. Results are expressed as relative standard deviation (RSD%). RSD values do not exceed 1.5% for repeatability and 4.25% for reproducibility (Table 2).
3.4.6. Robustness
The results of robustness are presented in Table 3. Recovery rates vary between
Table 2. Calibration data, LOD, LOQ, accuracy and precision.
FFAs tR (min) Regression equation r2 LOD (mM) LOQ (mM) RSD (%) n=6 Repeatability Reproducibility RSD (%) n = 6 Accuracy (%R)
C12:0 1.813 y = 38.612x2.0221 0.9994 0.5 0.7 1.50 4.25 95 C14:0 2.92 y = 417.72x1.6449 0.9990 0.09 0.3 1.50 1.97 89 C22:6 3.615 y = 768.33x1.5422 0.9986 0.03 0.1 1.15 1.44 96 C18:2 3.962 y = 695.04x1.5482 0.9986 0.03 0.3 0.92 1.89 98 C16:0 5.049 y = 609.37x1.4852 0.9992 0.07 0.3 1.68 1.94 95 C17:0 6.411 y = 726.24x1.5232 0.9985 0.07 0.09 1.41 1.05 99 C18:1 5.646 y = 645.19x1.4391 0.9991 0.01 0.09 1.38 1.73 99 C18:0 7.428 y = 808.74x1.4435 0.9982 0.02 0.1 0.78 1.62 97 C20:0 8.871 y = 871.02x1.3356 0.9975 0.01 0.03 1.05 1.46 81 C22:0 10.069 y = 2222x1.3939 0.9998 0.01 0.03 0.82 2.32 98 Table 3. Robustness assays.
Mobile phase flow rate (mL/min) Column temperature (˚C) % solvent A at gradient start
Method conditions 0.9 1.1 24 26 12 14 % Recovery C12:0 96 101 96 99 87 109 100 C14:0 97 99 100 101 91 109 100 C22:6 103 102 100 101 88 111 100 C18:2 101 101 100 102 90 114 100 C16:0 98 93 103 96 106 99 100 C17:0 105 96 99 97 107 90 100 C18:1 100 99 106 99 101 90 100 C18:0 102 100 101 99 105 94 100 C20:0 102 100 103 102 101 99 100 C22:0 103 102 102 99 103 92 100
Resolution (linoleic-docosahexaenoic acid)
DOI: 10.4236/fns.2017.812077 1061 Food and Nutrition Sciences
87% and 114% when changing the percentage of water in the mobile phase. They vary between 93% and 105% when changing column temperature and between 96% and 106% for flow rate variation. The method was found to be robust when column temperature and flow rate were altered but the percentage of water in the mobile phase is a critical parameter that should be carefully controlled. It can also be seen that there is no significant change in the resolution of the two criti-cal peaks of C22:6 and C18:2 which stays above the criticriti-cal value of 1.5.
3.4.7. Carry-Over
No signal is observed in the blank solutions after the injection of twice the amount of FFAs used for the highest points of the calibration curves. This con-firms the absence of memory effect in the chromatographic runs.
4. Conclusions
The HPLC method described in this paper allows the rapid separation of 10 FFAs from 12 to 22 carbon chain length including unsaturated FFAs within 10.5 min without baseline drift. Easy to implement, this method was also shown to be robust, accurate and sensitive with low LOD and LOQ values. Actually, greater sensitivity can be obtained with other methods, however they require either time consuming pre-analytical steps such as a fluorescence derivatization, or much more expensive equipment than ELSD (Table 1).
Finally, compared to existing protocols, the proposed method seems to com-bine numerous advantages making it particularly suitable for determination and quantification of FFAs.
Acknowledgements
This work was financially supported by “Laval Agglomération” and the “Conseil Départemental de la Mayenne”. The authors also wish to acknowledge LIPOID (Ludwigshafen, Germany) for providing sunflower lecithin. The authors are grateful to Nathalie Péan for English proofreading.
References
[1] Schreiner, M. (2005) Quantification of Long Chain Polyunsaturated Fatty Acids by Gas Chromatography: Evaluation of Factors Affecting Accuracy. Journal of Chromatography A, 1095, 126-130.https://doi.org/10.1016/j.chroma.2005.07.104 [2] Chen, S.-H. and Chuang, Y.-J. (2002) Analysis of Fatty Acids by Column Liquid
Chromatography. Analytica Chimica Acta, 465, 145-155. https://doi.org/10.1016/S0003-2670(02)00095-8
[3] Lima, E.S. and Abdalla, D.S.P. (2002) High-Performance Liquid Chromatography of Fatty Acids in Biological Samples. Analytica Chimica Acta, 465, 81-91.
https://doi.org/10.1016/S0003-2670(02)00206-4
[4] Hayes, R., Ahmed, A., Edge, T. and Zhang, H. (2014) Core-Shell Particles: Preparation, Fundamentals and Applications in High Performance Liquid Chromatography. Journal of Chromatography A, 1357, 36-52.
DOI: 10.4236/fns.2017.812077 1062 Food and Nutrition Sciences [5] De Baere, S., Eeckhaut, V., Steppe, M., De Maesschalck, C., De Backer, P., Van
Immerseel, F., et al. (2013) Development of a HPLC-UV Method for the Quantitative Determination of Four Short-Chain Fatty Acids and Lactic Acid Produced by Intestinal Bacteria during In Vitro Fermentation. Journal of Pharmaceutical and Biomedical Analysis, 80, 107-115.
https://doi.org/10.1016/j.jpba.2013.02.032
[6] Gerits, L.R., Pareyt, B. and Delcour, J.A. (2013) Single Run HPLC Separation Coupled to Evaporative Light Scattering Detection Unravels Wheat Flour Endogenous Lipid Redistribution during Bread Dough Making. LWT - Food Science and Technology, 53, 426-433.https://doi.org/10.1016/j.lwt.2013.03.015 [7] Zhang, S., You, J., Zhou, G., Li, C. and Suo, Y. (2012) Analysis of Free Fatty Acids in
Notopterygium forbesii Boiss by a Novel HPLC Method with Fluorescence Detection. Talanta, 98, 95-100. https://doi.org/10.1016/j.talanta.2012.06.052
[8] Della Corte, A., Chitarrini, G., Di Gangi, I.M., Masuero, D., Soini, E., Mattivi, F., et al. (2015) A Rapid LC-MS/MS Method for Quantitative Profiling of Fatty Acids, Sterols, Glycerolipids, Glycerophospholipids and Sphingolipids in Grapes. Talanta, 140, 52-61. https://doi.org/10.1016/j.talanta.2015.03.003
[9] Loughrill, E. and Zand, N. (2016) An Investigation into the Fatty Acid Content of Selected Fish-Based Commercial Infant Foods in the UK and the Impact of Commonly Practiced Re-Heating Treatments Used by Parents for the Preparation of Infant Formula Milks. Food Chemistry, 197, Part A, 783-789.
[10] ICH Guideline (2005) Validation of Analytical Procedures: Text and Methodology, Q2(R1).
[11] Webster, G.K., Jensen, J.S. and Diaz, A.R. (2004) An Investigation into Detector Limitations Using Evaporative Light-Scattering Detectors for Pharmaceutical Applications. Journal of Chromatographic Science, 42, 484-490.
https://doi.org/10.1093/chromsci/42.9.484
[12] Bravi, E., Perretti, G. and Montanari, L. (2006) Fatty Acids by High-Performance Liquid Chromatography and Evaporative Light-Scattering Detector. Journal of Chromatography A, 1134, 210-214. https://doi.org/10.1016/j.chroma.2006.09.007 [13] Zhao, J., Li, S.P., Yang, F.Q., Li, P. and Wang, Y.T. (2006) Simultaneous
Determination of Saponins and Fatty Acids in Ziziphus jujuba (Suanzaoren) by High Performance Liquid Chromatography-Evaporative Light Scattering Detection and Pressurized Liquid Extraction. Journal of Chromatography A, 1108, 188-194. https://doi.org/10.1016/j.chroma.2005.12.104
[14] Ilko, D., Braun, A., Germershaus, O., Meinel, L. and Holzgrabe, U. (2015) Fatty Acid Composition Analysis in Polysorbate 80 with High Performance Liquid Chromatography Coupled to Charged Aerosol Detection. European Journal of Pharmaceutics and Biopharmaceutics, 94, 569-574.
https://doi.org/10.1016/j.ejpb.2014.11.018
[15] Kotani, A., Fuse, T. and Kusu, F. (2000) Determination of Plasma Free Fatty Acids by High-Performance Liquid Chromatography with Electrochemical Detection.
Analytical Biochemistry, 284, 65-69. https://doi.org/10.1006/abio.2000.4682 [16] Deschamps, F.S., Baillet, A. and Chaminade, P. (2002) Mechanism of Response
Enhancement in Evaporative Light Scattering Detection with the Addition of Triethylamine and Formic Acid. The Analyst, 127, 35-41.