HAL Id: hal-02400591
https://hal.archives-ouvertes.fr/hal-02400591
Submitted on 9 Dec 2019
HAL is a multi-disciplinary open access
archive for the deposit and dissemination of
sci-entific research documents, whether they are
pub-lished or not. The documents may come from
teaching and research institutions in France or
abroad, or from public or private research centers.
L’archive ouverte pluridisciplinaire HAL, est
destinée au dépôt et à la diffusion de documents
scientifiques de niveau recherche, publiés ou non,
émanant des établissements d’enseignement et de
recherche français ou étrangers, des laboratoires
publics ou privés.
Unraveling the charge transfer/electron transport in
mesoporous semiconductive TiO2 films by
voltabsorptometry
Christophe Renault, Lionel Nicole, Clément Sanchez, Cyrille Costentin,
Véronique Balland, Benoit Limoges
To cite this version:
Christophe Renault, Lionel Nicole, Clément Sanchez, Cyrille Costentin, Véronique Balland, et al..
Unraveling the charge transfer/electron transport in mesoporous semiconductive TiO2 films by
voltab-sorptometry.
Physical Chemistry Chemical Physics, Royal Society of Chemistry, 2015, 17 (16),
Unraveling the charge transfer/electron
transport in mesoporous semiconductive TiO
2
films by voltabsorptometry
Christophe Renault,
aLionel Nicole,
bClément Sanchez,
bCyrille Costentin,
a,*
Véronique Balland,
a,* and Benoît Limoges
a,*
In this work, we demonstrate that chronoabsorptometry and more specifically cyclic voltabsorptometry are particularly well suited techniques for acquiring a comprehensive understanding of the dynamics of electron transfer/charge transport within a transparent mesoporous semiconductive metal oxide film loaded with a redox-active dye. This is illustrated with the quantitative analysis of the spectroelectrochemical responses of two distinct heme-based redox probes adsorbed in highly-ordered mesoporous TiO2 thin films (prepared from evaporation-induced self-assembly, EISA). On the basis of a
finite linear diffusion-reaction model as well as the establishment of the analytical expressions governing the limiting cases, it was possible to quantitatively analyse, predict and interpret the unusual voltabsorptometric responses of the adsorbed redox species as a function of the potential applied to the semiconductive film (i.e., as a function of the transition from an insulating to a conductive state or vice-versa). In particular, we were able to accurately determine the interfacial charge transfer rates between the adsorbed redox species and the porous semiconductor. Another important and unexpected finding, inferred from the voltabsorptograms, is an interfacial electron transfer process predominantly governed by the extended conduction band states of the EISA TiO2 film and not by the localized traps in the
bandgap. This is a significant result that contrasts to those previously observed for dye-sensitized solar cells formed of randomly sintered TiO2 nanoparticles, a behaviour that was ascribed to a particularly low
density of localized surface states in EISA TiO2. The present methodology also provides a unique and
straightforward access to an activation-driving force relationship according to the Marcus theory, opening thus new opportunities not only to investigate the driving-force effects on electron recombination dynamics in dye-sensitized solar cells but also to study the electron transfer/transport mechanisms in heterogeneous photoelectrocatalytic systems combining nanostructured semiconductor electrodes and heterogeneous redox-active catalysts.
Introduction
Because of their high surface area and unique electrical and optical properties, transparent nanostructured TiO2 films have
received considerable interest for a wide range of applications ranging from dye-sensitized solar cells1 to photo- and/or electro-catalysis,2 chemical and biochemical sensors,3 electrochromics,4 or energy storage devices (batteries, supercapacitors).5 Many of these applications rely on electro- or photo-induced electron transfer reactions of redox-active molecules adsorbed within nanoporous TiO2 films deposited on
transparent conductive substrates.6 The redox functionality of these films is intimately related to the dynamic of charge transfer/electron transport across the semiconductive metal oxide which, in turn, is strongly influenced by the nanostructured morphology of the film.7 According to their
n-type semiconductive properties and wide electronic band gap (3.2 eV), TiO2-based films turn into conductive substrates when
a sufficient amount of electrons is injected into the film (e.g., by applying a cathodic potential or UV-light irradiation)8 and insulating under reverse bias. As a function of the applied potential or light illumination, the apparent electron transport in nanostructured TiO2 loaded with redox-active molecules can
thus result from an intricate combination of different physicochemical processes (Scheme 1). First, the electron transport can occur by physical motion of the adsorbed redox-active molecules throughout the porous film up to the uncovered underlying conductive substrate (Scheme 1A). This process (characterized by a physical diffusion coefficient) implies that the electroactive molecules are not too tightly bound to the oxide surface in such a way that they can physically diffuse throughout the void volume of the porous
structure. Second, electrons can be transported by hopping between adjacent redox molecules (Scheme 1B), a process promoted by high concentrations inside the film and fast self-exchange electron transfer.9,10,11 This second mode of electron transport, which often coexists with the first one, has been well-documented for redox compounds as ruthenium12,13 osmium14 polypyridyl complexes, or triaryl amines15 adsorbed in nanocrystalline TiO2 films. It is characterized by a dramatic
increase in the apparent diffusion coefficient once a critical redox probe surface coverage is reached.14,15 The third possible mode of electron transport is through the conduction band of the semiconductive TiO2 matrix (Scheme 1C). It occurs only
when the film is rendered sufficiently conductive by applying a cathodic potential or under photoirradiation. Because strongly linked to the performance of dye-sensitized solar cells, this mode of electron transport has been the subject of intense investigations.7,16,17,18,19,20,21 It was notably shown to be linked to the chemical potential of electrons in TiO2 and thus a
function of the electron concentration injected into the film. Moreover, because mesoporous TiO2 films are usually filled
with a high ionic strength electrolyte, no macroscopic electric field is present to drive the charge carriers up to the underlying conductor. Consequently, the conduction band mediated electron transport across TiO2 occurs primarily by a
random-walk diffusion process.16,22,23 This electron diffusion has also been shown ambipolar because coupled electrostatically with ions present in the electrolyte.22 Such behaviour explains why the apparent electron diffusion coefficient in nanostructured TiO2 is highly sensitive to ion concentrations and electrolyte
composition.18,24 Another widely reported observation is a trap-limited electron displacement due to the existence of an exponential distribution of localized trap states extending into the bandgap from the conduction band edge (ECB).25,26
Therefore, electrons move between band-gap states via the conduction band according to a trapping/detrapping process, a phenomenon which explains the dispersive electron transport in nanoporous TiO223,27,28 as well as the pronounced light intensity
dependence of both the electron diffusion coefficient and electron life time in dye-sensitized nanocrystalline solar cells.19,28,29,30 Beside the different electron transport modes described above, the interfacial electron transfer at the
underlying uncovered conductive substrate as well as the interfacial charge transfer taking place at the electronically conducting TiO2 surface21,31,32 may also affect or limit the
electrochemical conversion rate of a redox probe entrapped in a porous TiO2 film.
Investigation of the electron transfer/transport in nanostructured TiO2 films is usually achieved by
photoelectrochemical methods combined to a small perturbation approach (e.g., the light intensity is modulated on top of a larger one and monitored as a function of the applied potential).7,19 Electrochemically-based methods associated to a small potential perturbation superimposed to a larger one have also been proved valuable, especially for studying the electron transport in the absence of light excitation. This has been well illustrated with the electrochemical impedance spectroscopy taking advantage of a perturbation method through a small sine wave applied potential modulation,33,34 or also by measuring change in film conductivity during a small perturbation of the electrical potential applied to a TiO2 film.18,35 Although less
exploited, single large electrochemical perturbation methods may also be useful with the further advantage of being directly relevant to electrochromic or supercapacitor applications. These methods include potential step chronoamperometry or cyclic voltammetry, and their corresponding spectroelectrochemical variants, i.e. chronoabsorptometry or cyclic voltabsorptometry. The usefulness of a single large perturbation method as chronoabsorptometry has been previously shown with the measurement of the apparent diffusion coefficients of redox-active molecules adsorbed in nanocrystalline TiO2 films.12,14,15
However, these studies were systematically performed under conditions ensuring an electronically insulating film, giving thus information only on the physical and electron hopping transport. In return, few efforts have been made to characterize the electron transport/transfer in electronically conductive nanostructured TiO2 films by large electrochemical or
spectroelectrochemical perturbation methods. Among these, the Meyer’s group36
has taken advantage of chronoabsorptometric experiments to show compelling evidence for a conduction band mediated electron transport during the reduction of a ruthenium complex or a hemin derivative in a nanocrystalline TiO2 electrode. However, no clear relationship between the
Scheme 1. Schematic representation of the three different modes of electron transport mechanisms that can occur in a mesoporous TiO2 film loaded with a redox
measured apparent film diffusion coefficient and the applied electrical potential was proposed. Moreover, the interplays/transitions between the various charges transfer/transport modes when going from a highly insulating to a metal-like conductive TiO2 film were not investigated.
Another work to mention is the one of Bisquert’s group37
in which the exponential charging/discharging of electrons in nanocrystalline TiO2 films has been followed by CV.
The main goal of the present work is to show how by using a large perturbation methods as chronoabsorptometry or more interestingly cyclic voltabsorptometry it may be possible to acquire a comprehensive understanding of the dynamic of electron transfer/charge transport within a transparent mesoporous metal oxide film loaded with a redox-active molecule. Another objective is to qualitatively and quantitatively analyse, predict and interpret the voltammetric and voltabsorptometric responses of the adsorbed redox species on account of the different modes of electron transport. In particular, it will be shown on the basis of analytical equations as well as numerical simulations of derivative cyclic voltabsorptograms how to retrieve important information on the heterogeneous charge transfer mechanism between the adsorbed redox species and the semiconducting TiO2 film, and
also on the type of electronic states that controls the interfacial charge transfer.
As illustrating systems, the electrochemical oxidation/reduction rates of two heme-based redox dyes incorporated in thin transparent films of highly-ordered mesoporous TiO2 were investigated by cyclic voltammetry,
chronoabsorptometry and cyclic voltabsorptometry. The main interest of chronoabsorptograms (CAs) and cyclic voltabsorptograms (CVAs) compared to the classical chronoamperograms and cyclic voltammograms (CVs) is their greater response selectivity and freedom from capacitive current.38,39 It allowed us to entirely deconvolute the different modes of electron transport in TiO2 as a function of the applied
potential (and so as a function of film conductivity). The optical- and redox-active probes we have tested are the iron(III) 5,10,15,20-tetrakis(1-methyl-4-pyridyl) porphyrin (FeTMPyP) and microperoxidase 11 (MP-11), given that: (i) thanks to their positive charges both can be strongly adsorbed into the negatively charged mesoporous TiO2 film at pH 7.0 (pI = 5.8 40
), (ii) their oxidation states (FeIII/FeII couple) can be easily monitored by UV-visible absorption spectroscopy, and (iii) they differ significantly by their molecular size and chemical composition. Instead of using conventional films of randomly sintered TiO2 nanoparticles, suffering thus from a relatively
ill-defined structure and porosity, we have chosen to work with highly-ordered mesoporous TiO2 films prepared from
evaporation-induced self-assembly (EISA).41,42 Once prepared over a conductive ITO-coated glass plate, these thin films (film thicknesses ranging from 100 to 500 nm) have the advantages of being highly porous, permeable,transparent, stable, free of crack, and particularly well-organized since formed by a
continuous and regular 3D architecture of crystalline inorganic anatase-TiO2 phase, including a well-opened pore structure
(cubic mesostructure with pore sizes of 4-10-nm).41,43,44
Experimental
Chemicals and materials
All chemicals were provided by Sigma-Aldrich except TiCl4
(Fluka) and 5,10,15,20-tetrakis(1-methyl-4-pyridyl)porphyrin-Fe(III) pentachloride (Cayman Chemical). All aqueous solutions were prepared with milli-Q water (18.2 MΩ cm-1) obtained from a TKA MicroPure UV purification system. Mesoporous TiO2 thin films were prepared as previously
described using the EISA method.42 Briefly, conductive ITO-coated glass plates (Aldrich,
8-3.5 × 2.5 × 0.2 cm) were dip-coated in a mixture of TiCl4, H2O,
EtOH, and HO(CH2CH2O)106-(CH2-CH(CH3)O)70
-(CH2CH2O)106H (Pluronic F127) (molar ratio: 1:10:40:0.006) at
a withdrawal rate of 2.8 mm s-1 and relative humidity of RH = 20%. The hybrid meso-organized thin films on ITO were next aged at RH = 65% for 2 days and then gradually heated in air at 350°C for 3 h. The films were finally calcinated in air at 550°C for 30 min (with a temperature ramp of 5°C/min). The mesoporous film thickness and pore size distribution were characterized by ellipsoporosimetry using a Woolam VASE M-2000U apparatus. Film thicknesses ranging from 200 to 250 nm were obtained, with an average pore size of 7.5 nm. Considering a specific surface area of 140–160 m2 g-1,45 an average porosity of 40 vol% and a crystalline TiO2 density of
3.89 g cm-3, a specific surface area enhancement of 340–485-fold per µm of film thickness can be calculated.
Spectroelectrochemistry
For spectroelectrochemical detection, a HR2000+ UV-visible diode-array spectrophotometer (Ocean Optics), equipped with optical fibers and a balanced deuterium tungsten source (Micropack), was coupled to an Autolab potentiostat PGSTAT 12 (EcoChemie) interfaced to a PC computer (GPES software). Both instruments were synchronized through an input trigger signal generated from the potentiostat, allowing thus to simultaneously recorded the change of optical absorbance during a potential step chronoamperometric or CV scan. A long pass glass color filter with a cut-off wavelength at 395 nm (GG395 filter, Ocean Optics), was installed between the light source and the sample to avoid photoexcitation of TiO2 network
during measurements. The spectroelectrochemical measurements were performed in a home-made one-compartment three-electrode cell.44 The TiO2-film-coated ITO
glass substrate was used as the working electrode, whereas a platinum wire and Ag/AgCl electrode in 3 M KCl were used as counter and reference electrodes, respectively (i.e., +0.21 V vs. NHE at 25°C). All potentials in the work were quoted to this reference electrode. The working electrode was prepared from a small rectangular piece of 0.8 × 3.5 cm cut from a TiO2
-film-coated ITO glass plate. A working area of 0.8 cm2 was delimited from one extremity of the rectangular piece by depositing an insulating layer of varnish.
The three electrodes were inserted in a 1-cm path length quartz cell through a silicon cap that hermetically closes the cell. The working TiO2-film coated ITO electrode was
positioned normal to the optical path. An additional Tygon tube (1.5-mm outer diameter) was introduced for degassing. The spectroelectrochemical cell was filled with 1.5 mL buffer and thoroughly freed of air by bubbling with argon (at least for half-an-hour) prior to the experiments. During the experiments, argon was continuously flowed over the solution in order to maintain the anaerobic environment and the cell was thermostated to 20°C using a Peltier-controlled cuvette holder (Quantum Northwest). All the experiments were carried out in an aqueous buffered of 10 mM Hepes (pH 7.0). Experimental derivative cyclic voltabsorptograms were smoothed using a second order Savitzky-Golay algorithm.
Adsorption of hemes in mesoporous EISA TiO2 films
Incorporation of the water-soluble hemes into the highly ordered mesoporous structure of TiO2 was achieved at room
temperature by simply immersing the mesoporous TiO2-coated
ITO glass plates in a 10 mM Hepes buffer (pH 7.0) containing the porphyrin or MP-11 in the range of few micromolars to few tens of micromolars for a period of minutes to hours. After adsorption, the modified plates were carefully rinsed with the Hepes buffer and characterized by UV-visible absorption spectroscopy or spectroelectrochemistry in a heme-free Hepes buffer. Contributions to the spectra from the scatter and adsorption by the TiO2-coated ITO glass plates alone were
removed by subtracting the blank spectra of plates recorded prior to heme adsorption.
In order to perform spectroelectrochemical experiments under conditions where Soret band absorbance remains relatively stable for at least 1-2 hours (i.e., negligible heme desorption), the following protocol was selected: (i) a first step during which a significant amount of heme is absorbed into the mesoporous TiO2 film by soaking a TiO2 film-coated ITO plate
in a saturating solution of 50 µM heme during 5 min for FeTMPyP or 1 hour for MP-11, followed by (ii) a second step of desorption during which the small fraction of weakly adsorbed heme molecules is removed by immersing the electrodes for 15 min in a heme-free buffer solution. The resulting modified heme-EISA TiO2 electrodes were used as a
working electrode in a home-made spectroelectrochemical cell filled with a heme-free buffer solution thoroughly bubbled with argon for 30 min prior to the experiments.
Solution extinction coefficients of the oxidized and reduced forms of FeTMPyP and MP-11 at their maximal Soret band absorbance were determined from diluted heme solutions (5 µM in 0.1 M HEPES buffer, pH 7.0) and values of 421 = 105
M-1 cm-1 and 403 = 1.3 × 10⁵ M-1 cm-1 were obtained
respectively. These values are in agreement with previously reported data.46,47 Solution spectra of the reduced form of FeTMPyP and MP-11 were recorded after having carefully
deoxygenated the aqueous heme solution by a series of successive vacuum degassing and nitrogen bubbling, followed by the addition of 50-100 equivalents of dithionite.
DCVA simulations
To numerically simulate the DCVAs resulting from the diffusion reaction between the electrons and substrate molecules confined within the thin semiconductive film, we have used the DigiElch software48 configured in the 1D-thin-layer simulation mode, in which the following reaction mechanism was input:
The first electrochemical reaction allows to simulate the injection of electrons from an inner boundary conductive surface (x = 0) to the interior of an isotropic thin-layer compartment (defined in DigiElch by a thickness df of 220 nm)
in which the species E (representing the free electrons) generated from the compound A (assimilated here as the extended states into the semiconductor) linearly diffuse up to the outer boundary layer of the compartment (x = df). The
standard potential of this reaction is given by the conduction band potential of TiO2 (i.e., ECB = -0.78 V at pH 7.0). The
initial concentration of A is fixed at a value 0
e
C sufficiently
large (i.e., 0
e
C ≥ 100 mM) to remains approximately constant, while the diffusion coefficient of E is selected sufficiently high (e.g. 10-4 cm2/s) to keep a nearly completely flat gradient of E over the whole simulation process. In order to have a Nernstian comportment at the electrode/semiconductor surface, the standard heterogeneous electron transfer rate constant of the reaction was arbitrarily fixed at a high value (e.g., 10 cm.s-1). The second reaction of the mechanism corresponds to the homogeneous irreversible reduction of the redox substrate O by E within the thin layer compartment, while the third reaction represents the reversible one-electron transfer reaction of O at the inner boundary conductive surface (x = 0). For simulations, values of 0
O/R
E and 0 O
C were the same as those obtained
experimentally (because of possible slow desorption of heme from the porous film, 0
O
C has been systematically recalculated
from the Soret band absorbance recorded before each scan), whereas the parameters k0, DO, DR and kC were iteratively e0
adjusted until to get a set of simulated curves that correctly fit to the experimental ones. The simulations of CVs were converted into DCVA fluxes (in pmol cm-2 s-1) after subtraction of the simulated background current (in the framework of fast electron diffusion, the background CV current corresponds to an additive component of the current representing a capacitive component not observed in DCVA).
Results
The mesostructure and crystallinity of the thin films were characterized by SAXS and WAXS experiments (see Fig. S1 in Supporting Information, SI) as well as by scanning electron microscopy (Fig. 1), while the film thickness was determined by ellipsometry (average film thickness of df = 220 ± 20 nm).
As expected, the mesostructure of anatase TiO2 thin films is
highly ordered and corresponds to a well-opened grid-like structure. Environmental ellipsometric porosimetry analyses has confirmed the highly organized porosity of these EISA TiO2 films, displaying a porous volume of about 40% and an
average pore size of 7.5 nm over the whole thickness.
Fig. 1. SEM pictures of the side (A) and the top (B) of an EISA-TiO2 film deposited
on a glass substrate.
2. Adsorption of hemes in mesoporous EISA TiO2 films
Typical UV-visible absorption spectra of the oxidized FeTMPyP and MP-11 adsorbed in the highly ordered mesoporous TiO2 films are compared in Fig. S2 with their
respective spectra in solution. Spectra of adsorbed hemes exhibit characteristic Soret bands at 427 nm for FeIIITMPyP and 404 nm for FeIII-MP-11 (most likely indicative of a low-spin hexacoordinated heme49). The total amount of hemes adsorbed can be estimated from the maximum Soret band absorbance assuming the same extinction coefficient than in solution (pH 7.0). Therefore, from the spectra recorded at saturating concentrations, a maximal heme surface loading
III sat Fe
of 2.8 and 2.0 nmol cm-2 were calculated for FeTMPyP and MP-11, respectively. This is 40-fold and 65-fold higher than predicted, respectively, for a close-packed monolayer of MP-11 or FeTMPyPon a perfectly flat surface.50,51,52 Taking into account the specific surface area of EISA TiO2 films
previously determined by BET methods (i.e., 140–200 m2 g
-1
),45 these values are in relatively good agreement with the specific surface area enhancement of 78–112 calculated for the 220 nm film thickness.45 This suggests that the real surface area of mesoporous TiO2 film is covered by a nearly saturated
monolayer of hemes. Taking into account the film thickness (220 nm) and porosity (0.4), it corresponds to a saturating heme film concentration (i.e., concentration within the void volume of the film) of III
sat Fe
C = 325 ± 100 mM for FeTMPyP and III sat Fe
C =
230 ± 75 mM for MP-11.
From the best fit to a Langmuir isotherm (Fig. S2), apparent binding constants (Kb) of 1.4 × 10
5
M-1 and 106 M-1 were found for FeTMPyP and MP-11, respectively. The adsorption strength of FeTMPyP is thus slightly higher than that reported for other redox-active dyes chemisorbed in nanocrystalline films of TiO2
from organic solvents (Table S1), while for MP-11 it is 10-fold higher than FeTMPyP and similar to that previously obtained by us for Cyt-c in similar TiO2 films.44
3. Chronoabsorptometry
After stepping the potential to a sufficiently cathodic value, characteristic spectral changes associated to the electrochemical reduction of the iron centre of FeTMPyP or MP-11 (from a formal oxidation state of III to II) were observed (Fig. S3). For each compound, the final spectrum of the reduced form as well as the difference spectrum resulting from subtraction of fully reduced and fully oxidized hemes in TiO2 films (insets of Fig.
S3) were in good agreement with spectra obtained in homogeneous solution (analogous shape and amplitudes, including identical maxima and minima wavelengths). These results are in line with quantitative electrochemical reduction of FeIIITMPyP and FeIII-MP-11 within the film.
Dynamics of the heme redox switching in the mesoporous TiO2 films was studied by chronoabsorptometry during which
the time-dependent absorbance change was monitored following a potential step. Typical experiments for FeIIITMPyP- or FeIII-MP-11-loaded TiO2 electrodes after stepping the
potential from +0.4 to -0.6 V and back (i.e., at potential values which are well past the standard potential 0
/
O R
E of -0.16 V for
FeTMPyP and -0.37 V for MP-11 in homogeneous solution) are shown in Fig. 2. A set of experiments is also reported after stepping the potential from -0.6 V to open circuit. The time course absorbance changes were monitored at wavelengths corresponding to maxima in the difference spectra (i.e. at = 447 nm for FeTMPyP and = 419 nm for MP-11, see inset of Fig. S3). From the value of
Red
Ox of each heme in TiO2 (
447= 85 000 M-1
cm-1 for FeTMPyP and
419=80000 M-1 cm-1 for MP-11), the absorbance scale in Fig. 2 can be easily converted in FeII surface concentration of redox active hemes (i.e.,
II
Fe A in mol cm
-2
). Experimental data reveals complete reduction of hemes adsorbed in EISA TiO2
films within less than one second (Fig. 2A and 2A’), while on
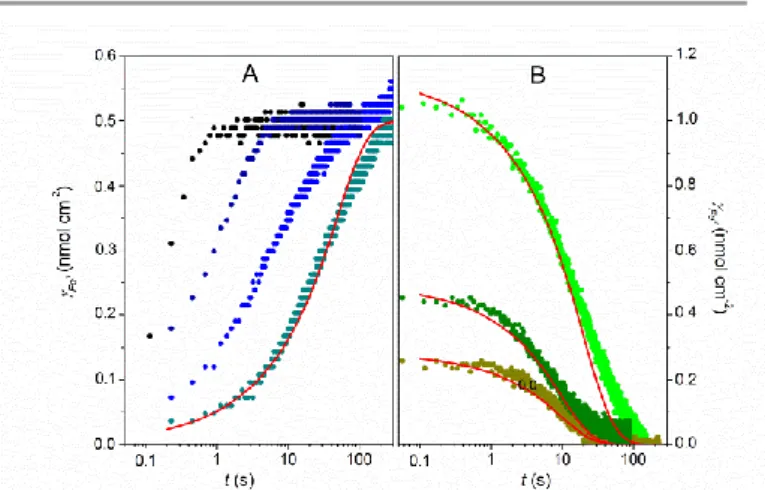
Fig. 2. Absorption changes as a function of time for (top) FeIIITMPyP-loaded EISA
TiO2 electrode (CFe0III= 55 mM) monitored at 447 nm and (bottom) Fe
III
-MP-11-loaded EISA TiO2 electrode (C0FeIII = 140 mM) monitored at 419 nm, after stepping
the potential from (A, A’) +0.4 to -0.6 V, (B, B’) -0.6 V to +0.4 V, and (C, C’) -0.6 V to open circuit.
stepping back the potential to the anodic direction, a much slower reoxidation rate takes place for both hemes, requiring ca. 40 s for a complete regeneration of FeIIITMPyP(Fig. 2B), and more than 90 s for full recovery of the oxidized state of MP-11 (Fig. 2B’). Surprisingly, a slow spontaneous reoxidation of both FeII-hemes is also observed under open circuit and anaerobic conditions, leading to complete reoxidation over ca. 120 s (Fig. 2C and 2C’). It is interesting to note that, contrary to the significantly accelerated reoxidation rate of FeIITMPyP upon application of an anodic potential (compares Fig. 2B and 2C), the spontaneous reoxidation rate of FeII-MP-11 under open circuit is nearly the same than under the applied anodic potential (compares Fig. 2B’ and 2C’). These results point out that the reoxidation of FeIITMPyP throughout the anodically polarized TiO2 is predominantly driven by an electrochemical
process, while reoxidation of FeII-MP-11 is on contrario almost exclusively rate limited by the spontaneous reoxidation process. To test the influence of the applied potential on the reduction/oxidation rates of hemes in EISA TiO2 films, a series
of chronoabsorptograms were recorded at different anodic and cathodic potentials (i.e., by applying a potential more negative or positive than the apparent standard potential of hemes). Fig. 3 show the time-dependent II
Fe
change recorded at a FeTMPyP-EISA TiO2 electrode following a series of potentialsteps at different cathodic/anodic values (within a potential window ranging from -0.7 V to +0.5 V, see Fig S4 for additional data). The results show that the reduction rate of FeIIITMPyP is strongly enhanced as the applied potential is more negative (Fig. 3A, the reaction half-life is decreased from
25 s at Eappl.= -0.2 V to 150 ms at Eappl. = -0.6 V), while the
reoxidation rate is almost independent both on the final anodic potential and the FeTMPyP film concentration (Fig. 3B, half-time in the range of 7-12 s). Similar experiments were also achieved at MP-11-EISA TiO2 electrodes (Fig. S5) but only in
the reduction direction because, as just mentioned above, the oxidation process was observed to be mainly rate-limited by the spontaneous reoxidation of FeII-MP-11 rather than by the applied anodic potential. As for the porphyrin, the reduction rate of FeIII-MP-11 was observed to be exponentially accelerated as the applied potential was gradually stepped to more negative values. This behaviour is consistent with the establishment of a conduction band mediated electron transport/transfer when the semiconductive film is biased at increasingly negative potentials.36
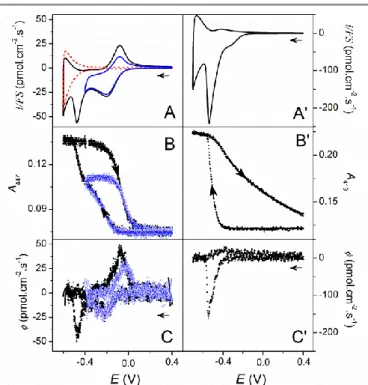
4. Cyclic voltammetry and derivative cyclic voltabsorptometry A typical set of CVs, CVAs and corresponding derivative cyclic voltabsorptograms (DCVAs) simultaneously recorded at a FeIIITMPyP-EISA TiO2 electrode are reported in Fig. 4. The
blank CV recorded at a heme-free EISA TiO2 electrode (dashed
red curve in Fig 4A) is characteristic of the charging/discharging current associated to the injection of electrons into the metal oxide film. The charging of TiO2 film
starts at ca. -0.3 V and exponentially grows during the forward cathodic scan and then back exponentially decreases during the reverse sweep. This behaviour is assigned to the transition from
Fig. 3. (A) Time course of FeII changes for a FeIIITMPyP-loaded EISA TiO2 electrode
(FeIII= 5 × 10 -10
mol cm-2) after stepping the potential from +0.4 V to (from right to left) -0.2, -0.4, -0.5 and -0.6 V. (B) Time course of FeII changes for
[FeIITMPyP]4+-loaded EISA TiO2 electrodes after stepping the potential from -0.6
to +0.5 V. The electrodes were loaded with different FeII values: (from top to
down) 1.15 × 10⁻⁹, 5 × 10⁻¹⁰ and 2.8 × 10⁻¹⁰ mol cm-2. (—) Fits of eq 3 (or its complementary form) to the data using the following diffusion coefficients: () 4 × 10-12, () 2 × 10-11, () 2 × 10-11, and () 10-11 cm2 s-1.
an insulating to a conductive TiO2 state.37 In the presence of
FeTMPyP, the CV of the EISA TiO2 film (blue curve in Fig.
4A) shows a relatively well-defined diffusion-controlled reversible wave (centred on a formal potential of 0
O/R
E = -0.14 V) superimposed to the background charging current. This reversible process is characteristic to the one-electron reduction of the adsorbed FeIIITMPyP, which in homogeneous solution at a bare ITO electrode and pH 7.0 is slightly negatively shifted at
0 O/R
E = -0.16 V. The attribution of the reversible wave to the redox transformation of the heme was corroborated by the simultaneously recorded CVA at 447 nm (blue open square symbol plot in Fig. 4B). The CVA plot effectively shows a reversible increase and decrease of the intensity as a function of potential, in good correlation with the nearly reversible anodic and cathodic peak currents on the CV. Direct comparison of CVs (preferentially subtracted from their blank capacitive current) to CVA can be facilitated by representing the flux of molecules transformed (or electron collected) per unit of time and electrode area (). This can be easily achieved using the following equation, which formally consists to calculate the first derivative of a CVA.
d A i v nFS dE (1)
where here n is the number of electron involved in the redox process (n = 1 for the FeIII/FeII couple), F the Faraday constant,
S the projected area of TiO2 film (cm 2
) , and v the scan rate (V/s). The resulting DCVA in Fig. 4C (blue open square symbol plot) is morphologically identical to the CV in Fig. 4A, except that it is free from non-faradaic response. It is worth to note that the reversible oxidation-reduction wave of the adsorbed porphyrin is located at a potential where TiO2 is
definitely insulating. Therefore, the electron transport throughout the insulating TiO2 matrix should exclusively occur
Fig. 4. (A, A’) CVs, (B, B’) CVAs and (C, C’) DCVAs simultaneously recorded (v = 10
mV s-1) at (A, B, C) a FeTMPyP- or (A’, B’, C’) a MP-11-loaded EISA TiO2 electrode.
During voltammetric scans, absorbance changes were monitored at 447 and 419 nm for FeTMPyP and MP-11, respectively. CVs and DCVAs were converted in flux density using eq 1 (see text). The dashed red CV curve in A is the blank response recorded at a heme-free EISA TiO2 electrode.
by physical diffusion of FeTMPyP to the underlying conductive ITO substrate and/or by electron self-exchange (hopping) between neighbouring porphyrin molecules. This assumption was corroborated by the finding that the plot of the voltammetric cathodic peak current varies linearly as a function of v, therefore supporting a diffusion-like process (vide
infra).
Upon scanning the potential at more negative values (black plain dotted curves), a second irreversible cathodic peak at -0.47 V is clearly discerned on both the CV and DCVA plots. Since also present on the DCVA, this second reduction peak can be unambiguously attributed to the reduction of FeIII -porphyrin adsorbed in TiO2. The shape of this irreversible wave
is however unusual since exhibiting an unsymmetrical profile with a fast return to zero flux after the maximum has been reached. Another interesting observation is that the second reduction peak occurs at potentials which coincide with the exponential growth of the TiO2 film capacitance (i.e., transition
from an insulating to a conductive state), hence suggesting a direct porphyrin reduction at the TiO2 interface through the
conduction band electrons. During the reverse scan, a single reoxidation peak at -0.08 V, proportional to v, is obtained, which is close to the standard potential of FeTMPyP and also very analogous to the reversible wave previously recorded by CV within a less negative potential window (i.e. in a potential zone where TiO2 remains fully insulating, blue curve).
It can also be stated from the absorbance changes in Fig. 4B that once the potential sweep is inverted just after the first
reduction wave, only a fraction of the total amount of porphyrin contained in the film is reduced, while a scan past the second wave allows for complete reduction of the entire film content. Finally, after a complete cyclic scan potential, the absorbance at 447 nm is returned to its initial value, in agreement with that expected for a fully reversible electrochemical process.
In contrast to FeTMPyP, the CV and DCVA of MP-11-EISA TiO2 electrodes (Fig. 4A’-C’) show a single sharp
reduction peak located at -0.54 V (a potential significantly more negative than the standard potential of MP11 in solution, i.e. -0.37 V), while in the reverse scan there is no clear reoxidation peak but only a broad and ill-defined wave of small amplitude indicating a very sluggish reoxidation of FeIII-MP-11. The absence of a diffusion-controlled reversible wave centred on the formal potential of MP-11 on both the CV and DCVA strongly supports that MP-11 cannot move by diffusion through the insulating TiO2 nanostructure for exchanging electron to the
uncovered underlying ITO substrate. It also suggests the absence of electron hopping between neighbouring MP-11. These results are in line with the larger molecular size and stronger binding affinity of MP-11 to TiO2 compared to
FeTMPyP, which taken all together would contribute to a drastic decrease of MP-11 mobility in the mesoporous TiO2
film. In the reverse scan, complete regeneration of the oxidized form of MP-11 (see CVA plot in Fig. 4B’) requires several tens of seconds, which is as fast as that reported above under open circuit (Fig. 2C’). This confirms that reoxidation of FeII-MP-11 in TiO2 is preferentially induced by a spontaneous reaction
rather than by an electrochemical process, and so that reoxidation of FeII-MP-11 by physical diffusion and/or electron hopping up to the underlying electrode is unlikely. It has to be noted that the irreversible reduction peak of FeIII-MP-11 (-0.54 V) is located at potential slightly more negative than the second reduction peak of FeTMPyP (-0.47V). This observation is coherent with the lower 0
O/R
E of MP-11 (-0.37 V) compared to FeTMPyP (-0.16 V) and in line with the idea that even though the heme reduction rate is primarily controlled by the increase of the reduction power of TiO2 while the potential is raised to
negative values, it remains linked to the electrochemical properties of the adsorbed redox species (vide infra).
To better understand the interplay between the different redox processes occurring during heme reduction and oxidation in TiO2 films, CVAs were recorded at various scan rates. The
resulting DCVAs are shown in Fig. 5 for both FeTMPyP and MP-11. In the case of FeTMPyP it can be inferred that the magnitude of the first reduction wave is changed in proportion to the square root of the scan rate (see Fig. S6), indicating a diffusion-controlled process, while the magnitude of the second cathodic peak is strongly diminished and even nearly disappeared as the scan rates is lowered (or inversely completely prevailed at high scan rates). Such an observation reveals an intricate time-dependent interrelationship between the two reduction peaks of FeIIITMPyP. This is in contrast to the reduction peak of FeIII-MP-11 which, at the slowest scan rates, is simply linearly increased with v (Fig. S7), a behaviour characteristic of a finite thin-layer reaction where the reduction
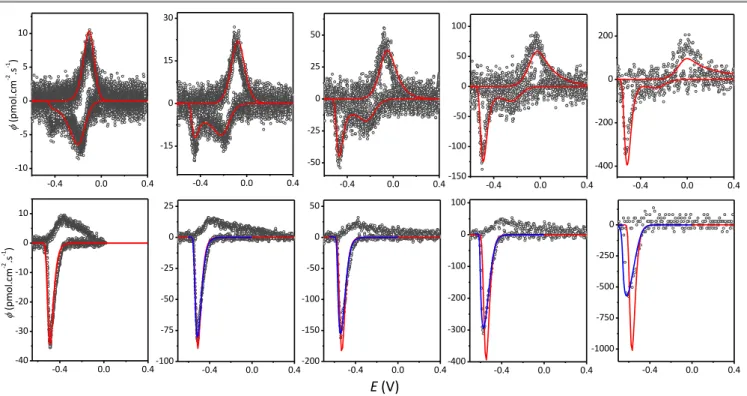
Fig. 5. Cyan dotted plots: DCVAs of (top row) FeTMPyP- and (bottom row) MP-11-loaded EISA TiO2 electrodes at various scan rates: (from left to right) 2, 5, 10, 20, and
50 mV s-1. The y-scale of DCVAs is represented in flux density . (Top row) Red curves: CVs numerically simulated (see text for details) using the following parameters: 0
/ O R
E = -0.14 V, k0 = 5 × 10⁻⁷ cm s-1, = 0.5, df = 220 nm, DO = 5 × 10-12 cm2 s-1, DR = 3 × 10-11 cm2 s-1, ECB = -0.78 V, kCe0 = 8 × 10 4
s-1 and from left to right: 0 0 O FeIII
C pC = 28, 30, 33, 34, and 35 mM. (Bottom row) Red curves: fits of eq 13 to the experimental plots using the following set of parameters: ECB = -0.78 V, kCe0 = 8 × 10
3 s-1, and
from left to right FeIII = 1.19, 1.23, 1.28, 1.36 and 1.43 nmol cm -2
, respectively. Blue curves: numerical simulations (see text) including a ohmic drop compensation of RS = 1000 .
rate of FeIII-MP-11 in the film is neither controlled by a physical, hopping, or conduction band mediated electron transport.
Discussion
As mentioned in the introduction, the reduction/oxidation rates of redox actives molecules adsorbed within a nanoporous semiconductive TiO2 film is deeply convoluted to the different
modes of charge transfer/electron transport across the film. The question now we would like to address is how to decipher between these different modes and how to rationally predict the experimental CAs, CVs and DCVAs shown in Fig. 3-5 on the basis of an appropriate model.
1. Preliminary analysis of the electron transport/transfer when TiO2 is not conductive (i.e., at bias potentials E > -0.3 V)
The diffusion-controlled reversible wave observed on the CV and DCVA of the FeTMPyP-EISA TiO2 electrode, at a
potential window where TiO2 is insulating, clearly evidence
that, albeit adsorbed, the porphyrin can slowly diffuse throughout the TiO2 porous network before to be
electrochemically oxidized/reduced at the uncovered underlying conductive ITO interface. In the case of MP-11, the absence of a reversible wave on the CV and DCVA close to the
standard potential, and the impossibility to discern by chronoabsorptometry an electrochemical reoxidation distinctive from the slow spontaneous reoxidation occurring under open circuit allows to conclude that physical diffusion of MP-11 throughout the TiO2 network is, if effective, too slow to be
observed under the experimental conditions. By quantitatively analysing the diffusion-controlled reversible wave of FeTMPyP on the DCVAs (Fig. 4 and 5) as well as the CA experiments (Fig. 3) stepped at potentials close to the porphyrin’s 0
O/R
E
value (i.e., at potential values where the semiconductive matrix remains in an insulating state), one would determine the apparent film diffusion coefficients of the oxidized (DO) and
reduced (DR) forms of FeTMPyP. The CA responses recorded
at an applied potential > -0.3 V were thus analyzed in the framework of a finite linear diffusion transport along the thickness df of the restricted volume of TiO2 film (considering
here an isotropic film where the molecules are homogeneously distributed and able to freely diffuse throughout the entire volume of the film). This can be achieved using the following modified Cottrell equation (valid here for a reduction process) which takes into account an absorbance change instead of a current:53
0 2
2 2 O 2 2 1 2 1 8 1 exp 2 1 4
II O f Fe j f A t j D t t d C j d (2) -0.4 0.0 0.4 -10 -5 0 5 10 ( pmol .cm -2 .s -1 ) -0.4 0.0 0.4 -15 0 15 30 -0.4 0.0 0.4 -50 -25 0 25 50 -0.4 0.0 0.4 -150 -100 -50 0 50 100 -0.4 0.0 0.4 -400 -200 0 200 -0.4 0.0 0.4 -40 -30 -20 -10 0 10 ( pmol .cm -2 .s -1 ) -0.4 0.0 0.4 -100 -75 -50 -25 0 25 -0.4 0.0 0.4 -200 -150 -100 -50 0 50 -0.4 0.0 0.4 -400 -300 -200 -100 0 100 -0.4 0.0 0.4 -1000 -750 -500 -250 0E (V)
Here, FeIII
t is the projected surface concentration of Fe IIat time t, A t
is the absorbance change at time t, and C is the O0 initial concentration (in mol cm-3) of oxidized heme distributed homogeneously throughout the film (meaning that 0 0O FeIII
C pC ).
The fitting of eq 2 to the experimental data allows thus to determine the apparent value of DO from the knowledge of
0
III Fe
C and df. For an oxidation, eq 2 has to be replaced by a
complementary equation in which DO is interchanged by DR. It
is worth pointing out that eq 2 and its complementary form can be approximated at short times to recover the classical Cottrell equations. The rather good fits of eq 2 or its complementary form (both numerically solved) to the experimental CAs recorded at potentials > -0.3 V (Fig. 3) suggest a proper description of the reduction/oxidation rates of porphyrin by finite linear diffusion in an isotropic film (especially at short-time where the plot is linearly correlated to t1/2, as it might be expected for a diffusion-controlled process). The apparent diffusion coefficients retrieved from the fits in Fig. 3 and from additional experiments in Fig. S4 are gathered in Table 1. The reported values of DR and DO are considerably much lower than
the diffusion coefficients of FeTMPyP in aqueous solution (more than 10 000-fold lower), but of comparable magnitude to the low diffusion coefficients found for other redox species absorbed in nanocrystalline TiO2 films (e.g., a value of 1.4 ×
10-11 cm2 s-1 was found for the [Os(bpy)2(4,4’-(CO2H)2-bpy)]2+
complex adsorbed at half-saturation in a nanocrystalline film of TiO2 14). The low values of DR and DO are also in line with a
charge transport mechanism exclusively governed by a physical diffusion of the porphyrin molecules throughout the insulating porous matrix and not by an electron hopping between adjacent porphyrin molecules. This is supported by the fact that DR was
observed approximately constant and independent of the FeTMPyP film concentration when the latter was changed from
1
2, 14, to 110 saturation (Fig. 3B and Table 1). On account of these results, hopping charge transport between adjacent porphyrin molecules is unlikely and the value of DR can be
assimilated to the effective physical diffusion coefficient of FeIITMPyP within the film. This remark is also valid for DO
which is slightly smaller than DR (5-fold lower).
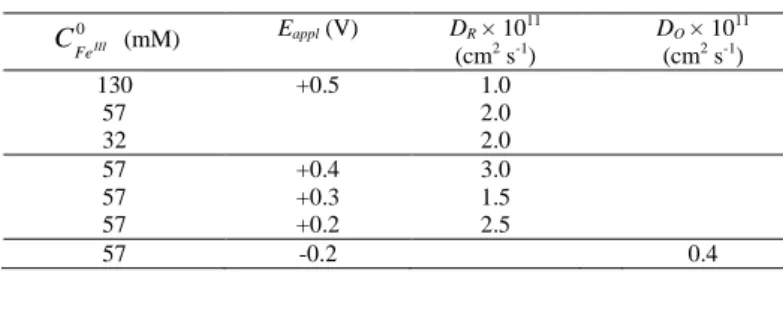
Table 1. Apparent diffusion coefficients of the oxidized and reduced forms of FeTMPyP in a EISA TiO2 electrode determined for different applied
potentials (Eappl >-0.3 V) and film concentrations.
(mM) Eappl (V) DR × 1011 (cm2 s-1) DO × 1011 (cm2 s-1) 130 57 32 +0.5 1.0 2.0 2.0 57 57 57 +0.4 3.0 +0.3 1.5 +0.2 2.5 57 -0.2 0.4
The chronoabsorptograms recorded at potentials < -0.3 V in Fig. 3 were not fitted to eq 2 because, at this low potential, it is no more possible to neglect the increase of TiO2 conductivity
which results in a growing contribution of the conduction-band
mediated electron transport/transfer. This is what we will now examine.
2. Simple general description of the model of electron diffusion/charge transfer reaction in the film
For modelling the different modes of electron transport/charge transfer occurring in the mesoporous TiO2 film-coated ITO, it is
essential to properly describe how the electrons are injected into the semiconductive material as a function of the applied potential and how they propagate across the film. For a conventional n-type semiconductive material such as bulk TiO2,
the increase of conductivity with the applied potential is directly linked to the free electron concentration in the conduction band (ncb), which is itself determined by the energy
difference between the edge of the conduction band (ECB) and
the Fermi level (EF) of the electrode (which is here assumed to
be equal to EF = -qE, where E is the applied potential and q the
elementary charge). When the semiconductive film is biased negatively, the upward shift of the Fermi level implies a change in the electron occupancy of the extended states. When electrons behave ideally, this average occupancy is expected to obey to Fermi-Dirac statistics and if the energy difference between the Fermi level and the conduction band is much larger than the thermal energy (ECB - EF >> kBT), the density of free
electrons in TiO2 can be given by the Boltzmann distribution
approximation (eq 3):7, 18 E E exp F CB cb C B n N k T (3)
with NC the density of extended states in the conduction band,
kB the Boltzmann constant, and T the temperature. With
nanoporous TiO2 films impregnated with an electrolyte,
electron transport is assumed to proceed by diffusion because of the absence of significant electrical potential gradient in the film.22 Consequently, on the basis of eq 3 and considering that the injected electrons diffuse freely throughout an equivalent isotropic film of thickness df, it may be written that the free
electron concentration (Ce) at the ITO/semiconductive film
interface (x = 0) follows an exponential function of the applied potential E (eq 4).
0
0 exp e x e CB F C C E E RT (4)with Ce0 the maximal electron concentration that can be
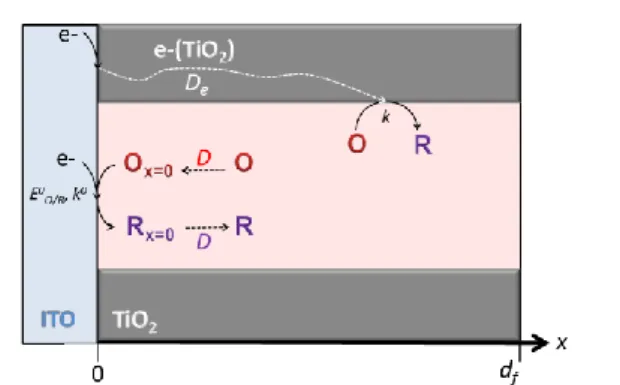
injected at saturation in the conduction band of the semiconductive film. Once injected, the electrons diffuse linearly up to the outer boundary of the semiconductive film (with a constant diffusion coefficient De, Scheme 2). Moreover,
during their travel across the film, free electrons may react irreversibly (especially if EO/R0 ECB) with the adsorbed oxidized heme O (with a rate constant k) at the porous semiconductive/solution interface, giving finally the reduced product R (Scheme 2). In addition to the diffusion of free
0 III
Fe C
Scheme 2. The two main heterogeneous electron transfer reaction pathways
involved in the reduction of species O considered in the simple model.
electrons from the ITO electrode to the interior of the semiconductive film, O and R are able to diffuse with a low diffusion coefficient DO and DR, respectively (but neither O or
R can get out of the film). Consequently, O can be directly reduced into R at the uncovered underlying ITO electrode according to an interfacial reversible one-electron transfer reaction (that may be described by a Butler-Volmer kinetics with a heterogeneous electron transfer rate constant k0 and a transfer coefficient = 0.5). For sake of simplicity, the physical diffusion coefficients of O and R within the film are at first assumed to be identical (i.e. D = DO = DR). Substrate, product
and electron transports within the film may each be likened to a finite linear diffusional transport (normal to the x direction of the conductive surface) obeying the Fick’s diffusional law which, in the presence of the interfacial electron transfer reaction, leads to reaction-diffusion equations given in the SI together with appropriate boundary conditions. In particular, at the underlying conductive ITO/TiO2 interface, the total current
density I (or flux, ) is given by:
e ph I I I (or e ph) (5) with 0 e e e e x I C D F x (6)
0 0 O/R 0 O 0 R 0 O/R exp 2 exp ph ph x x I F k E E F RT F C C E E RTO R 0 0 x x C C D D x x (7)
Ie is the current resulting from the amount of free electrons
injected into the semiconductive film and Iph the faradaic
current arising from the electrochemical transformation of the adsorbed redox probe at the uncovered underlying ITO electrode. Note that an additional contribution to be considered is IITO the capacitive current of the underlying ITO electrodes.
By solving the set of reaction-diffusion equations given in the
SI using the boundary conditions, one should thus be able to calculate the theoretical CA, CV or DCVA curves.54
3. Analysis of the CV background current in the absence of charge transfer reaction with a substrate
CVs have been recorded at heme-free EISA TiO2 electrodes
(df = 220 nm) for various scan rates in a Hepes buffer (pH 7.0)
(Fig. S8 and 6) and, as expected, in the non-conductive zone of TiO2 (E > -0.3 V) the capacitive current remains low,
proportional to the scan rate, and nearly independent of the applied potential. At potentials < -0.3 V, the exponential increase of the background current during the forward scan and its decrease during the reverse scan are proportional to the scan rate. This is well-illustrated in Fig. S8 where CVs normalized to
v tends to overlaid at all scan rates, except for the slowest one
(i.e., 2 mV/s) for which a dissymmetry between the forward and reverse charging current is developing (vide infra). The fact that the CV charging current of TiO2 is proportional to v and
not to v (within the range of scan rates tested) attests that the transport of electrons by diffusion throughout the film is fast and not rate limiting under the experimental conditions, i.e. De
>> df2(Fv/RT) = 10-9 cm2/s (see SI for more details). The
semilogarithmic representation of the experimental forward CV scans (0.1 V/s) in Fig. 6A shows a linear variation of log(I) with the potential from an onset potential < -0.4 V. An average slope of 5.7 V-1 was retrieved in agreement with that previously found by others groups for nanocrystalline films of randomly sintered TiO2 nanoparticles.37 Such behaviour can be
interpreted by the presence of electron traps (or localized states) in the bandgap of the semiconductor which greatly influence the electron transport and charge transfer in mesoscopic TiO2
films (in the absence of traps a steeper slope of 17 V-1 is theoretically expected).19,31,37 According to the multiple-trapping model generally used to describe such a nonideal behaviour,25,27,26 it is proposed that the localized traps are
Fig. 6. CVs recorded at EISA TiO2 electrodes in Hepes buffer (10 mM) for different
scan rate v: (blue) 2, (red) 5, (green) 10, (magenta) 20, (yellow) 50, (dark yellow) 100 mV/s. (A) Semilogarithmic scale representation of the forward scans. (B) Simulations of (plain curves) CV blank responses at 20, 50 and 100 mV/s using an exponential capacitance coupled to a series resistance RS. The simulated curves
were obtained with the following parameters: RS = 1500 , F/(RTln10) = 5.5 V-1,
CITO = 6 µF/cm2 and Ct = 0.1 µF/cm2. This set of parameter provides the best
rapidly and reversibly filed/emptied by the free electrons when the Fermi level varies. Moreover, this is achieved at rates that are much faster than the electron transport through extended states,55 but also for trap states energies that are assumed to follow an exponential distribution in the bandgap according to:23,27,28
E Texp
ET ECB
T B B N g k T k T (8)with ET is the energy of the trap, NT the total trap density and
a parameter that reflects the average energy of the trap states distribution below the conduction band. This leads to a density of trapped electrons that exponentially varies with the Fermi level as: T E E exp F CB trap B n N k T
(9)
The total electron density in the semiconducting nanoporous film is consequently the combination of charges accumulated in both the conduction band and trap states (nch = ncb + ntrap),
which is equivalent to the charging of two chemical capacitor connected in parallel (i.e. Cch = Ccb + Ctrap). Since electrons
captured by trap states in nanoporous TiO2 film are present at a
much higher density than electrons in the conduction band,56,57 the total chemical capacitance density can be approximated by
Cch ≈ Ctrap.27,55 The resulting capacitive background current of
nanostructured TiO2 films is therefore considered as governed
by the filing of the distribution of traps in the bandgap, leading thus to an exponential dependence of the chemical trap capacitance with the voltage that varies as F/RTln10 per
decade (eq 10) :37
,0exp ch trap trap CB F C C C E E RT (10) with 2 0 ,0 , trap f e trap F C d C RT (where Ce trap0, is the maximal concentration of electrons that can be injected into the localized states of the semiconductive film). The total capacitive courant (IC) that takes into account the
localized traps and a contribution from the series capacitance of the underlying ITO surface (characterized by CITO) can thus be
expressed as:
2 0 , exp C f e trap CB ITO F v F I d C E E C v RT RT (11)From the slope of 5.7 V-1 in Fig. 6A, a value of = 0.33 was then inferred. Eq 11 is presumed to give a symmetric CV with a forward scan of opposite sign to the reverse one because of the sign reversal of v, but such an ideal behaviour is not reached experimentally (as observed in Fig. 6B or S8). Several factors can affect and distorts the shape and symmetry of the CV
charging current. The occurrence of an unidentified charge transfer reaction taking place at the TiO2/electrolyte interface
has been previously reported to strongly affect the shape of the capacitive CV current of mesoscopic TiO2 films, especially at
low scan rates.37 An analogous comportment is observed here at the slowest scan rates, where the forward charging current is abnormally increased at the expense of the reverse one which gradually disappears, leading thus to a highly dissymmetric CV plot. Increasing the scan rate is a way to minimize this faradaic contribution and so to recover (at least partially) a more symmetrical CV shape. This is typically what we observe in Fig. S8, but in spite of a certain degree of symmetry recovery at the highest scan rates, the forward and backward currents remain distorted. Among the other factors that significantly distort the shape of the capacitive CV current of TiO2 films is
the resistance connected in series to the capacitance.37 This is evidenced in Fig. 6B or S8 where the anodic capacitive peak currents observed on the reverse scans suggest a delay in the return of the discharging currents down to the background currents. Distortion of the charging current by an ohmic drop has thus to be taken into account to correctly describe the shapes of CVs in Fig. 6. It may be achieved using the same procedure as the one proposed by Fabregat-Santiago et al.37 (recalled in SI). We have thus used this latter procedure to simulate and fit the experimental CVs recorded at the highest scan rates (i.e., v = 20, 50 and 100 mV/s) (Fig. 6B) by iterative adjustment of the following three unknown parameters: RS,
,0exp /
t trap CB
C C FE RT and. From the best fits, the
following values were finally obtained: RS = 1500 , = 0.32,
and Ct = 0.1 µF/cm2. The extracted value of F/(RTln10) = 5.5
V-1 was similar to the one roughly extracted from the slope in Fig. 6A, indicating that the impact of the series resistance on the determination of is here not significant. Moreover, from the knowledge of ECB it is also possible to determine Ce trap0, . Rothenberger et al. reported from spectroscopic studies the characteristic potential at which nanocrystalline films of TiO2
particles are brought into accumulation as a function of different pH.58 This characteristic potential can be identified with the conduction band potential which, as a function of pH, is given by ECB = -0.40 – 0.06 pH (in V vs. SCE).59 Under our
experimental conditions (pH 7.0), we should thus have ECB =
-0.78 V (vs. Ag/AgCl) at T = 25°C. Using this ECB value and =
0.32, a value of 0 ,
e trap
C = 70 mM (i.e., 4 × 10¹⁹
cm-3) is found, which is finally close to the ones previously reported (1-2.5 × 1019 cm-3) for mesoscopic films of TiO2 based on sintered
nanoparticles.37,57
4. Analysis and simulations of CVs and DCVAs in the presence of an adsorbed redox couple
Based on our analysis of the background current, indicating that the electron transport by diffusion in EISA TiO2 film is not rate
limiting, analytical solution of the set of reaction-diffusion equations could be obtained (see SI when le0). In such a situation, the total current is the sum of a faradaic component If
related to the redox transformation of the adsorbed dye and an apparent capacitive component IC being the sum of a term


![[PDF] Formation avancé en langage de programmation Basic | Cours informatique](data:image/gif;base64,R0lGODlhAQABAIAAAP///wAAACH5BAEAAAAALAAAAAABAAEAAAICRAEAOw==)