HAL Id: hal-02500730
https://hal.archives-ouvertes.fr/hal-02500730
Submitted on 25 May 2020
HAL is a multi-disciplinary open access
archive for the deposit and dissemination of
sci-entific research documents, whether they are
pub-lished or not. The documents may come from
teaching and research institutions in France or
abroad, or from public or private research centers.
L’archive ouverte pluridisciplinaire HAL, est
destinée au dépôt et à la diffusion de documents
scientifiques de niveau recherche, publiés ou non,
émanant des établissements d’enseignement et de
recherche français ou étrangers, des laboratoires
publics ou privés.
Distributed under a Creative Commons Attribution| 4.0 International License
chloromethane in the Arabidopsis thaliana phyllosphere
Muhammad Farhan Ul Haque, Ludovic Besaury, Thierry Nadalig, Françoise
Bringel, Jérome Mutterer, Hubert Schaller, Stéphane Vuilleumier
To cite this version:
Muhammad Farhan Ul Haque, Ludovic Besaury, Thierry Nadalig, Françoise Bringel, Jérome
Mut-terer, et al.. Correlated production and consumption of chloromethane in the Arabidopsis thaliana
phyllosphere. Scientific Reports, Nature Publishing Group, 2017, 7 (1), pp.1-10.
�10.1038/s41598-017-17421-y�. �hal-02500730�
www.nature.com/scientificreports
Correlated production and
consumption of chloromethane
in the Arabidopsis thaliana
phyllosphere
Muhammad Farhan Ul Haque
1,3, Ludovic Besaury
1,4, Thierry Nadalig
1, Françoise Bringel
1,
Jérôme Mutterer
2, Hubert Schaller
2& Stéphane Vuilleumier
1Chloromethane (CH3Cl) is a toxic gas mainly produced naturally, in particular by plants, and its emissions contribute to ozone destruction in the stratosphere. Conversely, CH3Cl can be degraded and used as the sole carbon and energy source by specialised methylotrophic bacteria, isolated from a variety of environments including the phyllosphere, i.e. the aerial parts of vegetation. The potential role of phyllospheric CH3Cl-degrading bacteria as a filter for plant emissions of CH3Cl was investigated using variants of Arabidopsis thaliana with low, wild-type and high expression of HOL1 methyltransferase previously shown to be responsible for most of CH3Cl emissions by A. thaliana. Presence and expression of the bacterial chloromethane dehalogenase cmuA gene in the A. thaliana phyllosphere correlated with HOL1 genotype, as shown by qPCR and RT-qPCR. Production of CH3Cl by A. thaliana paralleled HOL1 expression, as assessed by a fluorescence-based bioreporter. The relation between plant
production of CH3Cl and relative abundance of CH3Cl-degrading bacteria in the phyllosphere suggests that CH3Cl-degrading bacteria co-determine the extent of plant emissions of CH3Cl to the atmosphere.
The phyllosphere, defined as the aerial part of plants and especially leaves, is a crucial if perhaps still overlooked ecosystem, with leaf surfaces estimated to total 1 × 10⁹ km², i.e. twice the land surface area. The phyllosphere
represents a major habitat for micro-organisms. Bacteria, in particular, are present at 106–107 cells per cm² of leaf
surface, as determined by both culture-dependent and culture-independent studies1.
Availability of carbon is an important factor for microbial colonisation of the phyllosphere2. Methanol (global
estimates of 100 Tg /y for plant emissions3) and photosynthates such as fructose, sucrose and glucose, are
prom-inent carbon sources on leaves2. Methanol represents a privileged growth substrate for methylotrophic bacteria,
and such micro-organisms, in particular from the Alphaproteobacterial genus Methylobacterium, are dominant in the phyllosphere4.
Chloromethane is another volatile one-carbon compound produced by plant leaves5, with global
produc-tion currently estimated at approximately 1–5 Tg/y6. Although quantitatively far less important than methanol,
chloromethane has environmental significance as the most abundant halogenated hydrocarbon in the atmos-phere (~550 ppt), and because it is responsible for about 15% of chlorine-catalysed destruction of stratospheric ozone6. The best characterised mechanism for chloromethane production involves a methyltransferase-catalysed
reaction, first demonstrated in Brassica oleracea7. In Arabidopsis thaliana, the methyltransferase gene HOL1
(Harmless to Ozone Layer) was identified by a knock-out mutation leading to loss of chloromethane produc-tion8. A halide methyltransferase gene homolog of HOL1 in Raphanus sativus (daikon radish, another member of
Brassicaceae family) was since also shown to be involved in methyl halide emissions9.
Some specialised methylotrophic bacteria utilise chloromethane as their only source of carbon and energy for growth10,11, and may thus represent natural sinks for chloromethane emissions. In this context, methylotrophic
chloromethane-degrading strains from the phyllosphere of A. thaliana were isolated12. These isolates feature
1Université de Strasbourg, CNRS, GMGM UMR 7156, Department of Microbiology, Genomics and the Environment,
Strasbourg, France. 2Institut de Biologie Moléculaire des Plantes, UPR 2357 CNRS, Strasbourg, France. 3Present
address: School of Environmental Sciences, University of East Anglia, Norwich, UK. 4Present address: Université de
Reims Champagne Ardenne, INRA, FARE UMR, A614, Reims, France. Correspondence and requests for materials should be addressed to S.V. (email: vuilleumier@unistra.fr)
Received: 24 August 2017 Accepted: 24 November 2017 Published: xx xx xxxx
the same chloromethane utilisation pathway previously characterised in detail for Methylobacterium extorquens CM413,14. In this pathway, chloromethane utilisation is initiated by a corrinoid- and tetrahydrofolate-dependent
methyltransferase system encoded by cmuA and cmuB respectively15, whose expression is regulated by
chlo-romethane14,16. The cmuA gene is strongly conserved in chloromethane-degrading strains12, and has been used
as a biomarker gene in studies of chloromethane degradation in different environments11,17,18. Here, we explore
the topic of the interrelationships of sources and sinks of chloromethane with the model system of the A. thaliana phyllosphere. We use HOL1 and cmuA as biomolecular markers of chloromethane emission and consumption, respectively, to investigate the potential role of chloromethane-degrading bacteria as filters of plant emissions of chloromethane to the atmosphere.
Results
A bipartite model laboratory system was set up consisting of well-studied organisms at the molecular level,
A. thaliana for which the mechanisms of chloromethane production were identified, and Methylobacterium extorquens CM4, the best characterised chloromethane-degrading bacterium.
Variants of A. thaliana with different expression of HOL1.
The gene product of At2g43910 (Arabidopsis Information Resource, www.arabidopsis.org), designated HOL1 for “Harmless to Ozone Layer”, was shown to be responsible for the major part of chloromethane emissions in A. thaliana8. A T-DNA insertionmutant of A. thaliana wild-type (ecotype Col-0) causing a knock-out mutation in HOL1 was obtained from the Salk Institute (http://signal.salk.edu) (Supplementary Information Fig. S1A). PCR genotyping of three hol1 mutant lines (hol1–1, hol1–2, and hol1–3) allowed us to isolate homozygous hol1-1 mutant plants (Supplementary Information Fig. S1B). Two lines of A. thaliana overexpressing HOL1, termed HOL1-OX1 and HOL1-OX619,
were also characterised with respect to HOL1 expression. As evaluated by RT-qPCR, A. thaliana hol1 plants showed significantly lower (p < 0.0003) expression of HOL1 (20,000-fold). Conversely, significantly higher (p < 0.00003) expression of HOL1 was observed in HOL1-OX1 ( > 27-fold) and HOL1-OX6 ( > 50-fold) plants compared to A. thaliana wild type (Supplementary Information Fig. S1C). Homozygous mutants hol1-1 (lowest
HOL1 expression) and HOL1-OX6 (highest HOL1 expression) were chosen for further analysis, and designated
as hol1 and HOL1-OX, respectively.
Quantification of cmuA gene content and expression in the phyllosphere of A. thaliana HOL1
variants.
A quantitative PCR (qPCR) protocol targeting the chloromethane dehalogenase gene cmuA and the universal 16S ribosomal RNA gene in DNA obtained from washing of the leaf surface of A. thaliana was devel-oped. Quantification of copy numbers of cmuA and 16S rRNA genes was achieved, with a lower limit of 15 and 750 copies for cmuA and 16S rRNA genes respectively (Supplementary Information Fig. S2).The observed ratio of cmuA/16S rRNA gene copies was significantly higher (p = 0.049) in A. thaliana HOL1-OX plants, and significantly lower (p = 0.004) in hol1 plants, as compared to wild type plants (Fig. 1A). Per weight, this corresponded to cmuA gene copy numbers per mg of fresh leaf of 13 ± 3, 71 ± 28 and 157 ± 43 on hol1, wild type and HOL1-OX plants respectively (Supplementary Information Table S1). In contrast, no sig-nificant differences of 16S rRNA gene copies per mg of fresh leaf (~105 copies per mg, p > 0.4) were observed for
hol1, wild type and HOL1-OX plants.
Similar trends were observed in experiments performed with total leaf DNA, i.e. DNA extracted from both the surface and the interior of leaves (Fig. 1B). The obtained cmuA/16S rRNA ratio was approximately 100-fold higher with leaf surface DNA than with leaf total DNA. The number of gene copies of the 16S rRNA gene per mg
Figure 1. Relative abundance of cmuA in the phyllosphere of A. thaliana HOL1 variants. qPCR was performed
on DNA from leaf surface washings (A) and from total leaves (B). Results are expressed as copy number ratios of cmuA to 16S rRNA gene per µg of template DNA. Error bars represent propagated standard errors of three biological replicates, and small letters (a–c) indicate statistical significance at p < 0.05 by Student’s t-test.
www.nature.com/scientificreports/
fresh leaf was much higher in leaf total DNA (4.9 × 10⁵ for leaf surface DNA and of 6.9 × 10⁷ for leaf total DNA,
Table S1), likely because of high levels of plastid DNA containing this gene in DNA preparations.
The expression of cmuA gene relative to 16S rRNA gene was investigated by RT-qPCR on total RNA prepa-rations from plant leaves. Under our experimental conditions, 16S rRNA fulfills criteria for a reference gene as described20. As observed at the DNA level, differences were observed between different variants of A. thaliana
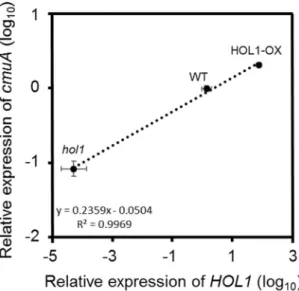
(Fig. 2), with HOL1-OX plants showing significantly higher expression of cmuA ( > 2-fold, p = 0.00005) com-pared to wild type A. thaliana, and hol1 plants showing 10 times lower (p = 0.00003) relative expression of cmuA compared to wild type A. thaliana. A significant and positive linear correlation (Pearson’s correlation coeffi-cient = 0.998, p = 0.035 at 95% confidence interval) was found between the expression of both plant HOL1 gene for chloromethane production and the bacterial gene cmuA for chloromethane degradation (Fig. 2).
Diversity of bacteria in the A. thaliana phyllosphere.
The correlation between HOL1 genotype andcmuA gene presence and expression was investigated further. In the 3 A. thaliana HOL1 variants, the composition
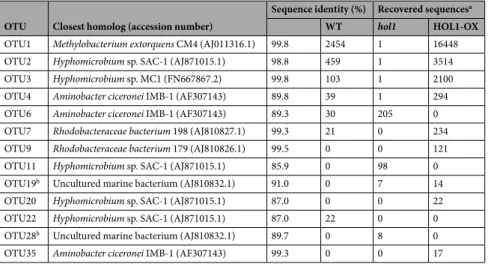
and diversity of the phyllosphere microbiota was compared. Sequence analyses of 16S rRNA and cmuA gene fragments, obtained after PCR amplification from leaf surface DNA and pyrosequencing was performed (Tables 1
and 2, Supplementary Information Table S4). DNA yields were similar for the 3 variants, and the numbers of sequences obtained after PCR amplification were similar in all variants for the 16S rRNA gene. In contrast, num-bers were different for the cmuA gene in the 3 variants, in good agreement with qPCR analysis (Supplementary Information Table S4). Based on 16S rRNA gene analysis (V1-V3 region), total microbiota was similar in the 3 variants. In total, 152 OTUs were detected with > 0.01 average abundance, 44 (28%) of which were common to
Figure 2. Relative expression of cmuA in the phyllosphere of A. thaliana HOL1 variants. Relative expression
levels of HOL1 (in reference to ACT2) and cmuA (in reference to 16S rRNA) were evaluated by RT-qPCR on total RNA from the 3 variants (hol1, WT and HOL1-OX) of A. thaliana. Expression levels were computed relative to wild-type A. thaliana using the comparative threshold amplification cycle method (2−ΔΔCt)20. Average
relative expression of HOL1 is plotted against average relative expression of cmuA (three biological replicates). Dotted line shows the linear regression (R square = 0.997, p = 0.035). Error bars represent propagated errors associated with cmuA and HOL1 expression.
Genusa WT hol1 HOL1-OX
Methylobacterium 80.8 ± 3.8 89.4 ± 6.7 87.0 ± 4.2 Sphingomonas 6.5 ± 1.2 1.5 ± 1.7 5.0 ± 0.2 Rhodococcus 2.9 ± 2.9 2.3 ± 0.2 4.5 ± 3.2 Nocardioides 1.4 ± 0.8 0.7 ± 0.8 0.2 ± 0.2 Sphingobium 1.1 ± 0.8 0.4 ± 0.1 0.7 ± 0.1 Pseudonocardia 0.8 ± 0.3 0.4 ± 0.2 0.4 ± 0.1 TM7b 0.5 ± 0.3 0.4 ± 0.3 0.1 ± 0.0 Aeromicrobium 0.4 ± 0.2 0.4 ± 0.3 0.8 ± 0.6 Microbacterium 0.2 ± 0.1 0.6 ± 0.6 0.2 ± 0.2
Table 1. Most abundant bacterial genera (%) based on 16S rRNA sequence analysis in the phyllosphere of A.
thaliana variants. aGenera with average abundance ≥ 0.5% in at least one of the 3 A. thaliana variants. bAll
the phyllospheres of the 3 variants, largely dominated by Methylobacterium and contributing to over 95% of the total sequences recovered (Table 1). The chloromethane-specific microbial subcommunity evidenced by analysis of the PCR-amplified cmuA gene showed limited sequence diversity (13 OTUs). Of these, 6 OTUs were closely similar to cmuA genes of known chloromethane-degrading strains.
In planta detection of chloromethane production.
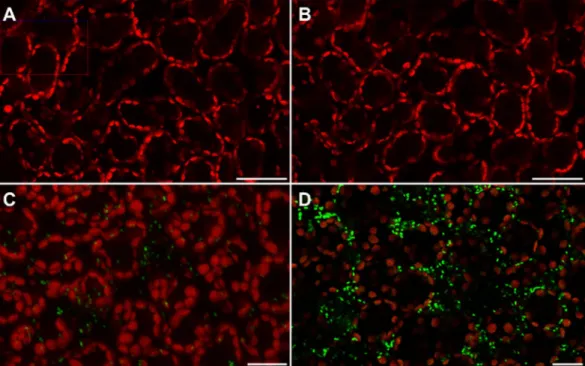
Detection of the amounts of chloromethane pro-duction by a bacterial fluorescent bioreporter, including on leaves of A. thaliana, was previously described21(Fig. 3). This bioreporter consists of the chloromethane-degrading strain M. extorquens CM4 containing a plas-mid harbouring the chloromethane dehalogenase cmuA gene promoter region fused upstream to the syfp2 gene for yellow fluorescent protein (YFP)22. Fluorescence of the bioreporter strain was only observed in the presence
of methyl halides, and was proportional to their concentration21. Here, two-weeks old seedlings of wild type, hol1,
and HOL1-OX A. thaliana variants were sprayed with a bioreporter cell suspension, and YFP fluorescence was observed using confocal laser scanning microscopy after 24 h incubation (Fig. 3).
No fluorescent cells were observed on leaves of hol1 plants, whereas a large number of fluorescent cells were visible on leaves of HOL1-OX and wild-type plants (Fig. 3). Quantification of fluorescent cells showed that the density of fluorescent cells on plant leaf surfaces was significantly higher for HOL1-OX plants than for wild type ( > 2.6-fold, p = 0.02) and for hol1 ( > 10-fold, p = 0.003) plants (Fig. 4). In contrast, the number of bioreporter bacteria colonising the phyllosphere, evaluated by determining copy numbers of the syfp2 on plant leaf DNA by qPCR, was not significantly different in the different plant variants (Supplementary Information Table S2).
Confocal microscopy also provided preliminary evidence on the source of chloromethane emissions on plant leaves (Fig. 5). Little is yet known on the localisation of the HOL1 methyltransferase and the expression profiles of the corresponding gene23. As reported previously for the tobacco phyllosphere with a methanol-based
biore-porter24, the chloromethane-based bioreporter was frequently observed to be associated with stomata, where
most gas exchange between plant leaves and the atmosphere takes place, as well as in the intercellular grooves and surfaces of epidermal cells (Fig. 5).
Discussion
Bacterial chloromethane utilisation was previously investigated in several environments18, yet the
phyllo-sphere environment, possibly the largest source of chloromethane6, had not yet been specifically explored in
this regard. The model system introduced in this work allowed us to demonstrate that both gene copy number (Fig. 1) and gene expression (Fig. 2) of the bacterial cmuA gene for chloromethane dehalogenase in phyllospheric DNA and RNA correlate with expression levels of the gene HOL1 responsible for chloromethane production (Supplementary Information Fig. S1C). In addition, application of a chloromethane-based bioreporter21 provided
direct evidence for in planta expression of cmuA in the phyllosphere, and confirmed that HOL1 gene variants of
A. thaliana indeed emit chloromethane at different levels (Fig. 3). This finding is important because direct in situ real-time measurements of chloromethane production in the phyllosphere at the required sensitivity are difficult to achieve21.
Bacteria of the genera Methylobacterium and Sphingomonas are predominant colonisers of the phyllo-sphere2,25, as also found here (Table 1). Nevertheless, a predominance of Methylobacterium such as that observed
here has not been reported so far, and may derive from controlled greenhouse conditions of our experiments compared to field conditions of previous studies. Indeed, site-specific factors were reported to strongly impact the proportion of Methylobacterium in a bacterial community26. Sphingomonas, the second most highly represented
OTU Closest homolog (accession number)
Sequence identity (%) Recovered sequencesa
WT hol1 HOL1-OX
OTU1 Methylobacterium extorquens CM4 (AJ011316.1) 99.8 2454 1 16448
OTU2 Hyphomicrobium sp. SAC-1 (AJ871015.1) 98.8 459 1 3514
OTU3 Hyphomicrobium sp. MC1 (FN667867.2) 99.8 103 1 2100
OTU4 Aminobacter ciceronei IMB-1 (AF307143) 89.8 39 1 294
OTU6 Aminobacter ciceronei IMB-1 (AF307143) 89.3 30 205 0 OTU7 Rhodobacteraceae bacterium 198 (AJ810827.1) 99.3 21 0 234 OTU9 Rhodobacteraceae bacterium 179 (AJ810826.1) 99.5 0 0 121
OTU11 Hyphomicrobium sp. SAC-1 (AJ871015.1) 85.9 0 98 0
OTU19b Uncultured marine bacterium (AJ810832.1) 91.0 0 7 14
OTU20 Hyphomicrobium sp. SAC-1 (AJ871015.1) 87.0 0 0 22
OTU22 Hyphomicrobium sp. SAC-1 (AJ871015.1) 87.0 22 0 0
OTU28b Uncultured marine bacterium (AJ810832.1) 89.7 0 8 0
OTU35 Aminobacter ciceronei IMB-1 (AF307143) 99.3 0 0 17
Table 2. Diversity of the cmuA chloromethane dehalogenase gene in the phyllosphere of A. thaliana variants.
aNumbers of sequences recovered by pyrosequencing after PCR amplification from the same amount of leaf
wash DNA preparation, averaged across 6 samples (technical duplicates of biological triplicates) for each A.
thaliana variant. bClosest cultivable chloromethane degraders were Hyphomicrobium sp. MC1 for OTU19
www.nature.com/scientificreports/
genus in our experiments, was substantially lower in the phyllosphere of the hol1 variant (Table 1). Sphingomonas strains have been reported to protect A. thaliana against pathogenic bacteria27, and A. thaliana disrupted in
the HOL1 gene was more prone to pathogen attack, possibly due to reduced production of methyl thiocyanate (CH3SCN) from glucosinolate-derived thiocyanate by HOL128. Indeed, disturbances in the metabolism of
gluco-sinolate compounds was reported to modify the bacterial diversity in the rhizosphere of A. thaliana29, and in the
phyllosphere of vegetable plants30.
The proportion of chloromethane-degrading bacteria in the phyllosphere microbiota inferred from qPCR of the cmuA gene have some important implications. First, the total size of the bacterial community (as deduced from 16S rRNA gene copies) is similar for all three A. thaliana variants, and is higher by several orders of mag-nitude than those of chloromethane-degrading bacteria containing the cmuA gene (Supplementary Information Table S1). This is in keeping with well-established knowledge that carbon compounds such as methanol and sugars are released from plant leaves in much larger quantities than chloromethane3,6. Second, if one considers
Figure 3. Confocal laser scanning micrographs showing in planta chloromethane dehalogenation. Yellow
fluorescent bacteria (green spots) are visible on plant leaf surfaces along with autofluorescence (red) from chlorophyll in A. thaliana hol1 (panel B), WT (panel C) and HOL1-OX (panel D) and an uninoculated control (panel A). Bars, 20 µm.
Figure 4. Quantification of fluorescent epiphytes on leaves inoculated with the live bacterial bioreporter.
Images were taken by confocal laser scanning microscope after 24 hours of inoculation and analysed by ImageJ. Error bars represent the standard deviation of three biological replicates and small letters (a–c) shows statistical significance at p < 0.05 by Student’s t-test.
a single cmuA copy per chloromethane-degrading bacterium as usually observed so far31, the average number
of chloromethane-degrading bacteria in the phyllosphere of wild-type A. thaliana may be estimated at approx-imately 71 ± 28 per mg of fresh leaf (Supplementary Information Table S1). Based on a chloromethane dehalo-genase activity of 1,670 µmol per day per mg protein by M. extorquens CM432, and on a value of approx. 165 fg
protein per bacterial cell33, this number of bacteria could transform about 20 pmol chloromethane per day per
mg of fresh leaf. By comparison, total emissions of chloromethane from wild type A. thaliana were reported at 0.6 pmol per day per mg of fresh leaf8, i.e. approximately an order of magnitude lower. This suggests not only that
the phyllosphere microbiota can serve as an efficient filter for plant emissions of chloromethane, but also that chloromethane emissions from plants reported in the literature reflect the difference between chloromethane emissions from vegetation and degradation of chloromethane by vegetation-associated bacteria, rather than total chloromethane production by vegetation.
Despite widely available methanol, the modest amounts of chloromethane produced by A. thaliana are associ-ated with an increased presence of chloromethane-degrading methylotrophic bacteria containing the cmuA gene in the phyllosphere. Whether this is solely due to chloromethane-dependent growth or to another as yet unknown phenomenon is still unknown, and deserves further investigation.
In conclusion, the biomolecular tools developed here to quantify gene signatures for chloromethane produc-tion and utilisaproduc-tion, as well as to detect and potentially quantify chloromethane producproduc-tion, may eventually con-tribute to better estimates of the overall budget of chloromethane crucial to environmental issues associated with destruction of stratospheric ozone. This, however, will require a better understanding of bacterial chloromethane utilisation in the environment. An important open question in this context is whether pathways for utilisation of
Figure 5. Localisation of bioreporter bacteria on the leaf surface of A. thaliana. (A and B) Representative
confocal laser scanning microscope images (Z-stack mode to construct 3D image) showing yellow fluorescent chloromethane-bioreporter bacteria (green spots) on the surface of a wild type A. thaliana leaf, with autofluorescent chlorophyll (red) from plant cells underneath. (C) Phase contrast image merged to the corresponding fluorescence image shows fluorescent chloromethane-bioreporter bacteria (green spots), at stomata (black arrows), and the intercellular grooves of leaf epidermal cells (white arrows) of an inoculated wild-type plant.
www.nature.com/scientificreports/
chloromethane other than the cmu pathway, the only microbial pathway for chloromethane degradation char-acterised so far, are also relevant in defining the bacterial sink for natural emissions of chloromethane to the atmosphere, and from the phyllosphere in particular.
Methods
Chemicals and reagents.
All chemicals and reagents (purity: > 99%) were obtained from Sigma-Aldrich unless otherwise stated. Buffers, culture media and solutions were prepared in ultra-pure water (PURELAB clas-sic, ELGA) and sterilisation was done by autoclaving (20 min at 121 °C under 2 bars) or by filtration (0.2 µm, Nalgene).Bacterial strains and growth conditions.
Chloromethane-degrading Methylobacterium extorquens CM4 (NCIMB 13688, VKM B-2223) and the bioreporter strain were laboratory stocks conserved at −80 °C in 10% glycerol in minimal mineral medium (M3)14. Liquid cultures were performed in 50 mL M3 medium inErlenmeyer flasks (250 mL) fitted with sealed mininert valve caps (Supelco) and incubated at 30 °C with agitation at 100 rpm. Liquid M3 medium was supplemented with 20 mM methanol and/or chloromethane as described previously12. Growth of liquid cultures was monitored by measuring optical density at 600 nm.
Plant material and growth conditions.
All plants used in this study belonged to the Arabidopsis thaliana Columbia (Col-0) background. The Salk T-DNA lines of hol1 mutant plants (SALK_005204, hol1-1, hol1-2, andhol1-3) were obtained from the Salk Institute (http://signal.salk.edu/cgi-bin/tdnaexpress), and seeds of the A.
thaliana lines HOL1-OX1 and HOL1-OX6 (expressing HOL1 under the control of the CaMV 35 S promoter) were
obtained from Drs. Yukari Nagatoshi and Tatsuo Nakamura (Yokohama National University, Yokohama, Japan). Plants were grown at 22 °C with a 12 hours light period in standard horticultural soil in a plant growth chamber (PGC-15.5HILX) (Percival Scientific, USA). Relative humidity was 60% to 80%, and photon fluence rate from white fluorescent tubes was 60 μmol m−2 s−1 at the level of rosettes34.
Wild-type (Col-0) and HOL1 gene mutants of A. thaliana were screened by PCR reactions (Supplementary Information Fig. S1).
DNA extraction from plants.
For leaf total DNA, fresh green leaves (2–3 leaves, 100–230 mg) were plucked from plants just before flower bolting stage. Total DNA from leaves was extracted using the FAST DNA spin kit (MP Biomedicals, Santa Ana, CA) as described35. Leaf material was transferred to lysing matrix A tubes andmacerated in 200 µL of phosphate buffer (120 mM, pH 8). After addition of 600 µL CLS-VF buffer and 200 µL PPS buffer from the kit, leaf material was lysed using a Mikro-Dismembrator (Sartorius Stedim Biotech, France) with 3 treatments of 1 min each at 3000 min−1. DNA was then purified from the lysate according to the manufacturer’s
protocol. Final elution of purified DNA was performed in 100 µL of DNase-free sterile water. DNA was quantified by NanoDrop and purity was checked by gel electrophoresis on agarose gel (1%).
Leaf surface bacterial DNA was extracted from A. thaliana leaf washings using a protocol adapted from the lit-erature36,37. Briefly, 10–15 leaves of A. thaliana plants (1–2 g fresh weight) were washed in 50 mL sterile tubes
con-taining 30 mL TE buffer (pH 7.5) with 0.2% Silwet L-77 (GE Bayer Silicones). Bacteria were dislodged from the leaf surface by shaking (350 rpm, 10 min) and sonication (25% amplitude, 30 seconds, Vibracell 75042, Bioblock Scientific), followed by vortexing for 30 seconds. The resulting suspensions were then filtered (Nylon net filters 180 µm; Millipore) to separate leaf material from cell suspensions. Percoll was added to the cell suspensions, and centrifuged at 12′000 g for 10 min. Supernatant was removed, and the obtained cell pellet was washed in TE buffer (pH 7.5), resuspended in 200 µL of TE buffer (pH 7.5), and transferred to lysing matrix A tubes for DNA extraction using the Fast DNA spin kit (MP Biomedicals, Santa Ana, CA). Cells lysis was performed in 800 µL of CLS-VC reagent from the kit using Mikro-Dismembrator (Sartorius Stedim Biotech, France) with three treat-ments of 45 s each at 3000 min−1. DNA was extracted from the lysate using the protocol as described above for
leaf total DNA.
Total RNA extraction from plants.
Total RNA from plant leaves was extracted from 8–10 weeks old wild-type, hol1 and HOL1-OX6 plants of A. thaliana. Leaf samples (100 mg) were transferred to 1.5 mL RNase-free tube and immediately flash frozen in liquid nitrogen. The leaf material was lysed under liquid nitro-gen in lysing matrix A tubes (MP Biomedicals, Santa Ana, CA) using Mikro-Dismembrator (Sartorius Stedim Biotech, France) with 3 treatments of 1 min each at 3000 min−1. Total RNA was extracted using the NucleoSpinRNA plant kit (Macherey-Nagel, France), according to the manufacturer’s protocol. RNA was quantified by NanoDrop, and purity was checked by gel electrophoresis (1% agarose gel). Absence of DNA contamination in the RNA was checked by PCR with ACT2 gene primers (Supplementary Information Table S3).
Primer design.
Primers used in this study are listed in Supplementary Information Table S3. Primers for qPCR of HOL1 plant gene were designed using PrimerQuest tool (Integrated DNA Technologies), and their specificity was verified with a BLAST analysis at NCBI. Primers for qPCR of cmuA were designed on the basis of alignments of cmuA sequences from reference chloromethane-degrading strains. Already described forward primer cmuA802F17 and a newly designed reverse primer cmuA968R with identity > 80% over the entire lengthof primer with all cmuA sequences in the NCBI database, were used.
Quantitative PCR (qPCR).
Evaluation of cmuA and 16S rRNA gene copy number was performed by qPCR using GeneAmp 5700 Sequence Detection System (Applied Biosystems). Analyses were carried out in a 96 well reaction PCR plate (Applied Biosystems), using gene specific primers (Supplementary Information Table S3 for sequences and references of all primers) in a total reaction volume of 20 µL, as described previously12. Conditionsfor qPCR reaction consisted of initial denaturation at 95 °C for 10 min, followed by 40 cycles of denaturation at 95 C for 15 s and annealing/elongation at 60 °C for 60 s. Negative controls without DNA and control reactions to check for absence of inhibition of PCR amplification in each DNA sample were performed by spiking known quantities of M. extorquens CM4 DNA. Specificity of amplification was determined after qPCR cycles from dis-sociation curves obtained by increasing 1 °C per 30 s from 60 °C to 90 °C, or after gel electrophoresis of PCR products on 2% agarose. The gene copy number of cmuA and 16S rDNA per µg of phyllosphere DNA were deter-mined using calibration curves obtained from qPCR of tenfold dilution series of DNA standards (Supplementary Information Fig. S2). Analyses were performed with at least three biological replicates of each plant type and three technical repeats for each biological sample.
Quantitative reverse transcriptase – PCR (RT-qPCR).
Expression of HOL1 gene in plant leaves was quantified using ACT2 as a reference gene in RT-qPCR analysis. Superscript III Reverse Transcriptase Kit (Invitrogen) was used to synthesize cDNA from plant total RNA (500 ng) using random primers (Roche) accord-ing to the manufacturer’s protocol. Expression of bacterial cmuA gene in plant leaves was also quantified by RT-qPCR analysis, using 16S rRNA as a reference gene. Phyllosphere total RNA (500 ng) was used to synthe-size cDNA using Superscript III Reverse Transcriptase Kit (Invitrogen), and gene specific primers (cmuA968R and PROK1492R for cmuA and 16S rRNA respectively) according to the manufacturer’s protocol. After the RT reaction, the cDNA was diluted 2.5 times, and 5 µL used as template for qPCR. Real-time qPCR measurements were performed as described above for DNA samples. Control reactions without RT enzyme were performed for each RNA extraction to check for absence of contaminating DNA. The relative level of cmuA and HOL1 gene expression was estimated using the comparative threshold amplification cycle method (2−ΔΔCt) as described20.Analysis was performed with three to five biological replicates of each plant type, with three technical repeats for each biological replicate.
Pyrosequencing analysis.
DNA was extracted as described above. Bacterial tag-encoded FLX 454 pyrose-quencing of phyllosphere DNA (bTEFAP) was performed by Research and Testing Laboratory (Lubbock, TX, USA) as described previously38–40, with a Genome Sequencer FLX instrument and Titanium protocols andrea-gents (Roche Applied Science, Indianapolis, IN). Primers Gray28F and Gray519R (Supplementary Information Table S4) spanning the variable regions V1–V3 in the 16S rRNA gene38,39 were used in a single step PCR reaction
(35 cycles) using HotStar HiFidelity Polymerase (Qiagen, Valencia, CA). Primer cmuA802F17 was used together
with primer cmuA1244R (Supplementary Information Table S4) for amplification of a 443 bp cmuA amplicon under the same conditions.
Sequence processing and analysis.
For amplicons of the 16S rRNA gene, obtained sequences were screened, failed sequence reads, low quality sequence ends, tags and primers were removed, and non-bacterial ribosome sequences, chimeras detected using black box chimera check software B2C241, and short reads(<250 bp) were discarded as described previously38–40. Operational taxonomic units (OTUs) were assigned at
5% dissimilarity, commonly used to represent the genus level42, validated using taxonomic distance methods, and
data reduction analysis performed as described previously38,40.
For cmuA amplicon analysis, Mothur43 was used to extract flow grams from sff files. Flow grams were
de-noised and translated to DNA sequences, and reads with errors in the barcode or primer region, ambigu-ous bases, or homopolymer runs > 6 bp were removed. Quality filtering and sizing of reads (between 400 and 450 bp), conversion to fasta format, read dereplication, abundance sorting and removal of singletons was done with USEARCH44. Chimeras were filtered out using UCHIME within USEARCH. Iterative clustering of OTUs
was carried out with UPARSE within USEARCH to a cutoff of 85%. The most abundant sequence within each OTU was chosen as representative of the OTU, and taxonomic affiliation was performed by Blast comparisons to the Genbank database.
Inoculation of bioreporter to plant leaves.
The bacterial bioreporter strain constructed based on plas-mid harbouring the syfp2 gene coding for yellow fluorescent protein (YFP) fused with the promoter region ofcmuA gene21 was grown until mid-exponential phase (OD
600 ~0.4) in M3 medium supplemented with MeOH
(20 mM). Cells were harvested after centrifugation at 4500 x g, washed and resuspended in M3 medium at a final OD600 of 0.2.
A. thaliana wild type, hol1 and HOL1-OX plants were grown in Petri dishes on Murashige and Skoog (MS)
medium including vitamins (Duchefa) supplemented with 1% sugar and 0.7% pastagar. Plant seeds were surface sterilised (with 25% commercial solution of sodium hypochlorite for 10 minutes and then rinsed five times with sterile water) before sowing to avoid undesired bacteria on plant leaves. Plants were grown at 22 °C with 12 hours light period for 14-days in a plant growth room. Cells suspensions (5 mL per Petri dish containing 20 plants) were sprinkled uniformly on leaves and left to dry for 1 hour under a laminar flow hood. Petri dishes were then further incubated for 24 hours under the same plant growth conditions before observation under confocal microscopy.
Confocal microscopy and image analysis.
Leaves of similar sizes were cut from plants treated with the bioreporter, mounted on microscope glass slides and visualised for YFP fluorescence (YFP filter, 488 nm) under the 20x lens of confocal laser scanning microscope (Zeiss LSM710), and images were recorded. Three images from different locations per plant, and three plants for each genotype were randomly selected. Images were analysed to quantify YFP fluorescence on leaves using ImageJ software (http://rsbweb.nih.gov/ij/index.html). Fluorescence intensity was used to discriminate bacteria from the background. Each fluorescent spot identified by ‘Find maxima imageJ’ tool with noise value set at 50 was considered as a fluorescent bacterial bioreporter cell, andwww.nature.com/scientificreports/
the number of fluorescent cells per mm² was measured. After confocal observation, total DNA was also extracted from inoculated leaves to confirm the equal abundance of bioreporter bacteria on each type of plant by qPCR of the syfp2 gene.
Statistical analysis.
Experiments were performed in at least three biological replicates, with two to three technical repeats for each biological replicate. For statistical significance, data were analysed using Student’s t test, with different letters in figures indicating statistically significant differences at p < 0.05. Pearson’s correlation coefficient R for average relative expression levels of HOL1 versus the average relative expression levels of cmuA (Fig. 2), and propagated errors, were calculated from errors associated with values of cmuA and HOL1 expression based on ± 1 standard deviation of the mean of 3 replicate measurements45.Data Availability.
The sequence data generated in this study were deposited to Genbank under accession numbers SAMN07314135-SAMN07314170 (Bioproject PRJNA393055).References
1. Vorholt, J. A. Microbial life in the phyllosphere. Nat. Rev. Microbiol. 10, 828–840 (2012).
2. Ryffel, F. et al. Metabolic footprint of epiphytic bacteria on Arabidopsis thaliana leaves. The ISME J. 10, 632–643 (2016).
3. Galbally, I. E. & Kirstine, W. The production of methanol by flowering plants and the global cycle of methanol. J. Atmos. Chem. 43, 195–229 (2002).
4. Bringel, F. & Couée, I. Pivotal roles of phyllosphere microorganisms at the interface between plant functioning and atmospheric trace gas dynamics. Front. Microbiol. 6, art. 486 (2015).
5. Saito, T. & Yokouchi, Y. Stable carbon isotope ratio of methyl chloride emitted from glasshouse-grown tropical plants and its implication for the global methyl chloride budget. Geophys. Res. Lett. 35, art. L08807 (2008).
6. Carpenter, L. J. et al. In Scientific Assessment of Ozone Depletion: 2014, Global Ozone Research and Monitoring Project Vol. Report No. 55, Ch. 1, (World Meteorological Organization, 2014).
7. Attieh, J., Sparace, S. A. & Saini, H. S. Purification and properties of multiple isoforms of a novel thiol methyltransferase involved in the production of volatile sulfur compounds from Brassica oleracea. Arch. Biochem. Biophys. 380, 257–266 (2000).
8. Rhew, R. C., Ostergaard, L., Saltzman, E. S. & Yanofsky, M. F. Genetic control of methyl halide production in Arabidopsis. Current
Biol. 13, 1809–1813 (2003).
9. Itoh, N. et al. Involvement of S-adenosylmethionine-dependent halide/thiol methyltransferase (HTMT) in methyl halide emissions from agricultural plants: isolation and characterization of an HTMT-coding gene from Raphanus sativus (daikon radish). BMC
Plant Biol. 9, art. 116 (2009).
10. Doronina, N. V., Sokolov, A. P. & Trotsenko, Y. A. Isolation and initial characterization of aerobic chloromethane-utilizing bacteria.
FEMS Microbiol. Lett. 142, 179–183 (1996).
11. Schäfer, H., Miller, L. G., Oremland, R. S. & Murrell, J. C. Bacterial cycling of methyl halides. Adv. Appl. Microbiol 61, 307–346 (2007).
12. Nadalig, T. et al. Detection and isolation of chloromethane-degrading bacteria from the Arabidopsis thaliana phyllosphere, and characterization of chloromethane utilisation genes. FEMS Microbiol. Ecol. 77, 438–448 (2011).
13. Vannelli, T., Messmer, M., Studer, A., Vuilleumier, S. & Leisinger, T. A corrinoid-dependent catabolic pathway for growth of a
Methylobacterium strain with chloromethane. Proc. Natl. Acad. Sci. USA 96, 4615–4620 (1999).
14. Roselli, S., Nadalig, T., Vuilleumier, S. & Bringel, F. The 380 kb pCMU01 plasmid encodes chloromethane utilization genes and redundant genes for vitamin B12- and tetrahydrofolate-dependent chloromethane metabolism in Methylobacterium extorquens CM4: a proteomic and bioinformatics study. PloS ONE 8, art. e56598 (2013).
15. Studer, A., Stupperich, E., Vuilleumier, S. & Leisinger, T. Chloromethane:tetrahydrofolate methyl transfer by two proteins from
Methylobacterium chloromethanicum strain CM4. Eur. J. Biochem. 268, 2931–2938 (2001).
16. Studer, A., McAnulla, C., Büchele, R., Leisinger, T. & Vuilleumier, S. Chloromethane induced genes define a third C1 utilization pathway in Methylobacterium chloromethanicum CM4. J. Bacteriol. 184, 3476–3484 (2002).
17. Miller, L. G. et al. Degradation of methyl bromide and methyl chloride in soil microcosms: Use of stable C isotope fractionation and stable isotope probing to identify reactions and the responsible microorganisms. Geochim. Cosmochim. Acta 68, 3271–3283 (2004). 18. McAnulla, C., McDonald, I. R. & Murrell, J. C. Methyl chloride utilising bacteria are ubiquitous in the natural environment. FEMS
Microbiol. Lett. 201, 151–155 (2001).
19. Midorikawa, K., Nagatoshi, Y. & Nakamura, T. A selection system for transgenic Arabidopsis thaliana using potassium thiocyanate as the selective agent and AtHOL1 as the selective marker. Plant Biotechnol. 26, 341–344 (2009).
20. Schmittgen, T. D. & Livak, K. J. Analyzing real-time PCR data by the comparative CT method. Nat. Protoc. 3, 1101–1108 (2008).
21. Farhan Ul Haque, M. et al. Fluorescence-based bacterial bioreporter for specific detection of methyl halide emissions in the environment. Appl. Environ. Microbiol. 79, 6561–6567 (2013).
22. Kaczmarczyk, A. et al. Role of Sphingomonas sp strain Fr1 PhyR-NepR-sEcfG cascade in general stress response and identification of
a negative regulator of PhyR. J. Bacteriol. 193, 6629–6638 (2011).
23. Nagatoshi, Y. & Nakamura, T. Characterization of three halide methyltransferases in Arabidopsis thaliana. Plant Biotechnol. (Tokyo)
24, 503–506 (2007).
24. Abanda-Nkpwatt, D., Musch, M., Tschiersch, J., Boettner, M. & Schwab, W. Molecular interaction between Methylobacterium
extorquens and seedlings: growth promotion, methanol consumption, and localization of the methanol emission site. J. Exp. Bot. 57,
4025–4032 (2006).
25. Bodenhausen, N., Horton, M. W. & Bergelson, J. Bacterial communities associated with the leaves and the roots of Arabidopsis
thaliana. PLoS ONE 8, art. e56329 (2013).
26. Knief, C., Ramette, A., Frances, L., Alonso-Blanco, C. & Vorholt, J. A. Site and plant species are important determinants of the
Methylobacterium community composition in the plant phyllosphere. The ISME J. 4, 719–728 (2010).
27. Innerebner, G., Knief, C. & Vorholt, J. A. Protection of Arabidopsis thaliana against leaf-pathogenic Pseudomonas syringae by
Sphingomonas strains in a controlled model system. Appl. Environ. Microbiol. 77, 3202–3210 (2011).
28. Nagatoshi, Y. & Nakamura, T. Arabidopsis harmless to ozone layer protein methylates a glucosinolate breakdown product and functions in resistance to Pseudomonas syringae pv. maculicola. J. Biol. Chem. 284, 19301–19309 (2009).
29. Bressan, M. et al. Exogenous glucosinolate produced by Arabidopsis thaliana has an impact on microbes in the rhizosphere and plant roots. The ISME J. 3, 1243–1257 (2009).
30. Ruppel, S., Krumbein, A. & Schreiner, M. Composition of the phyllospheric microbial populations on vegetable plants with different glucosinolate and carotenoid compositions. Microb. Ecol. 56, 364–372 (2008).
31. Nadalig, T., Greule, M., Bringel, F., Keppler, F. & Vuilleumier, S. Probing the diversity of chloromethane-degrading bacteria by comparative genomics and isotopic fractionation. Front. Microbiol 5, art. 523 (2014).
32. Vannelli, T., Studer, A., Kertesz, M. & Leisinger, T. Chloromethane metabolism by Methylobacterium sp. strain CM4. Appl. Environ.
Microbiol. 64, 1933–1936 (1998).
33. Milo, R. & Phillips, R. Cell Biology by the Numbers (Garland Science, 2015).
34. Babiychuk, E. et al. Allelic mutant series reveal distinct functions for Arabidopsis cycloartenol synthase 1 in cell viability and plastid biogenesis. Proc. Natl. Acad. Sci. USA 105, 3163–3168 (2008).
35. Knief, C., Frances, L., Cantet, F. & Vorholt, J. A. Cultivation-independent characterization of Methylobacterium populations in the plant phyllosphere by automated ribosomal intergenic spacer analysis. Appl. Environ. Microbiol. 74, 2218–2228 (2008).
36. Delmotte, N. et al. Community proteogenomics reveals insights into the physiology of phyllosphere bacteria. Proc. Natl. Acad. Sci.
USA 106, 16428–16433 (2009).
37. Gourion, B., Rossignol, M. & Vorholt, J. A. A proteomic study of Methylobacterium extorquens reveals a response regulator essential for epiphytic growth. Proc. Natl. Acad. Sci. USA 103, 13186–13191 (2006).
38. Ishak, H. D. et al. Bacterial diversity in Solenopsis invicta and Solenopsis geminata ant colonies characterized by 16S amplicon 454 pyrosequencing. Microb. Ecol. 61, 821–831 (2011).
39. Handl, S., Dowd, S. E., Garcia-Mazcorro, J. F., Steiner, J. M. & Suchodolski, J. S. Massive parallel 16S rRNA gene pyrosequencing reveals highly diverse fecal bacterial and fungal communities in healthy dogs and cats. FEMS Microbiol. Ecol. 76, 301–310 (2011). 40. Dowd, S. E. et al. Evaluation of the bacterial diversity in the feces of cattle using 16S rDNA bacterial tag-encoded FLX amplicon
pyrosequencing (bTEFAP). BMC Microbiol. 8, art. 125 (2008).
41. Gontcharova, V. et al. Black box chimera check (B2C2): a Windows-based software for batch depletion of chimeras from bacterial 16S rRNA gene datasets. Open Microbiol. J. 4, 47–52 (2010).
42. McKenna, P. et al. The macaque gut microbiome in health, lentiviral infection, and chronic enterocolitis. PLoS Pathog. 4, art. e20 (2008).
43. Schloss, P. D. et al. Introducing Mothur: Open-source, platform-independent, community-supported software for describing and comparing microbial communities. Appl. Environ. Microbiol. 75, 7537–7541 (2009).
44. Edgar, R. C. UPARSE: highly accurate OTU sequences from microbial amplicon reads. Nature Met. 10, 996–998 (2013).
45. D. C. Baird, D. C. Experimentation: An Introduction to Measurement Theory and Experiment Design (Benjamin Cummings, 3rd edn, 1994).
Acknowledgements
Work on this project was supported by a PhD grant from Higher Education Commission Pakistan to M.F.U.H; by REALISE, the Alsace network of laboratories in environmental sciences and engineering (realise.unistra. fr); by the INSU – CNRS EC2CO project PLANTACHLORE; and by the DFG-ANR project CHLOROFILTER (ANR-14-CE35-0005-01, DFG KE 884/10-1), through a postdoctoral fellowship to L.B. We thank Drs. Yukari Nagatoshi and Dr. Tatsuo Nakamura (Yokohama National University, Yokohama, Japan) for kindly providing seeds of HOL1-OX1 and HOL1-OX6 A. thaliana lines, Dr. Sandly Babar for help with plant cultivation, and Dr. Gwenaël Imfeld for help with statistical analysis.
Author Contributions
M.F.U.H., H.S. and S.V. conceived the work and designed experiments, and M.F.U.H., J.M. and H.S. performed the experiments. All co-authors contributed to analyse the data, write the manuscript, and take public responsibility for the manuscript content.
Additional Information
Supplementary information accompanies this paper at https://doi.org/10.1038/s41598-017-17421-y.
Competing Interests: The authors declare that they have no competing interests.
Publisher's note: Springer Nature remains neutral with regard to jurisdictional claims in published maps and
institutional affiliations.
Open Access This article is licensed under a Creative Commons Attribution 4.0 International
License, which permits use, sharing, adaptation, distribution and reproduction in any medium or format, as long as you give appropriate credit to the original author(s) and the source, provide a link to the Cre-ative Commons license, and indicate if changes were made. The images or other third party material in this article are included in the article’s Creative Commons license, unless indicated otherwise in a credit line to the material. If material is not included in the article’s Creative Commons license and your intended use is not per-mitted by statutory regulation or exceeds the perper-mitted use, you will need to obtain permission directly from the copyright holder. To view a copy of this license, visit http://creativecommons.org/licenses/by/4.0/.