DESIGN OF AN ELECTROCARDIOGRAM MACHINE USING A PERSONAL COMPUTER
by
Luis Parra
B.S., Mechanical Electrical Engineering National Autonomous University of Mexico, 1996
Submitted to the Department of Electrical Engineering and Computer Science in partial fulfillment of the requirements for the degree of
Master of Science in Electrical Engineering
at the
Massachusetts Institute of Technology June, 1998
©1998 Massachusetts Institute of Technology All rights reserved
The author hereby grants to MIT permission to reproduce and distribute publicly paper and electronic copies of this thesis document in whole or in part, and to grant others the right to do so.
I
Signature of Author
A Department of Electrical Engineering and Computer Science May 22, 1998 Certified by Accepted by hen K. Bums S /-' j3 esisSi-u_ eisor Artltir C. Smith
Chairman, Department Committee on Graduate Students
DESIGN OF AN ELECTROCARDIOGRAM MACHINE USING A PERSONAL COMPUTER
by Luis Parra
Submitted to the DEPARTMENT OF ELECTRICAL ENGINEERING AND COMPUTER SCIENCE in partial fulfillment of the requirements for the degree of
Master of Science
Abstract
The goal of this work is to demonstrate the feasibility of using an inexpensive personal computer as the basis of a medical instrument which can be implemented and maintained in a developing country. Personal computers have become a commodity; they are inexpensive, available and are locally supported. A computer can be an instrument. This instrument can replace a traditional instrument; it can offer equal or better performance than the traditional dedicated instrument but have the advantages of a much larger user base of the personal computer hardware, software and support. I will develop and demonstrate a clinical electrocardiogram machine. I will use a PC, an Visual-Basic to develop a "Virtual Electrocardiogram Machine". This will present a waveform in real-time allowing the operator to judge the quality and placement of the electrodes in the same manner as in the traditional machine. Leads can be selected, sensitivity and chart-speed can be selected with "controls" on the virtual EKG machine. In addition, the machine will allow selection and mounting of EKG to form an electrogram, annotated with date, time, names, etc. Transmission to a remote physician (Telemedicine) is an added possibility offered by the computer as is a diagnostic analysis program run on the local machine.
Thesis Supervisor: Stephen K. Burns Title: Senior Research Scientist, HST.
ACKNOWLEDGMENTS
First of all, I want to thank my thesis advisor, Prof. Stephen Burns for his support, guidance, help and patience through all this work.
I want to thank to the National Autonomous University of Mexico, the school of Engineering, and in particular, I would like to thank Jose L. Perez Silva and Wilfredo Martinez for their support during my undergraduate thesis work.
I want to thank Impulmex, and in particular to Mario Villafafia for his help in obtaining valuable information of the Medical Device Industry in Mexico.
I was able to come to M.I.T. because of the support CONACYT, and the Electrical Engineering and Computer Science Department at M.I.T.
I thank all my friends at M.I.T. and Boston that made my life during this time much fun. I want to thank my Parents, Jorge and Stella, thanks to your support during this time. I want to thank my brothers and sisters Estela, Teresa, Jorge, Pablo and my Nephew Vicente.
INDEX.
Abstract. ... 2 Acknowledgments. ... 3 Index ... 4 List of Figures. ... 6 List of Tables . ... 8 Chapter 1. Introduction. ... 9 1.1 Background ... ... 9 1.2 General overview. ... 10Chapter 2. Electrocardiograph Machines. ... ... ... 12
2.1 Background ... .. 12
2.2 Normal adult 12-lead EKG. ... 15
2.3 National Standards for Electrocardiograph machines . ... 17
2.3.1 EC11 Standard ... 18
Chapter 3. Entering An Emerging Medical Technology to the Market. ... 25
3.1 Overview Of The Medical Device Industry. . ... .. 25
3.2 EKG Technology and Market Opportunities. ... 27
3.3 Introducing New Medical Technologies to Mexico. ... 28
Chapter 4. Hardware description ... 33
4.1 Background. ... ... 33
4.2 Electrodes and Lead Selector. ... 34
4.2.1 Lead Selector ... ... ... 35
Index
4.3 Amplification of the EKG signal. . ... 43
4.4 Noise and Antialiasing Filtering ... ... 44
4.5 Data Acquisition. ... ... 48
Chapter 5. Graphic User Interface ... 57
5.1 Visual Basic Terminal ... ... 57
5.1.1 Serial Communication ... .... 58
5.1.2 Display Text . ... 59
5.1.3 Graphic Interface ... .... 59
5.1.4 Presenting and Storing EKG Histograms. ... 63
5.1.5 Lead Selector ... ... 65
Chapter 6. Conclusion ... ... 66
APPENDIX A. Assembler Code for ADC 1251 Extensions to Basic ... ... 68
APPENDIX B. Visual Basic Code For the virtual EKG Machine ... 81
APPENDIX C. Complete Circuit Diagram ... 97
List of Figures
Figure 2.1 Standard Bipolar and Unipolar Precordial Leads. ... 13
Figure 2.2 Typical 12 leads electrogram. ... 14
Figure 2.3 Clinical EKG -Components and Intervals. ... 15
Figure 3.1 Typical supply channel for Home Health Care Devices. ... 28
Figure 3.2 Age distribution in Mexico by 1996. ... . 30
Figure 4.1 EKG Monitor System Block Diagram. ... . 33
Figure 4.2 Interface Circuit. ... ... 34
Figure 4.3 Lead Selector Buffer. ... ... 35
Figure 4.4 Lead Selector Circuit. ... 38
Figure 4.5 Switch Control Diagram. ... 40
Figure 4.6 Triangular wave signal for Method D. ... . 41
Figure 4.7 Triangular wave generator. ... 41
Figure 4.8 Amplifier Circuit. ... ... 43
Figure 4.9 Frequency response of an 8h order low-pass filter. ... 45
Figure 4.10 Circuit diagram of an 8th order high-pass filter. ... 46
Figure 4.11 Frequency response of and 8th order high-pass filter. ... 46
Figure 4.12 Noise Filters Block Diagram. ... ... 47
Figure 4.13 EKG signal before and after being filtered. ... 47
Figure 4.14 Antialiasing Filter. ... ... 48
Figure 4.15 Timing diagram for the Calibration Cycle. ... 49
Figure 4.16 Auto-calibration cycle Flow diagram. ... . 50
Figure 4.17 Timing diagram using S/H to start a conversion without Auto-zero ... 51
Figure 4.18 ADC1251 Clock circuit. ... 51
Figure 4.19 ADC1251 Interface circuit. ... 53
Figure 4.20 Flow diagram for an A/D conversion. ... . 54
List of Figures
Figure 5.1 Graphic user interface flow diagram. ... .... 58
Figure 5.2 Data acquisition flow diagram. ... 60
Figure 5.3 VEKG. Selecting 3 seconds of signal to be stored. ... 62
Figure 5.4 VEKG. Presentation of an Electrogram. ... . 63
List of Tables
Table 2.1 Definition of Electrode Connection. ... ... 19
Table 2.2 Operating Conditions. ... ... 20
Table 2.3 Definition of Leads (EC11). ... ... 21
Table 2.4 Summary of Performance Requirements. ... . 22
Table 3.1 Medical Infrastructure in Mexico by 1996. ... 29
Table 4.1 Switch Selector Values. ... ... 39
Table 4.2 Frequency response. ... ... 40
CHAPTER I
INTRODUCTION
1.1 Background
The electrocardiogram is an important and common medical procedure, providing an insight into the patient's cardiac function [1]. The electrocardiogram provides valuable information to the clinician [1]. It is particularly useful in defining cardiac rhythm, identifying chamber hypertrophy and documenting ischemia and infarction [2].
Cardiovascular diseases still cause 12 million deaths in the world each year, according to the third monitoring report of the World Health Organization, 1991-1993 [3, 4]. They cause half of all deaths in several developed countries, and are one of the main causes of death in many developing countries and the major cause in adults. In Mexico, data indicate approximately 65,000 deaths from cardiovascular diseases per year. This represent about 15% of all deaths.
In the hospital environment, EKG may be monitored continuously to alert medical staff of any sudden changes in patient status. EKG readings are also taken in an emergency outside the hospital by paramedics where the EKG machine is small and portable.
While the elite in developing countries have access to private hospitals with services equivalent to those in developed countries, the rest of the population must depend on public hospitals and services frequently lacking the most critical supplies and unable to modernize their technological infrastructure. In addition, shortages of parts and deficiencies in maintenance have paralyzed many installations.
The goal of this work is to develop an EKG machine that is cost effective to be used in clinics of developing countries like Mexico.
Accordingly to information from the government of Mexico [5], the number of operating rooms in Mexico is 2,568; from those 1,156 are in private hospitals and the rest is in a government hospitals. There are 133,711 hospital beds from which about 55% are in private hospitals. That same source states that there are 1,698 Electrocardiograph machines in private
Chapter I. Introduction
hospitals; from the information above we can estimate that there are about 1,389 EKG machines in public (government) hospitals and a total of 3,087 in the whole country. The total population in Mexico is about 95 Million.
The cost of an EKG machine in Mexico is about US$5,000.00 to $10,000.00. The estimated cost of the "Virtual EKG Machine" including a computer is estimated to be less than US$2,000.00. A computer can be repaired everywhere, reducing maintenance and supply costs considerably. For example, the EKG machines use a special paper that is quite expensive; by using a computer, we have the advantage of printing the electrogram as many times as we want, along with the patient name and some other information that can be useful on a common piece of bond paper that doesn't fade away.
In addition to the economic advantage of this machine it can be used for other purposes like database, information storage and other applications usually done with a personal computer. Everyday more personal computers get connected to each other. The information that was obtained using one computer can be sent directly to the physician personal computer where he or she can evaluate it. By using a computer, the information about the patient heart condition may be evaluated automatically.
1.2 General Overview
The traditional electrocardiogram machine has 5 or more wires terminating in electrodes connected to the patient. The machine operator might be a doctor, nurse, or medical technician who can judge the quality of signals and re-prepare and re-apply electrodes in the case of poor signal quality. We want to preserve rather than automate this "judgment" process. So the instrument must be able to present a waveform adequate to make this judgment and have rapid-enough response to easily allow the operator to associate a change in the waveform with an intervention. We propose to allow substitution of a test waveform to verify function of the instrument but will rely on operator judgment to record and select appropriate waveform
samples.
The Second Chapter presents a background on Electrocardiography and a summary of the National Standards for Electrocardiograph machines. The Third Chapter discusses some
Chapter I. Introduction
issues about introducing a Medical Device to the Market. The Fourth Chapter shows the description of the proposed Hardware implementation from the patient leads, to the lead selector, signal preparation, quantization, and signal communication devices. The Fifth Chapter explains the proposed software implementation that presents the actual data on the computer monitor.
Chapter II.
Electrocardiograph Machines
2.1 Background.
Basically, an electrocardiograph machine records a graphic tracing of the electric current generated by the heart muscle during a heartbeat. Electrograms are sets of recording made by applying electrodes to various parts of the body. Twelve records constitute a typical clinical electrocardiogram. About 3 seconds of data are present for each of the 12 leads. Often a longer "rhythm strip" is recorded.
On a 12 Leads electrocardiograph, there are 12 different voltages differences that can be printed, divided on 3 groups:
* Bipolar limb leads: The electrodes are connected on the left arm, on the right arm and on the left leg. The Leads derived of this connection are:
I = LA-RA (Voltage of Left arm minus Voltage of Right arm). II = LL-RA (Voltage of Left leg minus Voltage of Right arm). I1 = LL-LA (Voltage of Left leg minus Voltage of Left arm).
* Augmented Extremity Leads: In this mode the electrodes are also connected to the left arm, right arm and left leg. The voltage difference printed is the voltage of one electrode minus the voltage average of the other two:
aVR = RA - 0.5 (LA + LL)
aVL = LA - 0.5 (LL + RA)
aVF = LL - 0.5 (LA + RA)
Unipolar Precordial Leads: In this mode the electrodes are also connected to the left arm, right arm and left leg, and also there is a electrode on 6 different places of the chest. The voltage difference printed is the voltage on the chest electrode minus the average of the other three electrodes.
Chapter II. Electrocardiograph Machines V2 = V -1/3(LA + RA + LL) V3 = V - 1/3(LA + RA + LL) V4 = V -1/3(LA + RA + LL) V5 = V - 1/3(LA + RA + LL) V6 = V -1/3(LA + RA + LL)
RA
LA
+ +ILL
(a) (b)Figure 2.1 (a)Standard Bipolar Leads, and (b) Unipolar Precordial Leads'
On Figure 2.2 we can see a typical 12 lead electrogram. As we can see, it show information about the patient (Age, Height, Weight, Sex, Race), Hospital Information (Physician name, Location, room), title of test, information about the machine settings (Strip speed, gain, bandwidths of signal), and 12 three second signals -one for each lead -and one 12 second strip of a particular lead.
cd:' tlinnon ALe: Ht:
Sax: F Race: Couc Loc: Room; 3 . Vent. rate 53 PR interval 152 QRS duration E84 OT0c 428/405 P-A-T oaxes 12 45 BPri nt 62
NORMAL SLNUS RHYTICI
SEPtAL INPARCT. AGE UND6TERMINBD
ST & T NAVE APNORHALITY, CONSIDER ANTERIOR [CHEHIA
ABNORMAL BCG
Refcrred by: MIDA ancon N raed
1 oVA Y 1] aVL / S-aVP
n
C-~
~-~~-~-C-C~s-jr-~-l-25no/s LOan/my LO~Ha'm PgmO 004A vZOG206Chapter II. Electrocardiograph Machines
Any deviation from the norm in a particular electrocardiogram is indicative of a possible heart disorder [7] . Information that can be obtained from an electrocardiogram includes whether the heart is enlarged and where the enlargement occurs, whether the heart action is irregular and where the irregularity originates, and whether a slow rate is physiological or caused by heart block. The presence of high blood pressure, thyroid disease, and certain types of malnutrition may also be revealed by an electrocardiogram.
Generally the machine has a dial that the operator moves to select the type of lead used. Depending on the lead used, there will be a characteristic wave that a doctor can interpret, with the knowledge of the physical condition of the patient.
2.2 Normal adult 12-lead EKG
STsegment
II
I
S PR QT
Interval Interval
Chapter II. Electrocardiograph Machines
From [7] and [8] I found that the diagnosis of the normal electrocardiogram is made by excluding any recognized abnormality. It's description is therefore quite lengthy, and it is important to interpret each tracing in a standard fashion. A commonly followed sequence of analysis is as follows' :
normal sinus rhythm.
Each P wave is followed by a QRS; P waves normal for the subject (upright in leads I, II, and Im); P wave rate 60 - 100 bpm with <10% variation; rate <60 = sinus bradycardia; rate >100 = sinus tachycardia; variation >10% = sinus arrhythmia
* normal QRS axis * normal P waves
Height < 2.5 mm in lead II; width < 0.11 s in lead II; for abnormal P waves consider right atrial hypertrophy, left atrial hypertrophy, atrial premature beat, hyperkalaemia
* normal PR interval
0.12 to 0.20 s (3 - 5 small squares); for short PR segment consider Wolff-Parkinson-White syndrome or Lown-Ganong-Levine syndrome (other causes - Duchenne muscular dystrophy, type II glycogen storage disease (Pompe's), HOCM) for long PR interval see first degree heart block
* normal QRS complex
< 0.12 s duration (3 small squares); for abnormally wide QRS consider right or left bundle branch block, ventricular rhythm, hyperkalaemia, etc.; no pathological Q waves no evidence of left or right ventricular hypertrophy
* normal QT interval
Calculate the corrected QT interval (QTc) by dividing the QT interval by the square root
of the preceding R -R interval. Normal = 0.42 s.
Chanter II. Electrocardioaranh Machines
Causes of long QT interval: myocardial infarction, myocarditis, diffuse myocardial disease; hypocalcaemia, hypothyrodism; subarachnoid haemorrhage, intracerebral haemorrhage; drugs (e.g. sotalol, amiodarone); Hereditary: Romano Ward syndrome (autosomal dominant); Jervill + Lange Nielson syndrome (autosomal recessive) associated with sensorineural deafness
normal ST segment
No elevation or depression; causes of elevation include acute MI (e.g. anterior, inferior), left bundle branch block, normal variants (e.g. athletic heart, Edeiken pattern, high-take off), acute pericarditis causes of depression include myocardial ischaemia, digoxin effect, ventricular hypertrophy, acute posterior MI, pulmonary embolus, left bundle branch block * normal T wave
Causes of tall T waves include hyperkalaemia, hyperacute myocardial infarction and left bundle branch block. Causes of small, flattened or inverted T waves are numerous and include ischemia, age, race, hyperventilation, anxiety, drinking iced water, LVH, drugs (e.g. digoxin), pericarditis, PE, intraventricular conduction delay (e.g. RBBB) and electrolyte disturbance.
* normal U wave
This use requires that the wave is printed in a ruled paper with standardized scales, like the ones showed in figure 2.3.
2.3 National Standards for Electrocardiograph machines
There are standards developed by The Association for the Advancement of Medical Instrumentation (AAMI) and approved by the American National Standards Institute, Inc.(ANSI), that provides limits and measurement techniques for medical apparatus.
* ES1, is the "American National Standard, Safe Current Limits for Electromedical Apparatus. This standard provides limits and measuring techniques for risk currents of electromedical
Chapter II. Electrocardiograph Machines
apparatus as a function of frequency, the characteristics of the apparatus, and the nature of the intentional contact with the patient" [9].
EC11 is the "American National Standard for Diagnostic Electrocardiographic Devices. This
standard establishes minimum safety and performance requirements for electrocardiographic (EKG) systems, with direct writing devices, which are intended for use in EKG contour analysis for diagnostic purposes". This standard defines requirements for the electrocardiographic recording system, from the input electrodes to the output display [10].
2.3.1 EC11 Standard
The EKG system that we are proposing is included in this standard. Some of the requirements set by this standard are:
Labeling Requirements.
Diagnostic EKG devices shall be clearly and permanently marked with information like the manufacturer's name, trademark, trade name; The catalogue, style, model, or other type designation; serial number; The range of supply (mains) voltage and the maximum operating current or power; the nominal supply (mains) frequency; etc.
All controls, switches, and connectors shall be clearly and concisely labeled to identify
their function. Electrical safety labels, the location of fuse holders and the patient electrode connection nomenclature and colors shall be clearly marked.
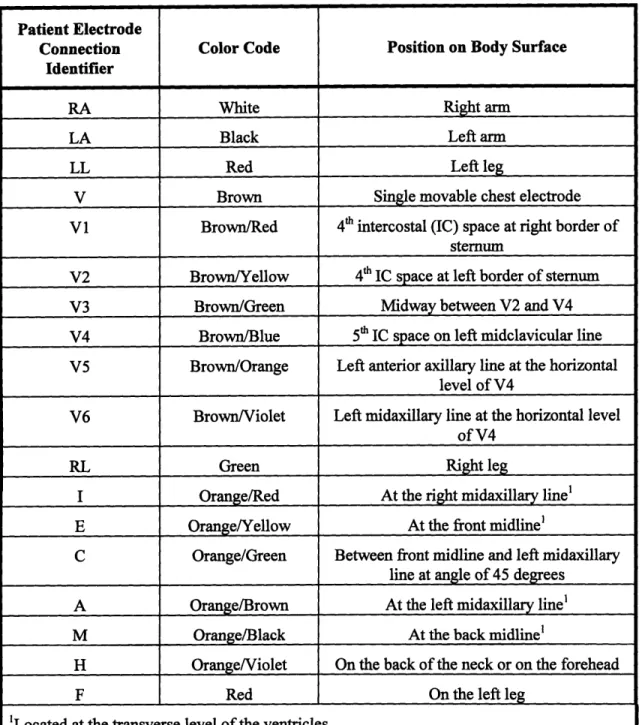
The patient Electrode Connection Definitions and Color Code for the conventional system is summarized on table 2.1.
Chapter II. Electrocardiograph Machines
Patient Electrode
Connection Color Code Position on Body Surface Identifier
RA White Right arm
LA Black Left arm
LL Red Left leg
V Brown Single movable chest electrode
V1 Brown/Red 4th intercostal (IC) space at right border of sternum
V2 Brown/Yellow 4th IC space at left border of sternum
V3 Brown/Green Midway between V2 and V4
V4 Brown/Blue 5t IC space on left midclavicular line V5 Brown/Orange Left anterior axillary line at the horizontal
level of V4
V6 BrownNiolet Left midaxillary line at the horizontal level
of V4
RL Green Right leg
I Orange/Red At the right midaxillary line'
E Orange/Yellow At the front midline'
C Orange/Green Between front midline and left midaxillary
line at angle of 45 degrees
A Orange/Brown At the left midaxillary line'
M Orange/Black At the back midline'
H Orange/Violet On the back of the neck or on the forehead
F Red On the left leg
'Located at the transverse level of the ventricles.
Chapter II. Electrocardiograph Machines
An operator's manual, containing adequate instructions for the proper installation and the safe and effective operation of the device and identifying acceptable repair facilities, shall be provided with each unit. At least the following information shall be supplied:
* Disclosure of Cautionary Information/Performance Characteristics: Cautionary
information regarding potential hazards/damage, including warnings on use of device in presence of electromagnetic interference or power overload caused by electrosurgical or diathermy instruments.
* Battery-Powered Devices: Minimum operating time; battery charge time; function of battery depletion indicator, if provided.
* Accuracy of Input signal Reproduction: description of methods used by manufacturer to
establish overall system error and frequency response; description of modulating effects in digital systems.
Application notes: Description of device's intended applications and available functions; procedures for checking controls and functions; manufacturer's recommendations concerning electrodes. A service Manual, containing adequate care, preventive maintenance, and repair instructions; electrical specifications complete enough to allow reasonable field repair; identification of acceptable repair facilities; recommended frequency of preventive maintenance.
Operating Requirements: Unless otherwise stated, the performance requirements of this
standard shall be met under the following ambient environmental conditions:
Table 2.2 Operating Conditions
Line Voltage: 104 to 127 Vrms
Line Frequency: 60 + 1 Hz
Temperature: 25 + 10 oC
Relative Humidity: 50 + 20 %, noncondensing
Chapter II. Electrocardiograph Machines
The definition of lead sets employing the twelve conventional or orthogonal leads shall comply to table 2.3.
The definition of the leads is given in terms of algebraic equation, assuming that the electrode identifier represents the voltage sensed by the electrode. For the unipolar chest leads, V represents the potential at each respective chest electrode location. By convention, X is oriented horizontally and towards the left arm of the patient, Y points towards the feet, and Z is horizontal and towards the back of the patient.
Lead Definition Name of Lead
Nomenclature
I I=LA-RA Bipolar
H II= LL - RA limb leads
IH III = LL - LA (Einthoven)
aVR aVR = RA - 0.5 (LA + LL) Augmented aVL aVL = LA -0.5 (LL + RA) leads
aVF aVF = LL - 0.5 (LA + RA) (Goldberger) V1 V1 = V - 0.333(LA + RA + LL)
V2 V2 = V -0.333(LA + RA + LL) Unipolar V3 V3 = V - 0.333(LA + RA + LL) Chest leads V4 V4 = V - 0.333(LA + RA + LL) (Wilson) V5 V5 = V - 0.333(LA + RA + LL) V6 V6 = V - 0.333(LA + RA + LL) X X = 0.610A + 0.171C - 0.7811 Orthogonal Y Y = 0.655F + 0.345M - 1.000 H Vector leads Z Z= 0.133A + 0.736M - 0.2641 (Frank) - 0.374E -0.231C
Table 2.3. Definition of leads (EC11).
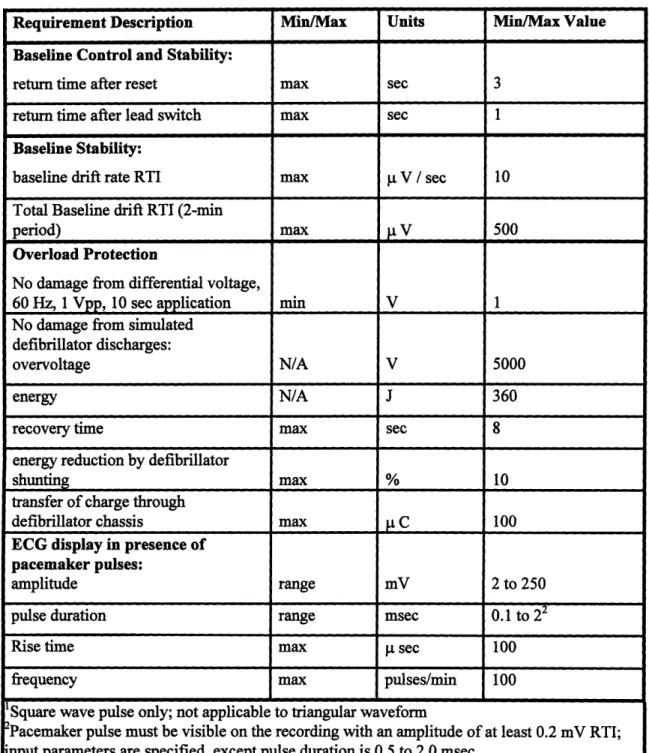
Table 2.4. Provides a summary of some other performance requirements of the EC 11
Chapter II. Electrocardiograph Machines
Requirement Description Min/Max Units Min/Max Value Input Dynamic Range:
Range of linear operations of input
signal min mV 5
Slew rate change max mV/sec 320
DC offset voltage range min mV ±300
Allowed variation of amplitude with
DC offset max %
±
5Gain Control, Accuracy, and Stability
gain selections min mm/mV 20, 10,5
gain error max % 5
manual override of automatic gain
control NA NA NA
gain change rate/min max %/min ±0.33
total gain change/hour max % 3
Time Base Selection and Accuracy:
Time base selections min mm/sec 25,50
Time base error max % 5
Output Display
Width of display min mm 40
trace visibility max mm/sec 1600
trace width max mm 1
departure from time axis alignment max mm 0.5
max msec 10
preruled paper division min div/cm 10
error of rulings max % 2
Chanter II. Electrocardiograph Machines
Requirement Description Min/Max Units Min/Max Value Accuracy of Input Signal
Reproduction
Overall error for signals max % + 5
up to +5 mV & 125 mV/sec max V ± 40
upper cut-off frequency (3 dB) min Hz 150 Response to 20 ms, 1.5 mV
triangular input min mm 13.5
Response to 0.3 mV.s impulse max mV 0.1
Displacement slope max mV/s 0.30
error in lead weighting factors max % 5
Deflection from baseline max mm 0.5
Standardizing Voltage'
Nominal Value NA mV 1.0
Rise Time max msec 1
Decay Time min sec 100
Amplitude error max % 5
Input Impedance at 10 HZ (Each
lead) min megohms 2.5
DC Current
(any input lead) max [A 0.1
(any other patient electrode) max p. A 1.0
Common Mode Rejection
allowable Noise with 20 V, 60 Hz &
± 300 mV dc. max mm 10
& 51 -kilohm imbalance max mV 1
System Noise
RTI, p-p max pV 30
Chapter II. Electrocardiograph Machines
Requirement Description Min/Max Units Min/Max Value
Baseline Control and Stability:
return time after reset max sec 3
return time after lead switch max sec 1
Baseline Stability:
baseline drift rate RTI max V / sec 10
Total Baseline drift RTI (2-min
period) max V 500
Overload Protection
No damage from differential voltage,
60 Hz, 1 Vpp, 10 sec application min V 1
No damage from simulated defibrillator discharges:
overvoltage N/A V 5000
energy N/A J 360
recovery time max sec 8
energy reduction by defibrillator
shunting max % 10
transfer of charge through
defibrillator chassis max C 100
ECG display in presence of
pacemaker pulses:
amplitude range mV 2 to 250
pulse duration range msec 0.1 to 22
Rise time max gt sec 100
frequency max pulses/min 100
'Square wave pulse only; not applicable to triangular waveform
Pacemaker pulse must be visible on the recording with an amplitude of at least 0.2 mV RTI; input parameters are specified, except pulse duration is 0.5 to 2.0 msec.
Table 2.4 Summary of Performance Requirements
Section 4 of the EC 11 standard provides referee test methods and procedures by which compliance of the device with the requirements of Section 3 can be verified.
Chapter III.
Entering an Emerging Medical Technology to the Market.
We have seen many examples of innovative companies and individuals that failed to capture significant returns from their creations. This is despite the fact that the innovations often became successful and generated substantial wealth for other parties [10]. This chapter examines an emerging medical technology and speculate on how we can avoid similar fate.
This technology can be applicable in a number of markets including hospital monitoring, ambulatory monitoring, and home care monitoring. Given the limited set of resources, the market decision is an important one.
3.1 Overview of the medical device industry
The medical device industry has been dominated by the United States for many decades. American medical devices are recognized world wide for quality and innovationl .
Rapid advances in information technology are transforming many industries, and that is evident in the medical device industry. The combination of computers, sensors, and imaging systems are replacing invasive procedures and "exploratory" surgery.
In sharp contrast with the pharmaceutical industry, the medical device industry is composed of a very large number of small companies. One reason device companies are small is that the market itself is fragmented. For example, the total US market for anesthesia machines of all types is only about 3,000 units a year with a total value of $150 million. In contrast, the US market for systemic antibiotics is $5 billion per year [11].
1 Moody, "Strategic Alternatives for Innovators of an Emerging Medical Technology". M. S. Thesis.
Chanter Ill. Entering an Emerging Medical Technology to the market
The medical device companies conduct substantial research and development. Because of the complexity and high risk of the innovation, a very large proportion of significant innovation comes from the smaller companies with the least sales. Venture capital is generally attracted to these companies in the expectation that the product or the company itself will be sold to a larger company in 5 to 7 years.
While radically new technologies attract public attention, much of the long term improvement in medical devices comes from many small incremental innovations which cumulatively, over time, have a great clinical relevance. Much of the impetus for such product improvements comes from physicians in the field. Unimpeded communication between physicians and manufacturers is a requirement for much of this activity.
It is also important to have available different sites for testing the devices in a clinical environment, generally in academic health centers. The small size of the market for any medical device and the need for specialized material for many of these devices results in device companies being dependent on suppliers outside the medical device industry. The medical industry is dependent on multiple factors beyond its direct control:
* Time. Small companies have little reserves and are dependent on fresh infusions of capital or on current sales to finance innovation. Delays, fear of delays, or even the unpredictability of delays can lead to financial disaster and frighten capital investors. Such delays can be due to FDA approval, difficulty or hazard's to test the device among other.
* Uncertainty. Research can't predict in advance what is going to work, how well and when. It's hard to know how the conditions in the market will be or how much competition will be when the product is brought to the market. Also there is uncertainty in knowing if the product will be obsolete when it gets to the market. The companies won't know if they will have the same talented people through all the research process.
* Liability costs. Liability costs are very high in these industries because their products are intrinsically involved in life and death situations.
* FDA approval. On top of these significant scientific and market risks, the FDA approval
Chapter 1I. Entering an Emerging Medical Technology to the market
time and expense required to get there. FDA negativity at any stage of the process can reduce the value of a firm and raise its effective cost of capital overnight, especially for small companies without diversified (or even marketed) product lines. These regulatory uncertainties reduce the returns from research and development in the pharmaceutical and medical device sectors and, therefore, the number of new therapeutic products that can be developed.
3.2 EKG Technology and Market Opportunities
Electrocardiography is one of the pioneers in the medical device industry. Frank B. Sanborn, a civil engineering professor at Tufts, was on the pioneering edge of medical technology in the 1920s when his company invented among other equipment the first Table Model Electrocardiograph.
In 1928, the table model was converted to a portable EKG. Powered by a 6-volt automobile battery, the portable EKG weighted 50 pounds. This era also marked the beginning of many working partnerships with members of the medical community.
In 1931, the first research model EKG was installed in Mass General Hospital and Sanborn's relationship with the hospital continued through the years. During the 1940s and 1950s Sanborn saw a five-fold increase in sales and productivity reached an all-time high.
By 1960, Sanborn was faced with excessively high inventory, some uncertainty in industrial sales, and an increase in product prices. In 1961 Sanborn Company was merged with Hewlett-Packard Company.
In the 1970s EKG companies started to explicitly consider issues of patient safety. By the 1980's EKG analysis was introduced; the EKG industry shifted from product development to process development. By this time there is a dominant design, and the competition shifted to price and away from design.
In the last decade we have seen the creation of the market for home health care devices with the introduction of personal blood pressure monitors and glucometers among others. These
Chapter III. Entering an Emerging Medical Technology to the market
are necessarily simple devices sold through retail channels such as pharmacies (i.e. CVS, Wallgreens) and mass merchandisers (i.e. Kmart and Target).
The channel used for this market is very different from normal medical device channels. Home health care devices is the only segment sold through retail stores. Therefore, the market more closely resembles that of a consumer good than a traditional device. The typical supply for Home health care devices is structured as shown in Figure 3.1:
Innovator -- Manufacturer Distributor Retailer ; Customer
Figure 3.1. Typical supply channel for Home Health Care devices
3.3 Introducing New Medical Technologies to Mexico
The market that we are trying to focus is clinical electrocardiography in health provider facilities, in particular poor clinics in the developing countries. Although this is a problematic market because of resource limitation, there is a big need for health care devices. In 1996, 436,321 were registered dead. From those, 65,603 (about 15%) died directly from heart related causes. If for every dead person, there are 10 sick people that need to take an electrogram weekly, about 100,000 daily electrograms are needed to be taken. 10 electrograms per day is the normal use of this machines, and for one active machine, there is another with practically no work load (it may be in a physician office). About 20,000 electrocardiograph machines are required, minus 3,086 estimated actual machines, about 17,000 machines are needed.
The EKG machine that we are developing is built within a computer, therefore will be much less expensive than a stand-alone machine. There are a limited number of clients in this market, but a client can be a government health care department that buy many equipment for government hospitals that are common in some developing countries like Mexico.
In general, the hospital disposition in Mexico is divided into Private Hospitals and Clinics, and Public Hospitals and clinics. In general, the private hospitals are independent to each other. The Public ones are divided into different groups:
Chapter 1. Entering an Emerging Medical Technology to the market * SSA. Directly dependent on the Ministry of Health.
* DDF. Directly dependent on the Government of Mexico City. * IMSS-SOL. Maintained by Social Security payments of the workers.
* STATE HOSPITALS. Directly dependent on the Government of each state of the
federation.
* ISSSTE. For the use of the State dependent workers.
* PEMEX. For the use of the PEMEX (Petroleos Mexicanos) workers.
* SDN. Military Hospitals. * SM. Marine Hospitals
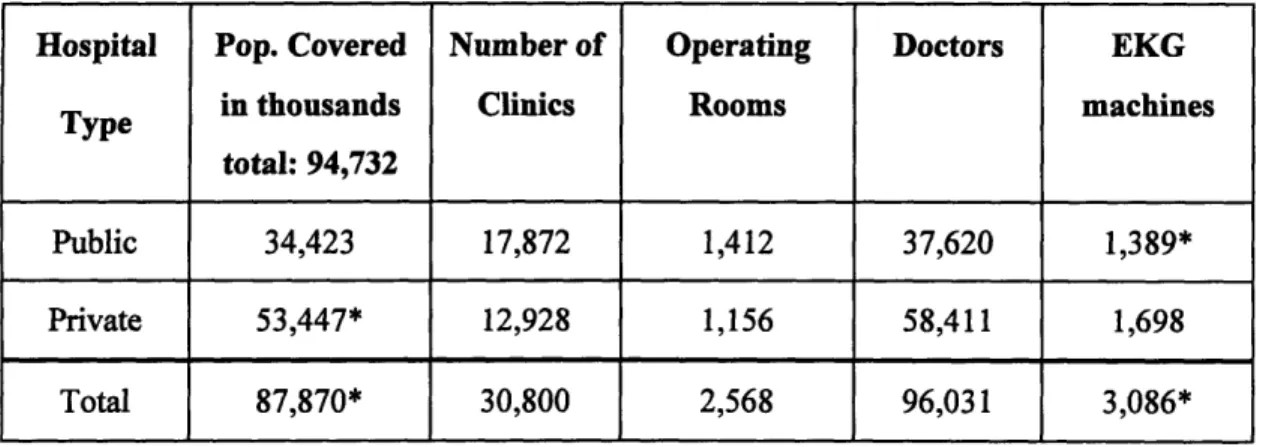
Accordingly to information from the government of Mexico [5], the number of operating rooms in Mexico is 2,568; from those 1,156 are in private hospitals and the rest is in a government hospitals. There are 133,711 hospital beds from which about 55% are in private hospitals. That same source states that there are 1,698 Electrocardiograph machines in private hospitals; from the information above we can estimate that there are about 1,389 EKG machines in public (government) hospitals and a total of 3,087 in the whole country. The total population in Mexico is about 95 Million. This information is shown in table 3.1:
Hospital Pop. Covered Number of Operating Doctors EKG
Type in thousands Clinics Rooms machines
total: 94,732
Public 34,423 17,872 1,412 37,620 1,389*
Private 53,447* 12,928 1,156 58,411 1,698
Total 87,870* 30,800 2,568 96,031 3,086*
Table 3.1. Medical infrastructure in Mexico by 1996. (* Estimated).
As people gets older the Health problems increases. In the next figure, I show the Age distribution of the population of Mexico.
Chapter III. Entering an Emerging Medical Technology to the market Number of People (Millions) 35 30 25-20 15-10 5 0 0 to 14 15 to 29 30 to 44 45 to 59 > 60 Age
Figure 3.2. Age distribution in Mexico by 1996.
The cost of an EKG machine in Mexico is about US$5,000.00 to $10,000.00. The estimated cost of the "Virtual EKG Machine" including a computer is estimated to be less than US$2,000.00. A computer can be repaired everywhere, reducing maintenance and supply costs considerably. For example, the EKG machines use a special paper that is quite expensive; by using a computer, we have the advantage of printing the electrograms as many times as we want, along with the patient name and some other information that can be useful on a common piece of bond paper that doesn't fade away.
One problem of the inexpensive EKG Machines now available is that they go out of calibration very often. By having fewer mechanical components, this will less likely in the Virtual Machine.
Being a market entrant has some advantages and disadvantages versus market incumbents in architectural innovation and in particular in the medical device industry. Some advantages are that entrants innovate at lower cost, entrants will chase small profit markets. A disadvantage of the entrants is that they have less Complementary assets than the incumbents. In the next paragraphs, I show the complementary Assets that a medical supply company should have.
Chapter m. Entering an Emerging Medical Technology to the market
* Appropriability of technology. The technology of developing an EKG machine is widely
used and hard to patent.
* Switching costs. There are some switching cost related to changing from stand alone machines to computer based systems. This costs are of two types; first is the obvious, the cost of buying the new machine. The second cost is the technology learning cost; the cost related on instructing the physicians or users how to use the product. These costs can be justified by the lower cost of the machines and most important of the supplies (while a HP EKG paper costs $20 per roll, the regular printer paper costs less than $5 per 100 pages). The computer software can have "virtual" control switches, so the physicians can use it the same way they use a stand alone machine (the less disruptive possible to the user).
* Access to retail distribution. For the Home Health Care Market, the product is intended
to be sold directly to the customer. Therefore, customers channels like drug stores (i.e.
CVS, Wallgreens) and general mass merchandisers (i.e. K-mart, Target) are very
important. For the Electrogram market, access to regional distributors is important.
* Brand name recognition / Reputation in the market. For the Home Health Care, brand
name recognition is important. For the Electrogram market, good service and quality provides good reputation which encourages more Hospitals to buy the product.
* Manufacturing capabilities. Price is very important for this product, since we claim that
the price of this machine is going to be a lot less expensive than the stand-alone Machines. Most of the machine is the personal computer, which is available everywhere. Access to low cost manufacturing is available through contract manufacturers.
When developing or sourcing EKG devices, the manufacturers or distributors need to be aware of regulatory issues. In the United States, all medical devices must pass through an FDA approval process known as 510(k). For EKG systems the key standard is one developed by the Association for the Advancement of Medical Instrumentation (AAMI) and approved by the American National Standard Institute (ANSI). This standard establishes minimum safety and performance requirements for electrocardiographic (EKG) systems, which are intended for use in EKG contour analysis for diagnostic purposes. This standard defines requirements for the electrocardiographic recording system, from the input electrodes to the output display.
Chapter m. Entering an Emerging Medical Technology to the market
Approval times for these devices have to be taken into account in the developing/marketing plan. Beyond the FDA, there are no further regulatory issues in the US. The strategy is to develop an instrument which meets US standards and could be marketed in the U.S. but to focus the market in Mexico. If we plan to commercialize the product in some other countries we have to study their safety standard for this type of devices, and plan ahead to get the regulatory permissions on those countries; there is not an specific standard for EKG machines in Mexico.
Chapter IV
Hardware Description.
4.1 Background
Telecommunication and Printer Electrically Isolated Capabilities serial communication
Interface
/"
Figure 4.1. EKG Monitor system block diagram
The traditional electrocardiogram machine has 5 or more wires terminating in electrodes connected to the patient. The machine operator might be a doctor, nurse, or medical technician
who can judge the quality of signals and re-prepare and re-apply electrodes in the case of poor signal quality. We want to preserve rather than automate this "judgment" process. So the
instrument must be able to present a waveform adequate to make this judgment and have
rapid-enough response to easily allow the operator to associate a change in the waveform with an intervention. We propose to allow substitution of a test waveform to verify function of the
instrument but will rely on operator judgment to record and select appropriate waveform
samples.
The proposed EKG Machine can be described as a collection of several subsystems from the Lead Selector to the Optical Isolated Serial Communication to the Personal Computer,
Chapter IV. Hardware Description
including a test signal generator, Amplifier Circuit, Noise and Quantization Filters, and data capturing Microprocessor. Figure 4.2 shows a block-diagram of this circuit.
Leads from patient
Serial Comm.
To PC
Figure 4.2 Interface circuit.
4.2 Electrodes and Lead Selector.
For economic reasons we are just amplifying one lead at a time instead of the twelve
leads discussed above. We can generate the twelve leads from the Right Arm, Left Arm, Left Leg and Chest Electrodes, plus the right leg electrode used as voltage reference. In the next figure I
Chapter IV. Hardware Description 4.2.1 Lead Selector
R1
RA *-dR2
LA o-.R3
LL
&,
R4
Vn o.A-RL R6 R19 R17 R13Figure 4.3 Lead Selector Buffer
0.5(RA+LA) 0.5(RA+LL)
0.5(LA+LL)
Chapter IV. Hardware Description
The resistors R1- R5 in combination with the diodes D1-D8 are to protect the patient from currents above the specified by EC11 while connected to the machine. The maximum forward voltage of the diodes is 0.6 Volts divided over 50 pA, we get that the resistors should be approximately 12 K92 or larger.
Amplifier U5 implements an active ground that should be connected to a reference point in the patient body. The active ground will help lower the common-mode; R23, R24 and C1 provides compensation to minimize oscillation.
The resistors R14-R26 are used to generate the different lead combinations, keeping the same output resistance. The different leads combinations are:
I = LA-RA II = LL-RA 11 = LL-LA
aVR = RA - 0.5 (LA + LL) aVL = LA -0.5 (LL + RA) aVF = LL -0.5 (LA + RA) V = V - 1/3 (LA + RA + LL)
Where LA is the Voltage of the left arm electrode, RA is the Voltage of the right arm electrode, LL is the Voltage of the left leg electrode, V is the Voltage of the chest electrode,
Thus, the extra combinations needed are RA+ LL, RA+LA, LA+LL and RA+LA+LL. Since precision resistors are expensive, we use matched resistors. A matched resistor provides the correct combination even though the values are not precisely determined.
A test signal is introduced in order to verify the performance and response of the EKG machine. The description of the function generation system is explained in the next section.
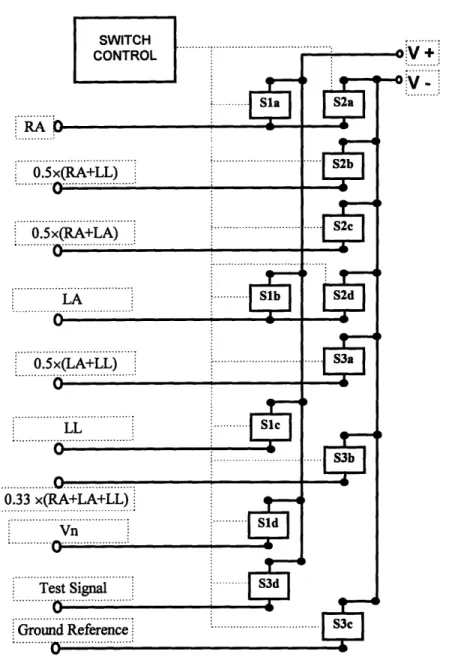
The combined signals are connected to controlled analog switches which select the desired signals to be amplified. For example, for lead I we need to subtract the voltage value of
Chanter IV. Hardware Descrintion
the right arm from the left arm. We need to send the RA signal to the positive terminal of the differential amplifier and the LA to the negative terminal, and so on as shown in figure 4.4.
The circuit draws only the amplifier input current through the switches minimizing the of effort of shunted resistors. There are two Analog Switches that are good for this purpose, the LF1331 (Normally Open) and LF13332 (Normally closed). The main features of these switches are constant "ON" resistance for signals up to ± 10V and 100 kHz (EKG signal is±l mV and less than 100Hz); It can manage small signals, break before make action taf<ton; It has a high open switch isolation (about -50dB at 1.0 MHz) and it is compatible with TTL levels which are going to be used for controlling them.
Since the logic of the Multiplexer that is going to be used to select the switches is inverted (i.e. An output of the Multiplexer is Low when selected and High when not selected), I decided that the use of the LF13332 Analog switches is a better choice, since they close with a low level signal and open with a high level signal.
Chapter IV. Hardware Description .RA 0 0.5x(RA+LL) 0-0.5 x(RA+LA) ... LA 0 0.5x(LA+LL) 0 LL 0 0... . . ... 0.33 x(RA+LA+LL) Vn ... 0 ... .. ... Test Signal Ground Reference ... . ... :
Figure 4.4 Lead selector circuit
Since there are twelve switches, twelve lines are needed to control the switches. I use some logic in order to reduce the number of control ports used. Since there are 9 different states, a 3 to 8 multiplexer can be used plus an extra port.
Since the output of the multiplexer is low for the selected output and high for the non-selected we are going to use and gates and the LF13332N that are open with a high and closed with a low. In the next table, I show the value needed for each switch for every state.
: ...' '
iV +
V -...
V
Chapter IV. Hardware Description Lead Port 2 DCBA Mux output Sla Slb Slc I 1000 YO 1 II 1001 Y1 1 III 1010 Y2 1 1 aVR 1011 Y3 1 aVL 1100 Y4 1 aVF 1101 Y5 1 1 VN 1110 Short 1111 Test 0000 Y6 1 1 Y7 17 P2.3 1 1 Sid S2a S2b 1 1 0 1 1 1 1 1 1 1 1 1 1 0 1 1 1 1 1 1 1 1 1 1 1 1 1 S2c S2d S3a I S3b 1 1 1 1 1 1 1 1 1 1 1 1 1 1 1 1 1 1 1 1 1 1 1 1 1 1 1
Table 4.1 Switch Selector Values
From this table we can see that:
SIB
= r , Y,SB
=
Y Y4 S1D = YID=1
S2A=YY
17S
3AE
=Y
S2B - Y4 S3B Y6S
2C
=
Y
S3C
=
P2.3
S2D =
2D 6Y
S3D
3D=
P2.3
S3c I S3d 1 1 1 1 1 1 1 1 1 1 1 1 1 1 1 1 1 1 1 I 1Chapter IV. Hardware Description
Microprocessor (DS5000)
Sla Slb Sic Sld S2a S2b S2c S2d S3a S3b S3cS3d
Figure 4.5 Switch Control Diagram
4.2.2 TEST SIGNAL
The EC 11 Standard states that the device shall exhibit a frequency to the specifications of Table 4.2, at a gain setting of 10 mm/mV.
response conforming
Method Nominal Input Input Frequency Relative Output Amplitude (mVpp) and Waveform Response (mm)
A 1.0 0.67 to 40 Hz, sinusoidal + 10%' B 0.5 40 to 100 Hz, sinusoidal + 10%, -30%' 0.25 100 to 150 Hz, sinusoidal + 10%, -30%' C 0.5 100 to 500 Hz, sinusoidal + 10%, -100%' D 1.5 0.5 to 40 Hz, sinusoidal +0%, -20%2 'Relative to 10-Hz output 2 Relative to 200-ms output
Table 4.2 Frequency Response 3X 8 MUX
Chanter IV. Hardware Description
The instrument must meet the requirements of Methods A and D, or alternately, the requirements of all of Methods A, B, and C of Table 4.2. The manufacturer must disclose which of the two sets of requirements (or both) are met by the instrument. For method D, I designed a triangular function generator as shown in the next figure:
1.5 mV
S20 ms
-Figure 4.6 Triangular wave signal for Method D.
I decided to use a DS5000 microprocessor to generate the signal to ensure that the specifications of EC- 11 are followed when testing the performance of the equipment. I generate a step signal with the width of 20 ms, and then I integrate it to get the triangular wave. The circuit used to generate the triangular wave is shown in figure 4.7:
Chapter IV. Hardware Description
The advantage of this circuit is that several test signals can be programmed to be used to test the equipment. As shown, the signal has to be attenuated to obtain a 1.5 mV level required
by EC-11. The program that I developed in Basic to generate the triangular wave is shown below:
1 2 3 10 20 30 40 50 60 70 80 90 100 110 120 130 140 150 160 170 180 190 200 210 220 230 240 REM *************************************************
REM * TRIANGULAR WAVE GENERATOR *
REM ****************************************************
CLOCK 1 :REM Initialize clock
ZERO=128 :REM Value for zero output
HIGH=ZERO+100 :REM Value for high output
LOW=ZERO-100 :REM Value for low input
PORT2=ZERO :REM Zero for 1 second
A=TIME DO B=TIME WHILE B<A+1
PORTO=1 :REM Initiate integration for 0.01 secondr
A=TIME PORT2=ZERO DO PORT2=HIGH B=TIME WHILE B<A+0.01
A=TIME :REM Integrate to zero for 0.01 seconds
DO PORT2=LOW B=TIME WHILE B<A+0.01 PORT2=ZERO PORTO=0
GOTO 20 :REM start again
Chapter IV. Hardware Description
4.3 Amplification of the EKG signal.
As noted on the EC-11, the dynamic range of the apparatus shall be ± 5 mV. The signal level that we want is ± 5V, so it can be processed using a ± 5 V power supply. From the previous line we can see that the signal shall be amplified 1000 times. Because of electrode offset (300mV), it is necessary to amplify with two or more steps, first an instrumentation amplifier with fixed gain, and then a fixed single-ended gain amplifier. The Instrumentation Amplifier has a low drift and offset, but the electrode offset requirement (300 mV) makes it necessary to use a high pass filter to get rid of the DC offset. EC-11 sets the minimum frequency to be 0.5 Hz; a filter with a cutoff at 0.2 Hz eliminate DC offset without disturbing the signal.
The amplifying circuit is shown on figure 4. 8
R35 1 MO C2 10 jiF R34 10 K9
Vamp
R33 o 100 K92Figure 4.8 Amplifier Circuit
Where,
U9 is an Instrumentation operational Amplifier like the AD621 with a gain of 10. U10 is a rail-to-rail operational amplifier like the LMC6484 with a gain of 100.
C2 and R33 are the capacitor and resistor used as a High-pass filter respectively (To eliminate the DC offset).
Chanter IV. Hardware Descriotion
4.4 Noise and Anti-aliasing Filters
Once the signal is amplified, unwanted components of the signal shall be filtered, in particular the 60 Hz noise from the power lines. EC-11 specifies that the device shall exhibit a frequency response conforming to the specifications of Table 4.2, at a gain setting of 10 mm/mV.
From table 4.2 of section 4.2.3 we can see that the relative output response is limited to +10% for method A, +10%, -30% for method B, +10%, -100% for method C, and +0%, -20% for method D.
A filter at 60 Hz may be required to remove the power line noise. We don't want the signal to be attenuated more than 10 percent at 40Hz, and around 40 dB at 60 Hz. A high order low pass filter is required like the MAX29X. I recommend to use the Bessel filter, since it has a better performance in the time domain [16].
The amplitude response (asymptotic behavior) of the low pass filter is given by:
Gain[dB] = -20n x log10(-0 )
o)P
where,
n is the filter order,
co is the desired frequency, and cop is the cutoff frequency.
In order to comply with EC 11 specifications, we set cop to be 40 Hz. In the MAX29X, the internal clock determine the cutoff frequency; the value of the capacitor can be calculated by the equation:
Chapter IV. Hardware Description
105 f (KHz) =,
3 x Cosc(pF)
where,
fosc is the frequency of oscillation in Khz, and it is 100 times op, and Cosc is the capacitor value in PicoFaradays.
O -10 -20 -30 -40 -50 -60 -70 -80 100 150 200 250 Frequency [Hz]
Figure 4.9 Frequency response of the low-pass filter
Method B of table 4.2 specifies that for a sinusoidal input signal of frequency 40 to 100 Hz, the relative output signal doesn't vary more than +10% and -30%. Although, this method is not necessary to comply with EC-11 if Methods A, C and D are met, some of the signal in this range may be relevant for a physician. I recommend the use of a high pass filter with -40 dB at 60 Hz of Bessel type since it has better response in the time domain than Butterworth or Chebyshev filters. Figure 4.10 presents us the circuit diagram, while Figure 4.11 shows the frequency response of a high-pass filter adequate for this task.
Chapter IV. Hardware Description R36 180 KO a C5 R40 180 KX2 C7 R44 ni,,i 180 KQ
Figure 4.10 Circuit diagram of an 8th order High-pass filter.
10 -E-15
-' -20 -CD 150 200 250 300-25
i
30 --35 Frequency [Hz]Figure 4.11 Frequency response of an 8th order High-pass filter.
These two filters effectively realize a notch filter at 60 Hz. The disadvantage of using a notch filter is that the components have to be very precise and stable. For this reason, I recommend the use of the two filters discussed above. A block diagram of the filters is shown on figure 4.12.
C3 0.01u
Chapter IV. Hardware Description
Figure 4.12 Noise Filters Block diagram
The signals coming out of the low pass filter and high pass filter are added together to get the original signal without the 60 Hz noise. The next figure shows us two EKG signals before and after being filtered.
-4-Lead aVR Filtered
S
+ Lead aVR UnfilteredLead I Filtered
Time Lead I Unfiltered
Chapter IV. Hardware Description
The next step is to sample the data using an analog to digital converter. Since we are going to sample at a rate of 200 samples per second, an antialiasing filter with a cutoff at 100 Hz is needed to avoid signal-aliasing. We can use the uncommitted operational amplifier of the MAX29X, to make a second order low-pass filter with a cutoff at 100Hz. The next figure show us the diagram of the antialiasing filter.
R38 100 kW
Input
Output
Figure 4.14 Antialiasing filter
4.5 Data Acquisition
After the signal is filtered it gets sampled using an Analog-to-Digital (AD) converter. In general the quantization error produced at the AD conversion is equivalent to the value of /2
Least-Significant-Bit (LSB). For an 8 bit converter is 1/256 of the operating range. The EC 1l sets an operating range of ±5 mV; that gives us 10/(2^8) mV = 39 LV. From table 2.4 we can see that the maximum error shall be ± 50 jtV. In order to be able to see the P-wave, the resolution has to be increased. A 12 bit AD converter + sign give us a quantization error of 10/(2A^13) = 1.22
V. This quantization noise is considerably smaller than the specified in the EC 11 standards. The ADC1251 is a CMOS 12-bit plus sign successive approximation analog-to-digital converter. On request, the ADC1251 goes through a self-calibration cycle that adjusts for any
Chapter IV. Hardware Description
zero, full scale, or linearity errors. The ADC1251 also has the ability to go through an Auto-Zero cycle that corrects the zero error during every conversion.
The analog input to the ADC1251 is tracked and held by the internal circuitry, so an external sample-and-hold is not required. The ADC1251 has an S/H control input which directly controls the track-and-hold state of the A/D. A unipolar analog input voltage range (0 to +5V) or a bipolar range (-5V to +5V) can be accommodated with ±5V supplies.
The 13-bit data result is available on the eight outputs of the ADC1251 in two bytes, high-byte first and sign extended. The digital inputs and outputs are compatible with TTL or CMOS logic levels.
In order to generate a simple program in the DS5000 to sample data, I decided to add and modify some functions to the DS5000 basic interpreter instruction set. The first function calibrates the ADC1251 for any zero, full scale or linearity errors. The timing diagram for the Calibration cycle is shown on figure 4.15.
u [W Clock - tw (cal) - Cal CS t CAL EOC (APROX 1399 Cycles) INT Li
Figure 4.15 Timing Diagram for the Calibration Cycle
Where,
Chapter IV. Hardware Description
* CAL. Auto-Calibration control input. When CAL is low the ADC1251 is reset and a
calibration cycle is initiated.
* CS. The Chip Select control input. This input is active low and enables the WR, RD and S/H
functions. Since the AD1251 is the only device connected to Port 0 of the DS5000 we can leave CS selected.
* EOC. Output signal from the ADC1251 indicating the termination of the calibration cycle.
* tw (cal). Calibration Pulse Width. * t CAL. Calibration time.
The duration of the auto-calibration cycle is about 1400 cycles; if we use a clock of 1 MHz, the time required for a cycle is about 14 ms. Although, it is not possible to do a calibration cycle every time a conversion is made, it is recommended to calibrate the ADC1251 before the first conversion. The flow diagram of the AUTOCAL function is shown in figure 4.16
BEGIN Start Calibration Cycle Wait until Calibration is over END
Figure 4.16 Auto-calibration cycle Flow diagram
AD1251
I decided to develop a function that captures a single value from the ADC1251 storing the 13 bit result on the argument stack. The figure 4.17 shows us the timing diagram for a conversion cycle using S/H to start.
Chapter IV. Hardware Description 1J1i Jjljln[[lJl j-l Clock CS i- tAq S/H WR " ,/ /RR LI -,'/ tRR M 4. - RD x tl H+t0H t0L S tpd EOC S-... . t conv ... -. ,i INT tAcc ... .- :4 - ... H DB8-DB712 - - - - - Tri-State outputs . .e DB8DB2
Figure 4.17 Timing diagram using S/H to start a conversion without Auto-zero
Where,
CLOCK. The typical clock frequency range is 500 kHz to 6.0 MHz. I decided to use the timer LMC555, with the frequency set to 500 kHz. The diagram of the clock circuit is shown on figure 4.18 .
Rc 1KQ
Clock
Cc 33 I FE
74HCT14
Figure 4.18 Clock circuit.
Chapter IV. Hardware Description
1
Where fcock
2
x r x Rcx Cc
* CS. The Chip Select control input. This input is active low and enables the WR, RD and S/H
functions. Since the AD1251 is the only device connected to Port 0 of the DS5000 we can leave CS selected.
* S/H. The Sample and Hold control input. This control input is used to start a conversion. * WR. The write control input. This control input may be used to start a conversion without
sample and hold. Not used for this application.
* RD. The Read control input. With both CS and RD low, the tri-state output buffers are enabled and the INT output is reset high.
* AZ. The Auto-Zero control input. With the AZ pin held low during a conversion, the
ADC1251 goes into an auto-zero cycle before the actual A/D conversion is started. This Auto-Zero cycle corrects for the comparator offset voltage. The total conversion time (tc) is increased by 26 clock periods when Auto-Zero is used.
* EOC. The End-of-Conversion control output. This output is low during a conversion.
* INT. The Interrupt control output.. This output goes low when a conversion has been completed and indicates that the conversion result is available in the output latches. Reading the result or starting a conversion or calibration cycle will reset this output high.
* DBO-DB7/DB8-DB12. The TRI-STATE output pins. Twelve bit plus sign output data access
is accomplished using two successive RDs of one byte each, high byte first (DB8-DB12). The data format used is two's complement sign bit extended with DB12 the sign bit, DB11 the MSB and DBO the LSB.
* tAQ Acquisition time.