HAL Id: hal-01543604
https://hal.archives-ouvertes.fr/hal-01543604
Preprint submitted on 21 Jun 2017
HAL is a multi-disciplinary open access
archive for the deposit and dissemination of sci-entific research documents, whether they are pub-lished or not. The documents may come from teaching and research institutions in France or abroad, or from public or private research centers.
L’archive ouverte pluridisciplinaire HAL, est destinée au dépôt et à la diffusion de documents scientifiques de niveau recherche, publiés ou non, émanant des établissements d’enseignement et de recherche français ou étrangers, des laboratoires publics ou privés.
Plotting the global temperature data
Gilbert Zalczer
To cite this version:
Plotting the global temperature data
Gilbert Zalczer SPEC, CEA, CNRS, Université Paris Saclay, CEA Saclay, 91191 Gif sur Yvette, France
Abstract : The global temperature data are plotted trying to avoid any bias. It appears that the data contemporary to World War II are discordant with the other ones. These data should be considered with caution when comparing to models.
The elevation of the world global temperature in the next decades is a great subject of concern. Indeed a strong raise could generate important climatic disorders. The COP21 conference in Paris set the goal of remaining less than 2°C higher than a reference value choosen in the sixties. The past evolution of this parameter is the key tool to validate the models used to predict the future. Unfortunately it is usually plotted with the purpose of highlighting some point, which makes some other features less visible. A simple plot of the NOAA data [1] however reveals some features.
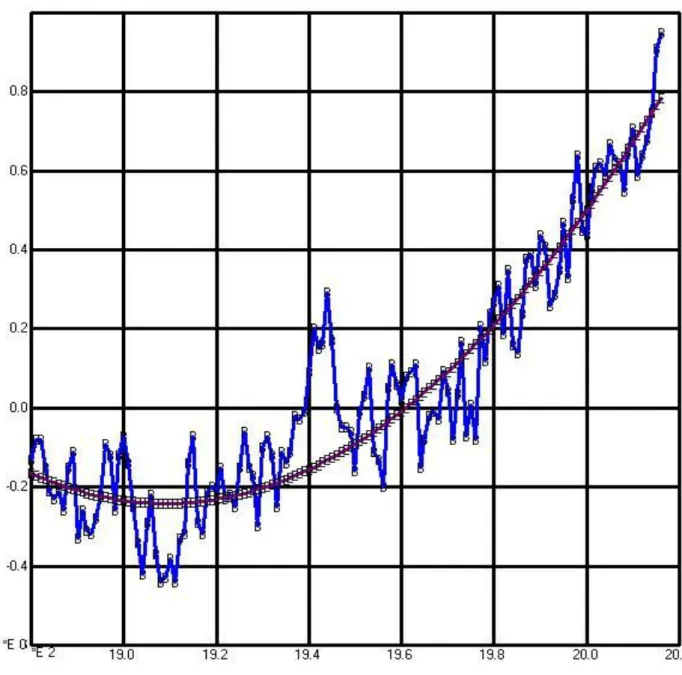
Figure 1 : Plot of the annual global temperature data fron NOAA. The data for years 1941 - 1946 are clearly discordant. As a guide for the eye is also plotted the parabola that fits the whole data set with those six points excluded.
Most of the data point lie in a narrow band, about 0.3° wide centered on a smooth slowly evolving parabolic shaped curve. Only a small subset is strongly offset by about 0.4°. It spans the years 1940 to 1945 and is thus strongly correlated to World War II. A mere coincidence seems unlikely. Either the unusual human activity induced this temperature increase, or the data were collected with less care. In any case these data points should be considered with caution and should not be included in analyses by “peaceful” models. The remaining data points follow a very smooth and slow variation. This absence of dramatic features will make much easier the fits with dynamical models but also will make more difficult to discriminate between concurrent models. The equation of the plotted parabola is (in degrees) : dT = -0.24 + 9.10-5 x (year – 1910). It extrapolates in year 2100 to an increase of about 3° above the current reference, but such an extrapolation has a very low predictive value. The coefficient of the quadratic term which dominates the extrapolation is strongly dependant on minute details of the fitting procedure.
NOAA has recently revised some of the oldest values for methodological reasons[2]. It would be interesting to conduct a critical examination of those in the 1940 – 1945 period.
References
1 . https://www.ncdc.noaa.gov/cag/time-series/global/globe/land_ocean/ytd/5/1880-2017