HAL Id: hal-02884612
https://hal.univ-lorraine.fr/hal-02884612
Submitted on 3 Dec 2020HAL is a multi-disciplinary open access archive for the deposit and dissemination of sci-entific research documents, whether they are pub-lished or not. The documents may come from teaching and research institutions in France or abroad, or from public or private research centers.
L’archive ouverte pluridisciplinaire HAL, est destinée au dépôt et à la diffusion de documents scientifiques de niveau recherche, publiés ou non, émanant des établissements d’enseignement et de recherche français ou étrangers, des laboratoires publics ou privés.
Heterostructured thin LaFeO3/g-C3N4 films for efficient
photoelectrochemical hydrogen evolution
Vincent Guigoz, Lavinia Balan, Abdelhay Aboulaich, Raphaël Schneider,
Thomas Gries
To cite this version:
Vincent Guigoz, Lavinia Balan, Abdelhay Aboulaich, Raphaël Schneider, Thomas Gries. Het-erostructured thin LaFeO3/g-C3N4 films for efficient photoelectrochemical hydrogen evolu-tion. International Journal of Hydrogen Energy, Elsevier, 2020, 45 (35), pp.17468-17479. �10.1016/j.ijhydene.2020.04.267�. �hal-02884612�
1
Heterostructured thin LaFeO3/g-C3N4 films for efficient
photoelectrochemical hydrogen evolution
Vincent Guigoz
a,b, Lavinia Balan
c, Abdelhay Aboulaich
d, Raphaël Schneider
a,*,
Thomas Gries
b,*a Université de Lorraine, CNRS, LRGP, F-54000 Nancy, France
b Université de Lorraine, CNRS, IJL, F-54000 Nancy, France
c CEMHTI-UPR 3079 CNRS, Site Haute Température, 1D avenue de la Recherche Scientifique,
45071 Orléans, France
d Université Clermont Auvergne, Institut de Chimie de Clermont Ferrand UMR 6296
CNRS/UBP/Sigma Clermont, Campus des Cézeaux, TSA 60026-CS 60026, 63178, AUBIERE Cedex, France
* Corresponding authors.
E-mail addresses: raphael.schneider@univ-lorraine.fr; thomas.gries@univ-lorraine.fr
Abstract
The deposition of LaFeO3 at the surface of a graphitic carbon nitride (g-C3N4) film via
magnetron sputtering followed by oxidation for photoelectrochemical (PEC) water splitting is reported. The LaFeO3/g-C3N4 film was investigated by various characterization techniques
including SEM, XRD, Raman spectroscopy, XPS and photo-electrochemical measurements. Our results show that the hydrogen production rate of a g-C3N4 film covered by a LaFeO3
film, exhibiting both a thickness of ca. 50 nm, is of 10.8 μmol.h-1.cm-2 under visible light irradiation. This value is ca. 70% higher than that measured for pure LaFeO3 and g-C3N4 films
2 and confirms the effective separation of electron-hole pairs at the interface of LaFeO3
/g-C3N4 films. Moreover, the LaFeO3/g-C3N4 films were demonstrated to be stable and retained
a high activity (ca. 70%) after the third reuse.
Keywords
Lanthanum ferrite; graphitic carbon nitride; photoelectrochemical water splitting; hydrogen evolution
Introduction
Hydrogen (H2) is a clean and carbon-free burning molecule and has become a promising
candidate fuel as future energy carrier due to high energy density [1,2]. However, 96% of H2
worldwide production originates from fossil fuels [3], which poses several environmental concerns such as the emission of a large amount of greenhouse gases such as CO2, SOx, NOx
and CO as by-products, which are mainly responsible of global warming issue. In addition to its environmental issues, most of H2 production methods are highly energy consuming,
which limits their application at very large scale. A big achievement would be to produce H2
via an environmental-friendly and cost-effective method. In this regard, solar energy can be converted into H2 by splitting water into oxygen (O2) and H2, storing the solar energy in the
H-H chemical bond (artificial photosynthesis). Hydrogen photoproduction can be achieved by two means, photocatalytically via the irradiation of a catalyst in water or photoelectrochemically at the surface of a semiconductor electrode in three-electrodes cells in which the illuminated semiconductor electrode either oxidizes water into O2
(photoanode) or reduces it into H2 (photocathode) [4,5]. This photoelectrode is connected to
a counter electrode that electrocatalyzes the respective half redox reaction.
Fujishima and Honda first demonstrated photoelectrochemical (PEC) water splitting for hydrogen production with a biased photoanode (titanium oxide, TiO2) in 1972 [6]. To
produce H2 using PEC, the semiconductor material (photoelectrode) should have a suitable
bandgap for water splitting half reactions to occur, absorb in the visible region of the solar spectrum, a high quantum efficiency (i.e. produce reactive charge carriers per absorbed photon) and a good photochemical stability (i.e. withstand photocorrosion) [7-10]. To reduce
3 costs and environmental impact, the chosen material should also be abundant and non-toxic.
Most water splitting studies were conducted using wide bandgap semiconductors like TiO2
or ZnO that can only be activated by UV light [11,12]. In recent years, intensive efforts were devoted to the extension of TiO2 or ZnO visible light absorption and to the improvement of
their photocatalytic properties via doping or building heterostructured catalysts in which the separation of charge carriers is improved [13–15]
Recently, lanthanum ferrite perovskite (LaFeO3) has attracted a great attention [16-21], with
applications in sensors [22], catalysts [23] and monitoring [24] due to its good chemical and thermal stability and its low toxicity. Moreover, LaFeO3 has an advantageous optical
bandgap, up to 2.1 eV, allowing the absorption of visible light until 590 nm. However, the photocatalytic activity of pure LaFeO3 and its PEC performances are modest due to the fast
recombination of photogenerated electron/hole pairs, to its weak charge collection, and to its low specific surface area [16,25–30]. Noteworthy is also that LaFeO3 exhibits poor or no
activity for H2 photoproduction because its conduction band (CB) edge is close and too
positive compared to that of the H+/H2 couple (0 V), which does not allow photogenerated
electrons to reduce H+ into H2.
Heterostructured catalysts associating LaFeO3 to reduced graphene oxide [31], TiO2 [32,33]
or graphitic carbon nitride (g-C3N4) [34-41] have received a much higher interest due to the
improved separation of charge carriers. The organic g-C3N4 semiconductor is a highly
promising material for photocatalytic applications like H2 production, environmental
remediation or CO2 reduction into fuel molecules due to its low cost, its high thermal and
chemical stability and its relatively low bandgap of ca. 2.7 eV allowing the absorption of visible light up to 460 nm [42-46]. Moreover, the energy positions of g-C3N4 valence band
(VB) and of its CB are located at ca. 1.4 and -1.3 eV vs normal hydrogen electrode (NHE), making this semiconductor suitable for water splitting [42–45]. As LaFeO3, g-C3N4 suffers
from various drawbacks like a high recombination rate of charge carriers and a low charge mobility. Due to the adequate band edge positions of g-C3N4 and LaFeO3, the coupling of
these materials affords a Z-scheme charge transfer system which allows to promote the separation of electron/hole pairs and to extend the visible light absorption [30,34–41]. Xu et
4 calcination process [34]. After association to 2% NiS used as co-catalyst and using triethanolamine as sacrificial substrate, a H2 evolution rate (HER) of 121 µmol.g-1.h-1 was
obtained. Acharya et al. also described the mechanical synthesis of a LaFeO3 (80%)/g-C3N4
catalyst exhibiting a HER of 1152 µmol.g-1.h-1 using methanol as sacrificial substrate and 1% Pt as co-catalyst [41].
Herein, we report the first preparation of a thin LaFeO3 film deposited on a g-C3N4 film for
PEC water splitting. Spin-coating and magnetron sputtering, which are facile and scalable methods, were used to deposit g-C3N4 and LaFeO3, respectively, to obtain heterostructured
films. Photocurrent and HER measurements revealed that photocatalytic properties of LaFeO3 were significantly improved after coupling with g-C3N4. A high HER value of 10.8
µmol-1.h-1.cm-2 was determined after 7 h under visible light irradiation. Moreover, 70% of the photocatalytic activity of the LaFeO3/g-C3N4 were retained after the third cycle, indicating its
good stability.
Experimental section
Synthesis and deposition of g-C3N4 on FTO
The g-C3N4 powder was synthesized by heat treatment of urea. Briefly, urea was placed in a
crucible and stepwise heated at 250, 350 and 450°C for 1 h each with a heating rate of 10°C.min-1. After cooling to room temperature, the pale yellow solid was grounded into powder.
Prior to any deposition, a transparent conductive oxide substrate, Fluorine doped Tin Oxide coated glass (FTO, TEC 7 Ω/sq, Solems) was successively washed with acetone and ethanol for ten minutes in an ultrasonic bath before drying with compressed air. g-C3N4 was
dispersed in methanol at the concentration of 0.5 mg·mL-1 and ultrasonicated for 20 min. The dispersion was then left to rest for at least 4 days to let the largest particles to sediment. The concentration of the remaining lightweight exfoliated g-C3N4 in methanol was
5 g-C3N4 nanosheets were deposited by dropping 10 µL of the previously prepared dispersion
solution onto cleaned FTO and rotated at 500 rpm for 10 s. This step was repeated several times in order to control the g-C3N4 film thickness. Spin-coating was followed by a thermal
treatment at 115°C on a hot plate for 30 min in air to evaporate methanol and assure good electrical contact.
Elaboration of LaFeO3 thin film
LaFe films were deposited on pre-cleaned FTO or on g-C3N4 deposited on FTO by DC
magnetron co-sputtering from two metallic targets: iron target (diameter: 50 mm, thickness: 0.25 mm, purity: 99.5%) and lanthanum target (diameter: 50 mm, thickness: 3 mm, purity: 99.9%). Two independent magnetrons focused at the centre of the substrate-holder and inclined by 30° with respect to the substrate normal were used with a target to substrate distance set equal to 10 cm. The base pressure in the sputtering chamber during deposition was 0.58 Pa in an atmosphere containing 10 vol.% H2 – 90 vol.% Ar. The compositions of the
thin films were controlled by the adjustment of the power applied to metallic target and stoichiometric LaFe films were obtained at 80 W on Fe target and 65 W on La target, respectively. Before deposition, a shutter was placed in front of the target to isolate the substrate during 5 min in order to remove native oxide layers. Thickness was controlled by adjusting the sputtering time. The substrate-holder rotated at 28 rpm during deposition to ensure homogeneity. Thin films were deposited without external heating and the deposition temperatures were below 50°C. At these temperatures, films remained amorphous and a post-annealing was performed to synthesize LaFeO3 perovskite structure in a tubular furnace
at 500°C for 2 h in air.
Characterization
The surface morphology of the films was imaged by a Philips XL30S-FEG scanning electron microscope (SEM). Film thicknesses were measured by SEM cross-section observation. The La/Fe atomic ratio was determined by energy dispersive spectroscopy (EDS). The crystallographic structure of the films was determined by X-ray diffraction (XRD) performed at room temperature using Bragg-Brentano θ/2θ measurements on a D8 Advance Bruker
6 diffractometer (Cu Kα, λ = 1.54056 Å). Fourier transform infrared (FT-IR) spectra were recorded on an Agilent Cary 680 equipped with an attenuated total reflexion (ATR) element (resolution = 4 cm-1). UV-visible absorption spectra were recorded on Cary 7000 UMS Agilent UV-visible spectrophotometer. Raman analyses were conducted using a Horiba Labram HR800 equipment with a 633 nm laser. All the optical measurements were performed at room temperature under ambient conditions.
X-ray photoelectron spectroscopy (XPS) analyses were performed on a Gammadata Scienta (Uppsala, Sweden) SES 200-2 spectrometer under ultra-high vacuum (P < 10−9 mbar). The measurements were performed at normal incidence (the sample plane is perpendicular to the emission angle). The spectrometer resolution at the Fermi level is about 0.4 eV. The depth analyzed extends up to about 8 nm. The monochromatized Al Kα source (1486.6 eV) was operated at a power of 420 W (30 mA and 14 kV) and the spectra were acquired at a take-off angle of 90° (angle between the sample surface and photoemission direction). During acquisition, the pass energy was set to 500 eV for wide scans and to 100 eV for high-resolution spectra. CASAXPS software (Casa Software Ltd, Teignmouth, UK, www.casaxps.com) was used for all peak fitting procedures and the areas of each component were modified according to classical Scofield sensitivity factors.
The photoelectrochemical performance of as-prepared samples was measured in a three-electrode cell with Pt wire as the counter three-electrode, a saturated Ag/AgCl three-electrode as reference electrode and FTO glass coated with LaFeO3 or LaFeO3/g-C3N4 materials with a
surface area of 1 cm² as the working electrode. A 0.1 M Na2SO4 (pH = 7) aqueous solution
was used as electrolyte. All measurements were carried out under light illumination of 1 sun (100 mW·cm-2) provided by a 300 W Xe arc lamp fitted with an AM 1.5G filter. Linear sweep voltammetry (LSV) measurements were performed by scanning the potential from -0.8 V to 0 V vs Ag/AgCl at a scan rate of 5 mV.s-1. Chronoamperometric measurements were recorded at a constant potential of -0.30 V vs the reference electrode by using a SP150 BioLogic potentiostat, cycling between dark and light illuminations of 30 s each for 10 min for evaluating photocurrent density.
Electrochemical Impedance spectroscopy (EIS) was performed for Nyquist measurements. Frequency range of 500 kHz - 1 mHz and magnitude of the modulation signal of 10 mV were used. Applied potential was -0.3 V vs Ag/AgCl under 1 sun illumination. Mott-Schottky
7 spectra were acquired at frequencies from 6 kHz to 10 kHz in the potential range of 0.6 V to 1.6 V vs the reference electrode in the dark.
Hydrogen photoproduction
The photocatalytic hydrogen production test was performed in a sealed custom-made metallic photoelectrochemical cell with an attached quartz viewport using the irradiation conditions previously described. The whole system was filled with 0.1 M Na2SO4 (pH = 7) and
purged with argon for 1 h before measurements. During the reaction, the amount of produced H2 was determined with online quadrupole mass spectrometer (MS, Inficon
Transpector MPS 100) operating with Ar as carrier gas. Measurements were realized at an interval of 1 h and averaged over 2 min.
Results and discussion
Materials characterization
LaFeO3/g-C3N4 films on FTO were prepared using a three steps process depicted in Fig. 1.
First, exfoliated g-C3N4 was coated on FTO via spin-coating. Next, La and Fe were deposited
at the surface of g-C3N4 by DC magnetron co-sputtering. Finally, crystalline LaFeO3 was
produced by air oxidation of La-Fe films at 500°C for 2 h.
Fig. 1. Schematic illustration of the LaFeO3/g-C3N4 film synthesis on FTO.
In order to reveal the structure, the composition and the morphology of the prepared samples, SEM, FT-IR, XRD and XPS analyses were conducted. Due to the high roughness of the FTO support, g-C3N4 and LaFeO3 layers could not be observed by SEM (Fig. S1 and 2). The
8 associated EDS mappings (Fig. 2) show that g-C3N4 and LaFeO3/g-C3N4 films are
homogeneously distributed at the surface of FTO. The La/Fe ratio in La-Fe and LaFeO3 films is
of ca. 1.0 and the La/Fe/O ratio in the LaFeO3 film is of 1.0/1.0/3.0 (Fig. S2), which indicates
the successful deposition of the LaFeO3 film at the surface of g-C3N4. When the same
deposition process was conducted on Si instead of FTO, thicknesses of 50 and 100 nm could be determined by SEM for g-C3N4 and LaFeO3 layers (Fig. S3), respectively, which further
confirms the efficiency of the magnetron co-sputtering method for the preparation of hierarchically structured films.
Fig. 2. (a) SEM image of LaFeO3/g-C3N4 on FTO and EDS elemental mapping of (b) C, (c) N, (d) La,
(e) Fe and (f) O.
Fig. 3a shows the FT-IR spectra of pure g-C3N4 and of LaFeO3/g-C3N4 on the FTO surface. For
g-C3N4, the bands observed between 1625 and 1200 cm-1 can be ascribed to C-N and C=N
bonds stretching vibrations while signals appearing at 1250 and 1205 cm-1 correspond to the C-NH-C stretching vibration between heptazine units [44,49]. The sharp signal located at 810 cm-1 corresponds to the bending vibration of triazine units [46-50]. The peaks of g-C3N4
disappear after deposition of LaFeO3. The signal at 541 cm-1 is the characteristic stretching
vibration of the Fe-O bond in the octahedral FeO6 of crystalline LaFeO3 [51]. The two signals
observed at 1469 and 1406 cm-1 can be attributed to the splitting of the ν3 asymmetric
stretching of La or Fe carbonates present at the surface of the film [52].
(a)
(b)
(c)
(d)
(e)
(f)
C
N
9 The powdered g-C3N4 shows a characteristic peak at 2Ɵ = 26.5° corresponding to the (002)
plane and associated to the interlayer stacking of the conjugated aromatic systems (interlayer distance (d) of 0.32 nm) (Fig. 3b) [53]. The intensity of the g-C3N4 peak after
deposition via spin coating on FTO is low compared to the signals of the substrate due to the weak amount of g-C3N4 present at the FTO surface (estimated to be ca. 1 µg per cm²). The
thickness of the g-C3N4 layer is of ca. 50 nm compared to the 600 nm thickness of FTO. The
signal of g-C3N4 can be better observed after deposition on a Si substrate (Fig. S4). Finally,
the peaks of LaFeO3 deposited on g-C3N4 can be indexed to the orthorhombic structure
(JCPDS No 00-037-1493) [54]. The co-existence of the peaks related to LaFeO3 and g-C3N4
confirms the presence of these two materials on the FTO substrate and indicates that the g-C3N4 layer is stable after the oxidative treatment following the deposition of La and Fe by
magnetron co-sputtering.
Raman spectroscopy was also used to examine the structural phase of the materials prepared (Fig. 3c). For pure LaFeO3, La vibrations can be observed below 200 cm-1 while
signals observed at 301 and 433 cm-1 correspond to Ag and B3g modes, respectively. These
values are in good agreement with those described in the literature for the orthorhombic structure of LaFeO3 [26]. The other peaks observed may originate from structural defects
(cation or oxygen vacancies). The strong signal appearing at 625 cm-1 likely originates from two-phonon scattering and/or impurities as previously reported [55]. After deposition of LaFeO3 on g-C3N4, signals corresponding to CN heterocycles appear in the Raman spectrum
10
Fig. 3. (a) FT-IR spectra of g-C3N4 and of LaFeO3/g-C3N4 deposited on FTO,
(b) XRD patterns of g-C3N4, FTO, g-C3N4 on FTO and LaFeO3/g-C3N4 on FTO and (c) Raman
2000 1750 1500 1250 1000 750 500 1625 1410 1553 1328 A b s o rp ti o n ( a .u .) 810 1250 1205 Wavenumber (cm-1) Fe-O 541 g-C3N4 LaFeO 3/g-C3N4 1469 1406 10 20 30 40 50 60 70 80 90 100 (0 0 2 ) 2 (degree) LaFeO3/g-C3N4 on FTO (0 0 2 ) g-C3N4 on FTO (1 0 1 ) (12 1 ) (2 2 0 ) (2 0 2 ) (2 4 0 ) (2 4 2 ) (2 0 4 ) (2 4 4 ) In te n s it y ( a .u .) FTO (2 1 0 ) (002 ) g-C3N4
(a)
(b)
200 400 600 800 In te n s it y ( a .u .) LaFeO3 301 625 171 285 Raman shift (cm-1) LaFeO3/g-C3N4 407 430 150 219(c)
11 The surface chemical composition and the oxidation states of the elements in the LaFeO3
/g-C3N4 film were characterized by XPS (Fig. 4 and Fig. S5). The XPS survey spectrum of the film
shows only the presence of La, Fe, O and C elements. The signal of N 1s could not be detected due to the thick layer of LaFeO3 at the surface of g-C3N4 (the penetration depth of
XPS, ca. 10 nm, does not allow reaching the g-C3N4 layer). The peaks of Fe 2p3/2 and Fe 2p5/2
are located at 711.60 and 724.02 eV, respectively, values corresponding to the core level spectra of Fe3+ cations included in a oxide (Fig. 4a) [28,41]. The high resolution XPS spectrum of La 3d shows signals at 855.40 and 838.59 eV corresponding to the spin-orbit splitting of La 3d3/2 and La 3d5/2 (Fig. 4b) [41,57]. The binding energies also confirm that La is present in the
+3 oxidation state and incorporated in an oxide. The O 1s peak can be deconvoluted into two signals located at 529.68 and 531.65 eV which can be attributed to O atoms in the LaFeO3
crystal lattice (La-O and Fe-O bonds) and to chemisorbed O containing species at the surface of LaFeO3, respectively (Fig. 4c). Finally, the three peaks located at 285.0, 286.60 and 289.02
eV likely originate from carbon contaminants located at the surface of the LaFeO3/g-C3N4
film (Fig. 4d).
12
Fig. 4. High resolution XPS spectra of (a) Fe 2p, (b) La 3d, (c) O 1s and (d) C 1s for the
LaFeO3/g-C3N4 film.
Optical and electrochemical measurements
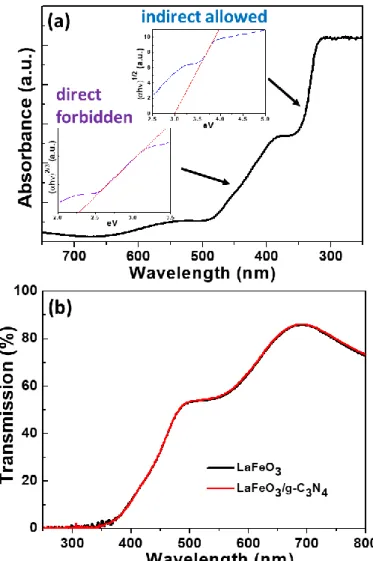
The UV-visible absorption spectrum of the pure 50 nm-thick LaFeO3 film is presented in Fig.
5a. The optical bandgap (Eg) was determined using the Tauc/David-Mott model, by plotting (αhv)1/n vs. hv, where h is Planck’s constant, α is the absorption coefficient γ is the photon frequency and n is 1/2 for direct allowed transitions or 2 for indirect allowed transition [58]. The Eg value was estimated by extrapolating the linear region of the plot onto energy axis (insets of Fig. 5a). The absorption spectrum clearly shows two absorption edges, located at approximately λ1 = 350 nm and λ2 = 480 nm. The optical properties of LaFeO3 were studied
by Scafetta et al. using the density functional theory (DFT) [59]. The lowest bandgap was demonstrated to originate from a direct forbidden transition. Applying the same model to the present experimental data, a bandgap of ca. 2.28 eV was determined. This value is in
13 good agreement with those described in the literature for nanocristalline LaFeO3 [59,60]. A
similar approach was also been used to determine the higher indirect transition at ca. 3 eV. The high absorption in the visible region originating from the electronic transition from the valence band to the conduction band (O 2p → Fe 3d) [17] should be beneficial for the photocatalytic activity under simulated solar light irradiation. Similar optical features were observed for the LaFeO3 film deposited on g-C3N4 (Fig. 5b).
Fig. 5. UV-visible optical absorption spectrum of (a) a 50 nm-thick LaFeO3 film on FTO (the
insets show the Tauc plots for a direct-forbidden and indirect-allowed model for the first and second transitions, respectively). (b) LaFeO3/g-C3N4 film.
14 Electrochemical impedance spectroscopy (EIS) measurements were conducted to determine the LaFeO3 flatband potential. Fig. 6 shows the Mott-Schottky plots for LaFeO3 thin film at
different frequencies in the dark. The negative slope indicates that LaFeO3 behaves as a
p-type semiconductor. The flatband potential was estimated using the following Mott-Schottky equation for p-type semiconductor [61]:
(1)
where C is the capacitance, e is the electronic charge, εr is the relative permittivity of
materials, ε0 is the permittivity of vacuum, ND is the carrier concentration, kB is the
Boltzmann’s constant, T is the absolute temperature, A is the area of electrode, V is the applied potential and Vfb is the flatband potential. Therefore, the flatband potential can be
obtained by extrapoling the linear portion of the Mott-Schottky plot to V axis. A similar potential of +1.47 V vs Ag/AgCl was obtained for each applied frequency. The measured flatband potential can be converted to the RHE scale using the Nernst equation:
(2)
15
Fig. 6. Mott-Schottky plots for LaFeO3 film (50 nm) at different frequencies determined
from EIS measurements in the dark, in Na2SO4 (pH = 7).
Assuming in first approximation that the flatband potential of a p-type semiconductor is very close to the valence band (VB) edge position [52], the valence band maximum (VBM) of LaFeO3 was estimated to be 2.08 V vs RHE. Combined with the bandgap of 2.28 eV, the
conduction band minimum (CBM) of the LaFeO3 film was estimated to be -0.2 V vs RHE. As
the accuracy of the flatband value determined from Mott-Schottky plot may be debatable due to a possible influence of the surface roughness and the electrolyte [62], a semi-empirical method was also used to confirm the band positions. CBM and VBM values were calculated from Mulliken's electronegativity at point of zero charge using the following equation [63]:
(3)
(4)
where EVB and ECB are the VB edge potential and CB edge potential respectively, χ is the
absolute electronegativity of the semiconductor on Mulliken's scale (χ = 5.54 for LaFeO3), Ee
is the energy of free electrons on the hydrogen scale (4.5 eV vs RHE) and Eg is the bandgap
energy estimated from UV-Vis absorption spectra. VBM and CBM positions were estimated
0.6 0.8 1.0 1.2 1.4 1.6 0.0 0.4 0.8 1.2 1.6
C
- ²
(µF
-2)
Potential (V vs Ag/AgCl)
6 kHz 7 kHz 8 kHz 9 kHz 10 kHz 2.2 2.0 1.8 1.6Potential (V vs RHE)
1.416 to be 2.18 and -0.1 V vs RHE, respectively. These theoretical calculations are in good agreement with Mott-Schottky plots.
VBM and CBM positions of g-C3N4 were determined in [47]. The corresponding energy
diagram of LaFeO3 and g-C3N4 before contact is reported in Fig. 7a. LaFeO3 exhibits VBM and
CBM that straddle the redox potential of water. This suggest that LaFeO3 is able to generate
hydrogen using visible part of the spectrum without applying any external bias voltage as observed by Pawar et al. [20]. However, the kinetics of production is very low due to the very close position of CB in regards to reduction potential of hydrogen. LaFeO3 associated to
g-C3N4 will form a p-n heterojunction. PEC efficiency can be greatly influenced by the
recombination rate of photo-generated charge carriers and p-n junctions generally promote the effective separation of light-induced electrons and holes. Before contact, CB and Fermi level positions of LaFeO3 are lower than those of g-C3N4. At the junction, the Fermi level
after contact, under equilibrium conditions, is equal and constant in g-C3N4 and LaFeO3,
causing an energy band bending. Indeed, after contact between p-type LaFeO3 and n-type
g-C3N4, electrons diffuse from g-C3N4 to LaFeO3 due to the initial positions of CB, leading to an
accumulation of negative charges in LaFeO3 close to the junction. At the same time, a
positive section in g-C3N4 is generated near the junction. As a consequence, the Fermi level
and energy band positions of g-C3N4 shift downward (to more positive potentials), while
those of LaFeO3 shift upward (to more negative potentials) to form an equilibrium state,
where an inner electric field is generated and the CB of LaFeO3 is higher than that of g-C3N4
(Fig. 7b). Thus, photogenerated electrons on the CB of LaFeO3 will transfer to that of g-C3N4.
Migration of electrons and holes are promoted by the internal field. Subsequently, the interface of the heterojunction will improve the separation of electron-holes pairs and reduce their recombination probability [64].
17
Fig. 7. Schematic diagrams of band energy positions of g-C3N4 and LaFeO3 (a) before contact
and (b) the proposed electrons/holes transfer and separation processes after contact.
Photoelectrochemical (PEC) analysis
Linear sweep voltammetry (J-V) curves of LaFeO3/g-C3N4 were recorded under simulated
sunlight illumination (100 mW·cm-2, AM 1.5G), where a chopped beam was used for acquiring both dark current and photocurrent in a single scan at a rate of 5 mV.s-1 (Fig. 8a). Each cycle lasts 25 mV. The steady state photocurrent onset potential was around 0.6 V vs RHE and the dark current remained stable until 0.25 V vs RHE.
To determine the LaFeO3 on g-C3N4 ratio giving the highest performance, the amount of each
material was optimised from chronoamperometric tests under chopped illumination (30 s). The potential was kept constant at -0.3 V versus Ag/AgCl (0.3 V vs RHE) to ensure the minimal impact of dark current in the 0.1 M Na2SO4 (pH = 7) electrolyte solution. The
photocurrent density varied with the amount of g-C3N4 underneath 50 nm-thick LaFeO3 (Fig.
8b). The photoelectrode elaborated using 1 µg of g-C3N4 exhibits the highest photocurrent
density (4 µA.cm-2). The thickness of the LaFeO3 film deposited on 1 µg of g-C3N4 was also
18 Optimal quantities for both materials were thus determined to be a 50 nm thick layer of LaFeO3 deposited on top of 1 µg of g-C3N4 with a maximum photocurrent density of 4 µA.cm -2
. Spikes and transient photocurrent observed during each period can be attributed to charge carriers recombination. A large number of photoinduced electrons cannot reach the electrolyte before recombining with holes. The photocurrent density becomes stable only when the balance between charge generation, separation, transport and recombination processes is achieved. As expected, thickness of photoelectrode is major parameter that directly impacts the photocurrent density. The electron transport within LaFeO3 is low and
charge carriers recombination probability increases with thickness. By contrast, photoactive materials have to be thick enough to ensure light absorption leading to the formation of a high density of electron/hole pairs [65]. The observed higher photocurrent density of LaFeO3/g-C3N4 by comparison with LaFeO3 suggests an enhanced charge carriers separation
in the heterostructured photoelectrode. Fig. 8d shows the Nyquist plots of EIS spectra for LaFeO3 (50 nm) and optimised LaFeO3/g-C3N4 under illumination. The semicircle diameter is
related to the charge transfer resistance at the electrode/electrolyte interface. LaFeO3
/g-C3N4 has a smaller arc diameter than that of LaFeO3, which means a smaller charge transfer
resistance. Both photocurrent and EIS results indicate that heterostructured LaFeO3/g-C3N4
film exhibits more efficient electron-hole separation under simulated sunlight illumination, mainly due to the electrostatic field in the junction [66].
19
Fig. 8. Current-potential curve (a) and current-time curves of LaFeO3/g-C3N4
heterojunctions at −0.3 V vs Ag/AgCl as a function of (b) the quantity of g-C3N4 spin-coated
on FTO (LaFeO3 thickness = 50 nm) and (c) the LaFeO3 film thickness (amount of g-C3N4 = 1
µg) under chopped illumination. (d) EIS Nyquist plots of 50 nm thick LaFeO3 and optimised
LaFeO3/g-C3N4 heterostructure (electrolyte: 0.1 M Na2SO4 (pH = 7)).
The stability is a crucial parameter to determine if a system is suitable for practical utilisation. In order to test the stability, a chronoamperometry measurement was conducted for LaFeO3/g-C3N4 heterostructured photocathode at a constant potential of -0.3 V vs
Ag/AgCl over a 24 h period under a continuous simulated sunlight illumination in a 0.1 M Na2SO4 electrolyte solution (Fig. 9). After a slight drop in the first 2 h, the current density
remained almost constant over the following 22 h (ca. 2.9 µA.cm-2), confirming excellent stability of the photoelectrode. The slight decrease of photocurrent at the beginning of the reaction is generally attributed to the accumulation of gas bubbles at the electrode/electrolyte interface leading to a reduced effective surface area [67]. LaFeO3 and
g-C3N4 are promising photoelectrode materials mainly due to their chemical and thermal
20 columnar structure with no voids and pores. As a consequence, the electrolyte cannot deeply penetrate in the film and the effective surface area is low, leading to a relatively low photocurrent density. However, the compact nature of the films ensures a good stability of the photoelectrodes by limiting their degradation during a long period of operation. LaFeO3/g-C3N4 heterostructured films can thus be used as photocathode for hydrogen
production performed over several hours.
Fig. 9. J-t plot at -0.3V vs Ag/AgCl of 50 nm LaFeO3 deposited over 1 µg of g-C3N4, insert is a
detail of the first hour.
Hydrogen evolution measurement
Fig. 10a shows the hydrogen production rates of electrodes composed of g-C3N4, LaFeO3 and
optimized LaFeO3/g-C3N4 in an aqueous Na2SO4 (pH = 7) electrolyte under a continuous
simulated sunlight illumination and at a constant potential of -0.3 V vs Ag/AgCl. The hydrogen production rate was monitored each hour (over 7 h) by mass spectrometry. The cell was first purged with argon for 1 h to ensure that oxygen from air was not involved when the reaction starts. It is worth noting that hydrogen production rates generated by these different photocathodes are in good agreement with current-potential curves. Samples showed very similar hydrogen evolution rates with an initial activation period of
21 about 3 h, followed by a stable and maximum production period. H2 production rates of
g-C3N4, LaFeO3 and LaFeO3/g-C3N4 in the steady states are 5.5, 6.2 and 10.8 µmol.h-1.cm-2,
respectively. As a consequence, an increase of 74% in H2 production rate is observed by
depositing a g-C3N4 sublayer underneath LaFeO3 thin film. To determine the stability of
LaFeO3/g-C3N4 heterostructured film, sample underwent 3 cycles of water splitting test (Fig.
10b). These results provide additional evidence that the film is reusable although a decrease of 30% is observed after the third cycle.
Based on the previously described experimental results, a possible mechanism can be proposed for the photogenerated charges separation and the PEC water splitting process (Fig. 10c). Under visible light irradiation, both g-C3N4 and LaFeO3 absorb photons and
electron-hole pairs are generated. In the heterostructured film, photo-excited electrons in the CB of g-C3N4 can transfer to the CB of LaFeO3 while holes in the VB of LaFeO3 move to
the VB of g-C3N4, thus facilitating the separation of electron/hole pairs. In the overall PEC
process, the reaction of hydroxyl anions OH- (or H2O) at the Pt counter electrode will
produce electrons that can combine with holes in the VB of g-C3N4. Due to their more
positive potential than the H+/H2 couple, the electrons in the CB of LaFeO3 can reduce H+
into H2. The LaFeO3/g-C3N4 photocathode benefits from the efficient charge carrier
22
Fig. 10. (a) Hydrogen production rate of LaFeO3, g-C3N4 and LaFeO3/g-C3N4 photoelectrodes
and (b) stability performances of LaFeO3/g-C3N4 heterostructured film over 3 cycles (-0.3 V vs
Ag/AgCl, 0.1 M Na2SO4, 100 mW.cm-2 – AM1.5G) and (c) Schematic illustration of the
electron transfer pathway for visible light PEC hydrogen production using LaFeO3/g-C3N4
films.
Conclusion
For the first time, a thin LaFeO3 film was deposited using magnetron sputtering and
associated with g-C3N4 for PEC hydrogen production. g-C3N4 was deposited directly on the
substrate, prior to LaFeO3, using a simple spin-coating method. Deposition of a sublayer of
g-C3N4 improves the separation of charge carriers at the LaFeO3/g-C3N4 interface, while optical
properties of LaFeO3 still allows it to absorb a large range of the visible spectra, increasing its
efficiency. Optimal quantities of both materials were determined using chronoamperometry. Subsequently, water splitting test was performed to estimate the photocatalytic properties
23 of the g-C3N4/LaFeO3 heterojunction to produce hydrogen. Associating LaFeO3 with g-C3N4
led to hydrogen production rate of 10.8 µmol·h-1·cm-2 and to an increased amount of produced hydrogen by 74% compared to pure LaFeO3. The hydrogen production remains
high after three reuses, demonstrating the stability of the g-C3N4/LaFeO3 film after further
cycles of production and its ability to harvest light for days. Our work thus demonstrates a simple route to obtain well performant heterostructured materials systems for hydrogen production from low-cost, non-toxic and abundant components.
Acknowledgements
This work was supported partly by the French PIA project « Lorraine Université d’Excellence », reference ANR-15-IDEX-04-LUE.
Appendix A. Supplementary data
Supplementary data to this article can be found at http://doi.org/
References
[1] Mazloomi K, Gomes C. Hydrogen as an energy carrier: prospects and challenges. Renew Sust Energ Rev 2012;16:3024–33. https://doi.org/10.1016/j.rser.2012.02.028.
[2] Züttel A, Remhof A, Borgschulte A, Friedrichs O. Hydrogen: the future energy carrier. Philos Trans A Math Phys Eng Sci 2010;368:3329–42.
https://doi.org/10.1098/rsta.2010.0113.
[3] Ewan BCR, Allen RWK. A figure of merit assessment of the routes to hydrogen. Int J Hydrog Energy 2005;30:809–819. https://doi.org/10.1016/j.ijhydene.2005.02.003. [4] Acar C, Dincer I, Naterer GF. Review of photocatalytic water‐splitting methods for
sustainable hydrogen production. Int J Energy Res 2016;40:1449-1473.
[5] Fajrina N, Tahir M. A critical review in strategies to improve photocatalytic water splitting towards hydrogen production. Int J Hydrog Energy 2019;44:540-577. https://doi.org/10.1016/j.ijhydene.2018.10.200
[6] Fushijima A,Honda K. Electrochemical photolysis of water at a semiconductor electrode. Nature 1972;238:37–38. https://doi.org/10.1038/238037a0. [7] Grätzel M. Photoelectrochemical cells. Nature 2001;414:338–44.
24 [8] Lin Y, Yuan G, Liu R, Zhou S, Sheehan SW, Wang D. Semiconductor nanostructure-based
photoelectrochemical water splitting: a brief review. Chem Phys Lett 2011;507:209–15. https://doi.org/10.1016/j.cplett.2011.03.074.
[9] Wang R, Yan J, Zu M, Yang S, Cai X, Gao Q, Fang Y, Zhang S, Zhang S. Facile synthesis of interlocking g-C3N4/CdS photoanode for stable photoelectrochemical hydrogen
production. Electrochim Acta 2018;279:74-83.
https://doi.org/10.1016/j.electacta.2018.05.076
[10] Zhang S, Yan J, Yang S, Xu Y, Cai X, Li X, Zhang X, Peng F, Fang Y. Electrodeposition of Cu2O/g‐C3N4 heterojunction film on an FTO substrate for enhancing visible light
photoelectrochemical water splitting. Chinese J Catal 2017;38:365–371. https://doi.org/10.1016/S1872‐2067(16)62588‐3
[11] Yu Y, Zhang Z, Yin X, Kvit A, Liao Q, Kang Z, Yan X, Zhang Y, Wang X. Enhanced photoelectrochemical efficiency and stability using a conformal TiO2 film on a black
silicon photoanode. Nat Energy 2017;2:17045. https://doi.org/10.1038/nenergy.2017.45.
[12] Wolcott A, Smith WA, Kuykendall TR, Zhao Y, Zhang JZ. Photoelectrochemical study of nanostructured ZnO thin films for hydrogen generation from water splitting. Adv Funct Mater 2009;19:1849–56. https://doi.org/10.1002/adfm.200801363.
[13] Acar C, Dincer I, Naterer GF. Review of photocatalytic water-splitting methods for sustainable hydrogen production. Int J Energy Res 2016;40:1449–73.
https://doi.org/10.1002/er.3549.
[14] Kumaravel V, Mathew S, Bartlett J, Pillai SC. Photocatalytic hydrogen production using metal doped TiO2: a review of recent advances. Appl Catal B 2019;244:1021–64.
https://doi.org/10.1016/j.apcatb.2018.11.080.
[15] Cai J, Shen J, Zhang X, Ng YH, Huang j, Guo W, Lin C, Lai Y. Light-driven sustainable hydrogen production utilizing TiO2 nanostructures: a review. Small Methods
2019;3:1800184. https://doi.org/10.1002/smtd.201800184.
[16] Wheeler GP, Choi KS. Photoelectrochemical properties and stability of nanoporous p-type LaFeO 3 photoelectrodes prepared by electrodeposition. ACS Energy Lett
2017;2:2378–82. https://doi.org/10.1021/acsenergylett.7b00642.
[17] Parida KM, Reddy KH, Martha S, Das DP, Biswal N. Fabrication of nanocrystalline LaFeO3: an efficient sol–gel auto-combustion assisted visible light responsive
photocatalyst for water decomposition. Int J Hydrog Energy 2010;35:12161–8. https://doi.org/10.1016/j.ijhydene.2010.08.029.
[18] Celorrio V, Bradley K, Weber OJ, Hall SR, Fermín DJ. Photoelectrochemical properties of LaFeO 3 nanoparticles. ChemElectroChem 2014;1:1667–71.
https://doi.org/10.1002/celc.201402192.
[19] Díez-García MI, Gómez R. Metal doping to enhance the photoelectrochemical behavior of LaFeO 3 photocathodes. ChemSusChem 2017;10:2457–63.
https://doi.org/10.1002/cssc.201700166.
[20] Pawar GS, Tahir AA. Unbiased spontaneous solar fuel production using stable LaFeO3
photoelectrode. Sci Rep 2018;8:3501. https://doi.org/10.1038/s41598-018-21821-z. [21] Pawar GS, Elikkottil A, Seetha S, Reddy KS, Pesala B, Tahir AA, Mallick TK. Enhanced
photoactivity and hydrogen generation of LaFeO 3 photocathode by plasmonic silver
nanoparticle incorporation. ACS Appl Energy Mater 2018;1:3449–56. https://doi.org/10.1021/acsaem.8b00628.
25 [22] Jaouali I, Hamrouni H, Moussa N, Nsib MF, Centeno MA, Bonavita A, Neri G, Leonardi
SG. LaFeO3 ceramics as selective oxygen sensors at mild temperature. Ceram Int
2018;44:4183–89. https://doi.org/10.1016/j.ceramint.2017.11.221.
[23] Barbero BP, Gamboa JA, Cadús LE. Synthesis and characterisation of La1−xCaxFeO3
perovskite-type oxide catalysts for total oxidation of volatile organic compounds. Appl Catal B 2006;65:21–30. https://doi.org/10.1016/j.apcatb.2005.11.018.
[24] Anajafi Z, Naseri M, Neri G. Optical, magnetic and gas sensing properties of LaFeO3
nanoparticles synthesized by different chemical methods. J Electron Mater 2019;48:6503-11. https://doi.org/10.1007/s11664-019-07436-8.
[25] Peng Q, Wang J, Wen YW, Shan B, Chen R. Surface modification of LaFeO3 by Co-Pi
electrochemical deposition as an efficient photoanode under visible light. RSC Adv 2016;6:26192–8. https://doi.org/10.1039/C6RA01810F.
[26] Li S, Jing L, Fu W, Yang L, Xin B, Fu H. Photoinduced charge property of nanosized perovskite-type LaFeO3 and its relationships with photocatalytic activity under visible
irradiation. Mater Res Bull 2007;42:203–12.
https://doi.org/10.1016/j.materresbull.2006.06.010.
[27] Hu R, Li C, Wang X, Sun Y, Jia H, Su H, Zhang Y. Photocatalytic activities of LaFeO3 and
La2FeTiO6 in p-chlorophenol degradation under visible light. Catal Commun
2012;29:35–39. https://doi.org/10.1016/j.catcom.2012.09.012.
[28] Thirumalairajan S, Girija K, Hebalkar NY, Mangalaraj D, Viswanathan C, Ponpandian N. Shape evolution of perovskite LaFeO3 nanostructures: a systematic investigation of
growth mechanism, properties and morphology dependent photocatalytic activities. RSC Adv 2013;3:7549–61. https://doi.org/10.1039/C3RA00006K.
[29] Li J, Pan X, Xu Y, Jia L, Yi X, Fang W. Synergetic effect of copper species as cocatalyst on LaFeO3 for enhanced visible-light photocatalytic hydrogen evolution. Int J Hydrog
Energy 2015;40:13918–25. https://doi.org/10.1016/j.ijhydene.2015.07.166. [30] Ismael M, Wark M. Perovskite-type LaFeO3: photoelectrochemical properties and
photocatalytic degradation of organic pollutants under visible light irradiation. Catalysts 2019;9:342. https://doi.org/10.3390/catal9040342.
[31] Ren X, Yang H, Gen S, Zhou J, Yang T, Zhang X, Cheng Z, Sun S. Controlled growth of LaFeO3 nanoparticles on reduced graphene oxide for highly efficient photocatalysis.
Nanoscale 2016;8:752–6. https://doi.org/10.1039/C5NR06338H.
[32] Humayun M, Qu Y, Raziq F, Yan R, Li Z, Zhang X, Jing L. Exceptional visible-light activities of TiO2-coupled N-doped porous perovskite LaFeO3 for 2,4-dichlorophenol
decomposition and CO2 conversion. Environ Sci Technol 2016;50:13600–10.
https://doi.org/10.1021/acs.est.6b04958.
[33] Gong C, Zhang Z, Lin S, Wu Z, Sun L, Ye C, Hu Y, Lin C. Electrochemical synthesis of perovskite LaFeO3 nanoparticle-modified TiO2 nanotube arrays for enhanced
visible-light photocatalytic activity. New J Chem 2019;43:16506–14. https://doi.org/10.1039/C9NJ03908B.
[34] Xu K, Xu H, Feng G, Feng J. Photocatalytic hydrogen evolution performance of NiS cocatalyst modified LaFeO3/g-C3N4 heterojunctions. New J Chem 2017;41:14602–9.
https://doi.org/10.1039/C7NJ03120C.
[35] Rakibuddin M, Kim H, Ehtisham Khan M. Graphite-like carbon nitride (C3N4) modified
N-doped LaTiO3 nanocomposite for higher visible light photocatalytic and
photo-electrochemical performance. Appl Surf Sci 2018;452:00–412. https://doi.org/10.1016/j.apsusc.2018.05.018.
26 [36] Jin L, Zhou X, Ning X, Zhan L, Kong M, Tan K, Li J, Lin Z. Boosting visible light
photocatalytic performance of g-C3N4 nanosheets by combining with LaFeO3
nanoparticles. Mater Res Bull 2018;102:353–61. https://doi.org/10.1016/j.materresbull.2018.02.057.
[37] Wu Y, Wang H, Tu W, Liu Y, Tan YZ, Yuan X, Chew JW. Quasi-polymeric construction of stable perovskite-type LaFeO3/g-C3N4 heterostructured photocatalyst for improved
Z-scheme photocatalytic activity via solid p-n heterojunction interfacial effect. J Hazard Mater 2018;347:412–22. https://doi.org/10.1016/j.jhazmat.2018.01.025.
[38] Ye Y, Yang H, Wang X, Feng W. Photocatalytic, fenton and photo-fenton degradation of RhB over Z-scheme g-C3N4/LaFeO3 heterojunction photocatalysts. Mater Sci Semicond
Process 2018;82:14–24. https://doi.org/10.1016/j.mssp.2018.03.033.
[39] Gao X, Shang Y, Liu L, Nie W. A plasmonic Z-scheme three-component photocatalyst g-C3N4/Ag/LaFeO3 with enhanced visible-light photocatalytic activities. Opt Mater
2019;88:229–37. https://doi.org/10.1016/j.optmat.2018.11.030.
[40] Ibarra-Rodriguez LI, Huerta-Flores AM, Torres-Martínez LM. Facile synthesis of g-C3N4/
LaMO3 (M: Co, Mn, Fe) composites for enhanced visible-light-driven photocatalytic
water splitting. Mater Sci Semicond Process 2019;103:104643. https://doi.org/10.1016/j.mssp.2019.104643.
[41] Acharya S, Mansingh S, Parida KM. The enhanced photocatalytic activity of g-C3N4
-LaFeO3 for the water reduction reaction through a mediator free Z-scheme mechanism.
Inorg Chem Front 2017;4:1022–32. https://doi.org/10.1039/C7QI00115K.
[42] Ye S, Wang R, Wu MZ, Yuan YP. A review on g-C3N4 for photocatalytic water splitting
and CO2 reduction. Appl Surf Sci 2015;358:15–27.
https://doi.org/10.1016/j.apsusc.2015.08.173.
[43] Wen J, Xie J, Chen X, Li X. A review on g-C3N4-based photocatalysts. Appl Surf Sci
2017;391:72–123. https://doi.org/10.1016/j.apsusc.2016.07.030.
[44] Fu J, Yu J, Jiang C, Cheng B. g-C3N4-based heterostructured photocatalysts. Adv Energy
Mater 2018;8:1701503. https://doi.org/10.1002/aenm.201701503.
[45] Mishra A, Mehta A, Basu S, Shetti NP, Reddy KR, Aminabhavi TM. Graphitic carbon nitride (g–C3N4)–based metal-free photocatalysts for water splitting: a review. Carbon
2019;149:693–721. https://doi.org/10.1016/j.carbon.2019.04.104.
[46] Moussa H, Chouchene B, Gries T, Balan L, Mozet K, Medjahdi G, Schneider R. Growth of ZnO nanorods on graphitic carbon nitride gCN sheets for the preparation of
photocatalysts with high visible-light activity. ChemCatChem 2018;10:4973–83. https://doi.org/10.1002/cctc.201801206.
[47] Ben Abdelaziz M, Chouchene B, Balan L, Gries T, Medjahdi G, Ezzaouia H, Schneider R. One pot synthesis of bismuth oxide/graphitic carbon nitride composites with high photocatalytic activity. Mol Catal 2019;463:110–8.
https://doi.org/10.1016/j.mcat.2018.12.004.
[48] Ouedraogo S, Chouchene B, Desmarets C, Gries T, Balan L, Fournet R, Medjahdi G, Bayo K, Schneider R. Copper octacarboxyphthalocyanine as sensitizer of graphitic carbon nitride for efficient dye degradation under visible light irradiation. Appl Catal A 2018;563:127–36. https://doi.org/10.1016/j.apcata.2018.06.036.
[49] Li X, Zhang J, Shen L, Ma Y, Lei W, Cui Q, Zou G. Preparation and characterization of graphitic carbon nitride through pyrolysis of melamine. Appl Phys A 2009;94:387–92. https://doi.org/10.1007/s00339-008-4816-4.
27 [50] Xiang Q, Yu J, Jaroniec M. Preparation and enhanced visible-light photocatalytic H2
-production activity of graphene/C3N4 composites. J Phys Chem C 2011;115:7355–63.
https://doi.org/10.1021/jp200953k.
[51] Tang P, Tong Y, Chen H, Cao F, Pan G. Microwave-assisted synthesis of nanoparticulate perovskite LaFeO3 as a high active visible-light photocatalyst. Curr Appl Phys
2013;13:340–3. https://doi.org/10.1016/j.cap.2012.08.006.
[52] Dhinesh Kumar R, Jayavel R. Facile hydrothermal synthesis and characterization of LaFeO3 nanospheres for visible light photocatalytic applications. J Mater Sci: Mater
Electron 2014;25:3953–61. https://doi.org/10.1007/s10854-014-2113-x.
[53] Wang X, Maeda K, Thomas A, Takanabe K, Xin G, Carlsson JM, Domen K, Antonietti M. A metal-free polymeric photocatalyst for hydrogen production from water under
visible light. Nat Mater 2008;8:76-80. https://doi.org/10.1038/nmat2317.
[54] Geller S, Wood EA. Crystallographic studies of perovskite-like compounds. I. Rare earth orthoferrites and YFeO3, YCrO3, YAlO3. Acta Cryst 1956;9:563–8.
https://doi.org/10.1107/S0365110X56001571.
[55] Venugopalan S, Becker MM. Raman scattering study of LuFeO3. J Chem Phys
1990;93:3833–6. https://doi.org/10.1063/1.458768.
[56] Wang PN, Guo Z, Ying XT, Chen JH, Xu XM, Li FM. Raman spectroscopy on the β−C3N4
structure formed by low-energy nitrogen ion implantation into a diamond surface. Phys Rev B 1999;59:13347–9. https://doi.org/10.1103/PhysRevB.59.13347.
[57] Peng K, Fu L, Yang H, Ouyang J. Perovskite LaFeO3/montmorillonite nanocomposites:
synthesis, interface characteristics and enhanced photocatalytic activity. Sci Rep 2016;6:19723. https://doi.org/10.1038/srep19723.
[58] Davis EA, Mott NF. Conduction in non-crystalline systems V. Conductivity, optical absorption and photoconductivity in amorphous semiconductors. Philos Mag 1970;22:0903–22. https://doi.org/10.1080/14786437008221061.
[59] Scafetta MD, Cordi AM, Rondinelli JM, May SJ. Band structure and optical transitions in LaFeO3: theory and experiment. J Phys Condens Matter 2014;26:505502.
https://doi.org/10.1088/0953-8984/26/50/505502.
[60] Köferstein R, Jäger L, Ebbinghaus SG. Magnetic and optical investigations on LaFeO3
powders with different particle sizes and corresponding ceramics. Solid State Ion 2013;249–250:1–5. https://doi.org/10.1016/j.ssi.2013.07.001.
[61] Gelderman K, Lee L, Donne SW. Flat-band potential of a semiconductor: using the Mott–Schottky equation. J Chem Educ 2007;84:685.
https://doi.org/10.1021/ed084p685.
[62] Hamann TW, Gstrein F, Brunschwig BS, Lewis NS. Measurement of the dependence of interfacial charge-transfer rate constants on the reorganization energy of redox species at n-ZnO/H2O interfaces. J Am Chem Soc 2005;127:13949–54.
https://doi.org/10.1021/ja0515452.
[63] Lu P, Hu X, Li Y, Peng Y, Zhang M, Jiang X, He Y, Fu M, Dong F, Zhang Z. Novel CaCO3
/g-C3N4 composites with enhanced charge separation and photocatalytic activity. J Saudi
Chem Soc 2019;23:1109-18. https://doi.org/10.1016/j.jscs.2019.07.002.
[64] Liang Q, Jin J, Liu C, Xu S, Li Z. Constructing a novel p-n heterojunction photocatalyst LaFeO3 /g-C3N4 with enhanced visible-light-driven photocatalytic activity. J Alloys
Compd 2017;709:542–8. https://doi.org/10.1016/j.jallcom.2017.03.190.
[65] May KJ, Fenning DP, Ming T, Hong WT, Lee D, Stoerzinger KA, Biegalski MD, Kolpak AM, Shao-Horn Y. Thickness-dependent photoelectrochemical water splitting on ultrathin
28 LaFeO3 films grown on Nb:SrTiO3. J Phys Chem Lett 2015;6:977–85.
https://doi.org/10.1021/acs.jpclett.5b00169.
[66] Yang J, Hu R, Meng W, Du Y. A novel p-LaFeO3/n-Ag3PO4 heterojunction photocatalyst
for phenol degradation under visible light irradiation. Chem Commun 2016;52:2620–3. https://doi.org/10.1039/C5CC09222A.
[67] Hernández S, Barbero G, Saracco G, Alexe-Ionescu AL. Considerations on oxygen bubble formation and evolution on BiVO4 porous anodes used in water splitting
photoelectrochemical cells. J Phys Chem C 2015;119:9916–25. https://doi.org/10.1021/acs.jpcc.5b01635.