Publisher’s version / Version de l'éditeur:
ASHRAE Transactions, 99, 1, pp. 129-138, 1993
READ THESE TERMS AND CONDITIONS CAREFULLY BEFORE USING THIS WEBSITE. https://nrc-publications.canada.ca/eng/copyright
Vous avez des questions? Nous pouvons vous aider. Pour communiquer directement avec un auteur, consultez la
première page de la revue dans laquelle son article a été publié afin de trouver ses coordonnées. Si vous n’arrivez pas à les repérer, communiquez avec nous à [email protected].
Questions? Contact the NRC Publications Archive team at
[email protected]. If you wish to email the authors directly, please see the first page of the publication for their contact information.
NRC Publications Archive
Archives des publications du CNRC
This publication could be one of several versions: author’s original, accepted manuscript or the publisher’s version. / La version de cette publication peut être l’une des suivantes : la version prépublication de l’auteur, la version acceptée du manuscrit ou la version de l’éditeur.
Access and use of this website and the material on it are subject to the Terms and Conditions set forth at
A new similitude modeling technique for studies of nonisothermal
room ventilation flows
Zhang, J. S.; Wu, G. J.; Christianson, L. L.
https://publications-cnrc.canada.ca/fra/droits
L’accès à ce site Web et l’utilisation de son contenu sont assujettis aux conditions présentées dans le site
LISEZ CES CONDITIONS ATTENTIVEMENT AVANT D’UTILISER CE SITE WEB.
NRC Publications Record / Notice d'Archives des publications de CNRC:
https://nrc-publications.canada.ca/eng/view/object/?id=c7dd6a48-fcca-4227-88df-1dfb407796dd https://publications-cnrc.canada.ca/fra/voir/objet/?id=c7dd6a48-fcca-4227-88df-1dfb407796dd
A ne w sim ilit ude m ode ling t e c hnique for st udie s of nonisot he rm a l
room ve nt ila t ion flow s
R N R C C - 3 6 1 4 1
Z h a n g , J . S . ; W u , G . J . ; C h r i s t i a n s o n , L . L .
J a n u a r y 1 9 9 3
A version of this document is published in / Une version de ce document se trouve dans:
ASHRAE Transactions, 99, (1), ASHRAE Winter Meeting, Chicago, IL, USA,
January-24-93, pp. 129-138, 93
http://www.nrc-cnrc.gc.ca/irc
The material in this document is covered by the provisions of the Copyright Act, by Canadian laws, policies, regulations and international agreements. Such provisions serve to identify the information source and, in specific instances, to prohibit reproduction of materials without written permission. For more information visit http://laws.justice.gc.ca/en/showtdm/cs/C-42
Les renseignements dans ce document sont protégés par la Loi sur le droit d'auteur, par les lois, les politiques et les règlements du Canada et des accords internationaux. Ces dispositions permettent d'identifier la source de l'information et, dans certains cas, d'interdire la copie de documents sans permission écrite. Pour obtenir de plus amples renseignements : http://lois.justice.gc.ca/fr/showtdm/cs/C-42
3633
A NEW SIMILITUDE MODELING TECHNIQUE
FOR STUDIES OF NONISOTHERMAL
ROOM VENTILATION FLOWS
J.S. Zhang, Ph.D.
Associate Member ASHRAE
ABSTRACT
G.J. Wu, P.E.
Member ASHRAEPhysically modeling room air movement is a reliable method for studying room airflow characteristics and ventilation effectiveness. However, a proper scaling method is needed to extrapolate the measured results from one physical model to rooms of different sizes so that the results are more useful to ventilation system design engineers. The objective of this study was to develop a scaling method for nonisothermal. and not fully developed turbulent ventilation flows, 1 which are typical in realistic room ventilation
condi-tions.
In this study, similitude modeling for predicting room air motion was investigated theoretically and experimentally with full- and one-fourth-scale test rooms. The critical Archimedes number, at which the diffuser air jet fell immediately after entering the room, was found to decrease when the room dimensions decreased. A new scaling method was proposed based on the relative deviation of Archimedes number from its critical value.
Preliminary evaluation of the new scaling method was conducted by comparison between the one-fourth-scale tests and the corresponding full-scale tests, which indicated that the new scaling method predicted well the overall room airflow patterns, distributions of mean velocity, tempera-ture, and levels of turbulence intensity and turbulent kinetic energy in the occupied regions. Ways for improving the scaling method further are also identified.
INTRODUCTION
Understanding room air distribution is essential to the design of a ventilation system and the control of room thermal and air quality conditions. Air velocities in occu-pied zones of a room directly affect the thermal comfort of the occupants. The movement of air within a room also affects the release rate of heat and contami-nants from various sources. Air movement also determines how the heat and contaminants are distributed and thus affects the
L.L.
Christianson, Ph.D., P.E.
Member ASHRAEair quality available to the occupants. In addition, proper atr distribution can reduce the ventilation rate necessary for removing air contaminants and moisture and thus reduce building energy consumption. The study of room air distribution is important to many applications including commercial and residential rooms, clean room manufactur-ing, electronic and computer rooms, biomedical research, hospital disease control, greenhouses, an.d animal agricul-ture _(Christianson 1989).
Similitude modeling of room air distribution is useful because experiments in reduced-scale rooms are generally more convenient and less expensive to conduct. Using scale models, a broad range of ventilation conditions can be investigated and experimental results can be applied to rooms of different sizes. However, a proper scaling method is needed for the model tests in order to extrapolate the model results to rooms of different sizes quantitatively as well as qualitatively. Developing similitude modeling techniques (scaling methods) for realistic room ventilation flows with internal heat sources and obstructions is one of the research needs in the studies of room air and air contaminant distributions (Int-Hout 1989).
The objectives of the present study were to develop a new scaling method for predicting nonisothermal room ventilation flows and evaluate the method with experimental measurements in a one-fourth-scale model room and its full-scale prototype.
LITERATURE REVIEW
Most similitude studies of room air distribution were done for isothermal and fully developed turbulent flows (e.g., Pattie and Milne 1966; Timmons 1984). In this case, the distribution of the dimensionless velocities (i.e., ratio of room air velocities to the diffuser air velocity) is indepen-dent of the diffuser Reynolds number. Therefore, scale-model tests can be conducted at any diffuser Reynolds number that is higher than a threshold value to ensure fully developed turbulent flow in the model. Timmons (1984)
'When the diffuser Reynolds number is higher than a threshold value, the airflow pattern and distribution of mean air velocity become independent of the Reynolds number. Such a flow is called folly developed turbulent venrilationjlow. The not fully developed ventilation flow refers to room airflows in which the distribution of air velocity is dependent on the diffuser Reynolds number.
Jianshun Zhang is a research associate in the Institute for Research in Construction, National Research Council of Canada. G. Jeff Wu is an assistant professor in the Engineering Development Department, University of Wisconsin, Madison. Leslie L. Christianson is director and a professor in the Bioenvironmental Engineering Research Laboratory, University of Illinois, uコ[「。ョ。Mcィ。ュー。ゥァセ[セN@
compared the results from reduced-scale models to those measured in the prototype, indicating excellent agreement in predicting airflow patterns and velocity profiles for the case of fully developed turbulent flow. Timmons also showed that the threshold Reynolds number, above which the dimensionless velocity and flow pattern were indepen-dent of Reynolds number, increased with the room sizes.
There are scaling difficulties when air is used as the working fluid in the model to simulate nonisothermal room airflows. Baturin (1972) described similitude modeling for room air distribution, using air as the modeling fluid, and described results (primarily related to industrial application) from several Russian engineers. He noted that similitude models must be distorted for nonisothermal flows and suggested that the Archimedes number was critical in determining the trajectory of a diffuser jet.
Moog (1981) provided a physical description and analysis of the room airflow. Moog also noted that com-plete similarity was impossible in conducting reduced-scale model tests for most practical situations due to the complex-ity of the room flow (both nonisothermal and including obstructions). Because of scaling difficulties, . partial similarity is usually used in which only the relatively important dimensionless parameters are maintained undis-torted while the others were disundis-torted. For example, the Archimedes number has been proposed as the scaling parameter for fully turbulent room flows in which air velocity distribution is mainly affected by thermal buoyancy and inertial force and viscous effects can be neglected.
Yao et al. (1986) studied airflow in a one-twelth-scale swine-growing bam with a realistic ventilation rate (which results in low turbulent flow). The similitude analysis also considered the effects of internal heat load (by simulated pigs) and obstructions (pens and simulated pigs). Continuing this work, Christianson et al. (1988) measured pig-level air velocities in a swine bam that has a similar pen arrange-ment as that in the one-twelfth-scale model. The results were that the prediction based on Archimedes number overestimated the velocity at the pig level by 3 times while the prediction based on the Reynolds number underestimat-ed it by 17 times. Therefore, Archimunderestimat-edes number was more critical than Reynolds number for predicting room air distribution.
Many similitude models of room airflow have used water (rather than air) as the working fluid in the model to simplify scaling in experiments. Anderson and Mehos (1988) used water as the working fluid in a one-fourth-scale test cell to evaluate indoor air pollutant control techniques by measuring the distribution of flow velocities and pollut-ants. ·The tests were designed based on the Reynolds number criterion and are limited to isothermal flows. Velocity measurements of a wall jet in the test cell were compared with previous full-scale measurements of a wall jet to confirm the accuracy of their scaling approach based on Reynolds number. However, there was no comparison between the velocities throughout the test cell with corre-sponding full-scale measurements.
130
·.
Most recently, Whittle and Clancy (1991) compared results from a diffuser Reynolds-number-based water model to full-scale room tests conducted in three different coun-tries. The water model underpredicted the average room air velocity by 30% and overpredicted the average room turbulence velocity scale (defined as the standard deviation of the velocity fluctuations) by 120%.
THEORETICAL DEVELOPMENT
The Studied Row Field
As a first attempt .to develop a scaling method for
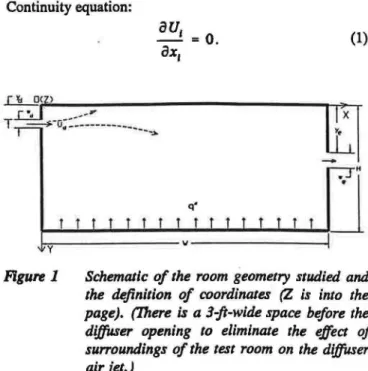
predicting nonisothermal ventilation flows, the studied flow field was limited to nyo-dimensional ventilation flows (Figure 1). A uniform heat flux from the floor was used as the internal heat load of the room.
The air movement in such an enclosure is mainly
affected by the diffuser air velocity (U,J, diffuser opening width (w,J and location (y,J, the amount of heat flux (q"),
as well as the building dimensions (W, H), and the location
of the exhaust(s) (y.). Other effects include the end walls, heat transfer due to conduction through walls, and heat
transfer by radiation. It is generally recognized that the
diffuser air jet and the thermal buoyancy are the two predominant factors.
Governing Equations
The distribution of mean air velocities (U1), temperature
(7), pressure (P), and turbulence stress in the studied flow field (Figure 1) are governed by the following equations with Cartesian tensor notation (assuming steady mean flow; incompressible, constant viscosity; and no internal
volumet-ric mass or volumetvolumet-ric heat production)2:
Continuity equation:
au,
- = 0 .ax,
(1)セセ」コセLMMMMMMMMMMMMMMMMMMMMMMMMMMMMMMセセMイ@
.
セML[MNZZZZZ@
________ ,
ltl
IIセセ}@
Figure 1 Schematic of the room geometry studied and
the definition of coordinates (Z is into the page). (!here
is
a 3-ft-wide space before the diffuser opening to eliminate the effect of surroundings of the test room on the diffuser air jet.)2 All aymbola are defined in the Nomenclature section.
(2)
Energy equation:
aT
fPT
a
-U1-
=
k - - + -(-uit).ax,
axi ax, axj
(3)Boundary conditions: specified at the diffusers, return
openings, surfaces of the floor, walls, ceiling, and internal ob-structions according to applica-tions.
The above equations can be nondimensionalized by
choosing the diffuser opening size (w.J, air velocity (U.J,
temperature (T.J, and pressure (P .J as reference quantities.
That is, let
..
(4) x1=
x, w<i,u,
=
U/ U4 , (5)u,
=
u.""
ud. (6) T;-T4=
9(7j-T4 ) , (7) t=
8(1j- T4 ), (8)P
=
P'"(P"'-P
4 ). (9) Further, we adopt the Boussinesq approximation (Kays and Crawford 1980) for thermal buoyant flow, which consists of the following two parts.(1) Air density is assumed to be constant except in the
thermal buoyancy term in the momentum equation (Equation 2);
(2) The thermal buoyancy term ( -pg) is approximated by
-pg = -pdg +(pd-p)
= -p4g+p4gf3(T-T4 ).
With these approximations, substituting Equations 4 through 9 into Equations 1 through 3, we obtain the following nondimensional governing equations:
Continuity equation:
aut
=
0.
(10)·.
Momentum equation:
uj au,·
=
-Pnap•
+ _1_fP
u,"
!lx •
!lx •
Red!lx • !lx •
u '} u I u '} u '} . (11)a
<
...->
1
+--.-u, "'
MaイL、・セLコKMコセエコᄋ@ 。セ@ セT@ Energy equation:u,•
ae
=
1 1
rPe
a <
-.-Pr Re • •+-.
-u,
6). (12)ax,·
4ax, ax,
ax,
The continuity equation (Equation 10) represents a mass balance within an air control volume. The momentum equation (Equation 11) states that the momentum transferred into an air control volume through convection is balanced by the presirure gradient, molecular viscous stress, turbu-lence stress, thermal buoyancy, and the gravity. The thermal buoyancy and gravity terms exist only in the
vertical direction (i.e., when i = 2). The energy equation
(Equation 12) states that energy transported into the air
control volume is balanced by the molecular diffusion and turbulence diffusion. The energy loss due to dissipation is neglected in the equation since it is insignificant in room ventilation flows. The above governing equations are the bases for the derivation of similarity parameters discussed
in the following section. ·
Similarity Parameters
The airflow fields in two geometrically similar rooms (i.e., a reduced-scale model and its prototype) are complete-ly similar to each other if they have the same distributions
of dimensionless velocity
(lf),
temperature (9), pressure(F),
and turbulence stress. This would require that the two flow fields have the same boundary conditions and samepressure number (Pn), Reynolds number (Re.J, Archimedes
number (Ar.J, Froude number (Fr.J, and Prandtl number (Pr) in the governing equations (Eqations 11 and 12). These numbers are called similarity parameters of the flow field and are discussed below.
· Pressure Nwnber: Pn It represents the ratio of
pres-sure to the double of the dynamic head. Similarity between the motion in a model and its prototype requires
H
pイ」ヲMセTQ@
=HpイエヲMセ、ャ@
(
13)P ud pud
.. p
where subscripts m and
p
denote model and prototype,respectively.
If P .. 1 is defined as the pressure outside the test room,
we then have, based on the Bernoulli equation,
1 2
Prcf-P
4 = lpU4 • (14)In this case, Pn = 1/2, which does not depend on the
room scale. In other words, Equation 13 is automatically
satisfied.
Reynolds Number: Re4 It represents the ratio of the inertial force to the viscous force. Similarity between the air motion within the model and its prototype requires
(15)
Assuming (11), = (11),, we have
(Ud),. (w")P 1
= =
-(Ud)p (wd),. ·
n
(16)where n is the geometric scale of the model relative to the
prototype.
For a reduced-scale model, n
<
1. Therefore, thediffuser air velocity in the model will be higher than in its prototype if one conducts model tests based on the diffuser Reynolds number.
Archimedes Number: Ar14 It represents the ratio of
inertial force to thermal buoyancy force. Similarity between the motions within the model and prototype requires
[
セXBGᄋPM
T,>
l .. [
pXwᄋセイ@
T,l
(17)Assuming
(7j -
T,J,. =(7j -
T,J,, (6),. = (6),, and(g),
=
(g),, we have(U"),. = [ (w
d),. ]1/Z ""
n
liZ (18)(Ud), Hキ・セIL@
Therefore, the diffuser air velocity in a reduced-scale
model (n
<
1) would be smaller than in the prototype ifone conducts model tests based on the Archimedes number.
Froude Number: Fr4 It represents the ratio of inertial
force to gravitational force. Similarity between the motion within the model and prototype requires
[ (8
::>•n
l.
= [H
X
セ[ QQ L}N@
(19)Since (g),
=
(g),, we have the same relation as Equation18.
Prandtl Number: Pr It represents the ratio of the
thermal diffusivity to momentum diffusivity (i.e., viscosity). Similarity of air motions within the model and its prototype requires
v
v
(-) = (-).
u"'
up (20)which can be satisfied by using the same working fluid in the model as in the prototype and maintaining the same
testing temperatures. ·
In addition to the above similarity parameters, similar
boundary conditions need to be maintained between a model and its prototype. This includes the equalities of the
dimensionless mean velocity
(U,j,
Reynolds stress(u,·u;),
temperature (9), turbulent thermal diffusion
(u,-8),
and132
pressure
(P)
between the model and its prototype at thediffuser, exhaust, and surfaces of walls, ceiling, and floor. These dimensionless parameters are affected by the diffuser
characteristics and surface roughness. ·
Difficulties in Scaling for Nonisothermal Room Ventilation Rows
An ideal scaling method would satisfy the complete similarity conditions as represented by Equations 13, 15,
17, 19, and 20 and maintain boundary conditions in the
model similar to its prototype. However, the restrictions on selecting a proper working fluid for the reduced-scale model room have made it difficult to satisfy the above complete similarity conditions (Moog 1981). Model studies are, therefore, usually conducted with some convenient fluids (e.g., air or water) in which the distortion of some
parame-ters is unavoidable. In this case, scaling methods are usually
derived so that the model can predict the overall room
airflow pattern and the distributions of air velocities and
temperatures within the regions in which one is most interested (e.g., the occupied regions).
In the present study, air was used as the working fluid for both the prototype tests and the reduced-scale model
tests. It is generally more convenient to maintain
(7j -
T,J,=
(7j -
T,J, so that the model and its prototype have the same air properties (Baturin 1972), i.e.'(p).,.
=
(p),, (v),=
(11),, (a), and ({J),.=
({J),.Therefore, the equality of the Prandtl number (Equation 20) is satisfied automatically. However, similarity for Reynolds, Archimedes, and Froude numbers results in contradictory scaling factors (Equation 16 versus Equation 18). That is, scaling based on the diffuser Reynolds number would result in higher diffuser air velocity in a reduced-scale model than in its prototype (Equation 16), but scaling based on the Archimedes number and Froude number would result in a lower one (Equation 18).
The 'diffuser Reynolds number describes the degree of turbulence generated by the diffuser jet. When the Reynolds · number is higher than a threshold, the jet flow becomes fully turbulent and no longer depends on the Reynolds number. In this case, the Archimedes number is the only similarity parameter that determines the trajectory of the diffuser jet. ·
However, the entire room flow field under realistic ventilation conditions is generally not fully turbulent even though the diffuser jet region is (Zhang et al. 1990). In this case, the air movement within the room · would still be dependent on the diffuser Reynolds number since the viscous effect cannot be neglected. Therefore, a proper scaling method for nonisothermal ventilation flow should account for both Archimedes number and Reynolds number similarities.
The Critical Archimedes Number
The critical Archimedes number is defined as the Archimedes number at which the diffuser air jet drops immediately after entering the room if one gradually increases the Archimedes number (either by decreasing the diffuser air velocity or by increasing the internal heat load). It was found that the critical Archimedes number decreased with the room size (Table 1).
That the critical Archimedes number decreases as the room dimensions decrease may be due to the decrease of the distance between the diffuser and the heat source-the floor surface in this case. Theoretically, the trajectory of the diffuser jet is directly affected by the temperature difference between the diffuser air and the room air around
the jet (aT,J instead of the temperature difference between
the diffuser air and the floor surface H。tセN@ For a given
aTfll, 。tイエセ@ is expected to be larger in a smaller room than in a larger room since the distance between the diffuser and the floor surface is smaller in the smaller room. Therefore, the jet would start to fall under a smaller Archimedes number .in a smaller room when the Archimedes number is defined by the temperature difference between the diffuser air and the floor surface as in the present study.
A New Scaling Method
It is generally recognized that the Archimedes number is a more important parameter for similitude model study of nonisothermal ventilation flows, since it determines the trajectory of the diffuser jet, which is a predominant factor in determining the overall airflow pattern within the room (e.g., Baturin 1972; Christianson et al. 1987). However, the Archimedes number in a reduced-scale model test cannot be the same as that in the prototype because the critical Archimedes number decreases when the room size decreases, as discussed in the last section.
It would be reasonable to assume that if the relative deviation from the critical Archimedes number in a re-duced-scale model test is the same as that in the prototype, a similar airflow pattern can be produced. In expression,
( Arfdt-Ar/dl = ( Arfdt-Ar/dl . (21)
Ar/dc ., Arfdc p ·
Therefore,
TABLE 1
Dimensions of the Test Rooms and the Critical Archimedes Number
H w w. Y• w, y,
(ft) (ft) (inch) (incll) (mch) (mch)
Full scale prototype 8 18 2 12 8 36
l/4th scale model 2 4.5 0.5 3 2 9
ASHRAE Transactions: Research
(22) AI.,. 0.0230 0.0127 i.e., (
セァキTHWゥM
Td)) 2 ..u4
(23) (Ar/dc)• ( セァキTHtiM Td)) (Arfdc>pu;
p Let(T, -
TJ,.
=
(T, -
TJP,
(/J),=
(JJ)p, (g),=
(g}p, 。ョセ@ (wJ, =n(wJP,
and we have (U ) = [ (Ar/dc)p ]lfl n lll (U ) . (24) d I l l (Ar ) d p 'fdc 111It is interesting to note that the value of the scaling
factor, [(Ar.fdc)/(Ar1d&),]1rzn•rz, in Equation 24 is between n1rz
and
lin,
the scaling factors derived from Archimedes number similarity (Equation 17) and Reynolds number similarity (Equation 15), respectively. Therefore, the new scaling equation (Equation 24) appears to be a compromise between the Archimedes number similarity and the Reyn-olds number similarity.Equation 24 is an equation for determining the diffuser
velocity to be used in a reduced-scale model test. For a
given room air velocity (UJ measured at a given location or region in a reduced-scale model, the velocity at the corresponding location or region in the full-scale prototype can then be predicted by
U = _1_ (Arfdc),. U . (25)
p n lfl (Arfdc)p Ill
EXPERIMENTAL EVALUATION
Experimental Facilities and Procedures
.
.
A room ventilation simulator (Wu et al. 1989; Zhang · 1991) was developed to study room air and air contaminant distribution under well-controlled environmental testing conditions. For the present study, three tests were conduct-ed in a full-scale room (Figure 1) and three tests were conducted in a one-fourth-scale test room (Figure 2). Test conditions are listed in Table 2, in which the diffuser air velocities in the one-fourth-scale room were determined based on Equation 24. The test rooms had a continuous slot diffuser opening and exhaust opening, resulting in two-dimensional room ventilation flows (Zhang 1991).
セi@
1 Ccnt;nuous slct diffuser 4 Ccntlnucus slct ・クィセオウエ@ 7 p・イヲ」イセエ・、@ ーャセエ・@
2 Prcbe traverse unit 5 Exhaust plenuro 8 Flexible comectcr
3 Test rcc" 6 new settling screens 9 Centrifugal hn
Test P4 (Prototype) PS (Prototype) P6 (Prototype) M4 (Model) MS (Model) M6 (Model) TABLE 2
Experimental Conditions for the One-Fourth-Scale Test Room'
u. T• .4.T11 Rc,. (ftlmin) ("F) ("P) 350 75.4 67.3 m5 3j() 73.9 47.9 5735 350 73.6 29.6 5735 235 73.9 67.5 963 235 73.3 -48.2 963 235 73.0 30.2 963 Ar., 0.0186 0.0135 0.0085 0.0104 0.0076 0.0048 • Sampling period and sampling l2le were 16.384 seconds and 250Hz, respectively.
The velocities and temperatures within the room were measured with a hot wire probe and a thermocouple probe, respectively. A microcomputer-based data acquisition and probe positioning system was developed to collect the data and move the probes automatically (Zhang et al. 1991). Additionally, the temperatures at the diffuser, exhaust of the test rooms, and the floor surface were monitored by a separate data logger with thermocouple probes. Room airflow patterns were visualized with titanium tetrachloride (TiCI4) smoke, which is neutrally thermally buoyant. A
more detailed description of the experimental facilities and their performance can be found in Zhang (1991).
Test Results
Flow
Patterns
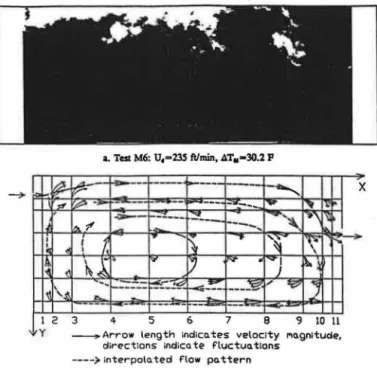
The flow patterns observed in the one-fourth-scale model tests (Figure 3) were similar to those observed in the prototype tests (Figures 4, 5, and 6,respectively) except that the secondary eddy at the upper right comer in the prototype test, A,., was not clearly revealed by smoke in the one-fourth-scale test A,..
Mean Velocity The dimensionless mean velocities measured in the one-fourth-scale model tests agreed well with those measured in the corresponding full-scale proto-' type tests (Figure 7)3 except the large differences present in
the diffuser jet region. The difference between the model and its prototype in the jet region was expected since the diffuser Reynolds number was distorted in the one-fourth-scale model tests. Figure 8 compares the mean velocities in
the occupied regions between the model and its prototype.
Figure 3 1. Slot diffuser 2. tセウエ@ roo" J. Prolors 4. Sere• bar 5. Stt>p ,otor 6 . Sere• bar 7. Slot ᆪセIHィッNオウエ@ 8. Exhaust plenu" 9. Volune control dai""Per
10. Screli'nS lt. Pr•ssure tap
12. F"h!!xibhr connector 13. Centrifugal ro.n
14. ran support
Experimental setup for the onefourth-scale tests.
'Comparison of spatial distributions is presented here only for one pair (M4 vs. P4) of the tests due to page limit. Others can be found in Zhang (1991).
134
·.
L Test M4: u.-235 ftlmill, AT.,-67.5 F
セセ@
セ@-·--·-·--
-
r---..,
セ@セセB@
X i セ@ ' 't 1->-------
イMセ@ ....- セ N セ@ ... .1. v"' -'
セ|
|セ@
('3" I\
\ >-. ... I セ@ I I 1I
r
セ@セセ@
I I4..-/
I)1
セ@セセ@
1' ...__ 7
i?11
セMM
セ@ iセ@ . セ@---
---1--- -
-·---
セ@ I 2 3 4 5 6 7 8 9 10 11y _ , . . Arrow len th indicates velocity Magnitude, g
directions indicate f"luctua tions ____ ,.. interpolo. ted Flow po. ttern
b. Test P4: u.=350 ftlmin, AT,.•67.3 F
Figure 4 Comparison of flow patterns between tests M4 and P4.
a.
Test M4: Uti=
235 fpm, セtヲエャ@=
67.5°F b. Test P4: Uti = 350 fpm, セtヲエャ@ = 67.JOFvb-セ@ (
'
I I"
セセ@
I 2 y Figure 5L Tat MS: U•=235 ftlmill, .4.T,.=48.2 F
セM Mセ@
----
!-.,. Mセ@ セ@v-
...
....
.... NNLNNセ@ iセ@ iセ セ@1:1
IV...
----
.... v li"セ@
I VO l'\I(
r> JYfr
li
Lセ|Q@ セMNLNL@ "'IIiJ
f
セiャャ@,"'
""'
cL""' セ@\
セセ@
!d
-..--
セMNセ@ MMセ@ Mセ@ セMM...
p:;:-3 4 5 6 7 8 9 10 11 M i- A r r o w length Indica. tes veloc.ty agn tude, directions indicate f"luctua tions
MMMMセ@ interpolo. ted Flow pattern b. Test P5: u.-350 ftlmin, 4T.,=47.9 F
X
セ@
Comparison of flow patterns between tests M5 and P5.
ASH RAE Transactions: Research
a. Test M6: U,-235 ftlmin, .O.T.-30.2 P
セ@
-p
-"'
X -6 セMM MセM-
----
セMセ@ r-- セ@ [>:: ' セM='
{GゥM|Qセ@ セM GMNNN セ@...
----
....セ@
It.
)
セ@ Lセセ@ ゥGセ@ 1 ' -I \セ@
セNセ@
セ@v
セ@ セQ@ セセ@ ll B|セ@ _A. セM-==--=
セセ@ セMセ@ MMセ ᄋBG@ セ@1
----
--
---
-
-I 2 3 4 5 6 7 8 9 10 11y セ@ Arrow ten th indica. tes vetoclt 9 Y 1'10. 9 nit ude, dirl'ctions indica. tl' f'tuctuo. t lons
----). intl'rpoto. tl'd flow po. ttern
Figure 6
b. Test P6: U,-350 ftlmin, 4T10-29.6F
Comparison of flow patterns between tests M6 and P6.
a. Test M6: Ud = 235 fpm, ATrd
=
30.2°F b. Test P6: Ud = 350/pm, AT"= 29.6°FOn average, the differences were 15%, 4%, and 14% for tests M4/P4, MSIPS, and M6/P6, respectively.
Turbulence Intensity The turbulence intensities in the one-fourth-scale model tests were at the same levels as in the prototypes, but differences exist, especially in the diffuser jet regions (Figure 9). Figure 10 compares the model with the prototype for the occupied regions. On average, the differences between the models and prototypes were 8%, 25%, and 8% for tests M4/P4, MS/PS, and
M6/P6, respectively.
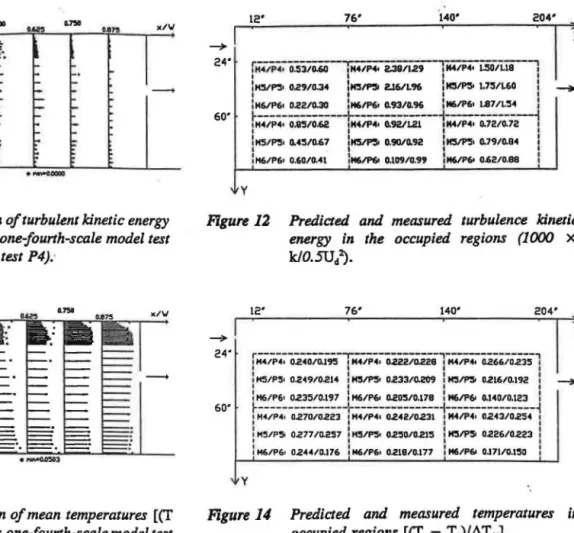
Turbulent Kinetic Energy The distributions of turbulent kinetic energy were also in general agreement with the prototype tests (Figure 11). Figure 12 shows the comparison for the occupied regions. On average, the differences between the models and the prototypes were 30%, 13%, and 36% for tests M4/P4, MSIPS, and M6/P6,
respectively.
Mean Temperature Large differences(> SO%) were present between the model and prototype tests in terms of mean temperature in the regions close to the ceiling and the floor (Figure 13). Scaling based on the method in the present study did not ensure the similarity of temperature at interfaces of the room air and the heated floor surface since air
was
used as the medium in the model (Baturin 1972). Therefore, the model was not appropriate for predicting temperatures in these regions. Figure 14 compares the model with the prototype for the occupied region excludingASH RAE Transactions: Research
x/IJ
Figure 7
Spatial distribution of mean velocities (---: one-fourth-scale model test M4, X: prototype test P4). --7 24' 60. 12' 76' 140' 204' Xr---
oH./P4 o 0.072/0.06'.1 i M4/P4o 0.12:5/0.103---,---,
I M4/P4• 0.10'!1/0.085 I I I I : 1MS/P:5> 0.071/0.070 I M:5/P:5o 0.122/0.126 I MS/PSo 0.121/0.128 I-セhVOpVッ@
o.OBI/0.070 H6/P6• 0.09'.1/D.O'il'il!
M61P6o 0.141/0.11'.1!
エ[N[[[
セセセセ[[[[ッMWW@
Z Bセ[[[LMッNセセ
MエセWL[[
LMッ NセQ@
!HS/P'5• 0.092/0.081 IHS/P:5o O.O'J8/D.O'iJB
I
MS/PSo 0.0'90/0.098I
!H6/P6• 0.100/0.080 IM6/P6o O.U'J/0.111 lM6tH6o 0.097/0.113 :y
Figure 8
Predicted and measured mean velocities in the occupied regions (U/UJ.x/IJ
Figure
9 Spatial distribution of turbulence intensities(JOOu'/U) (---: one-fourth-scale model test
M4, X: prototype test P4).
._.
24. 60. 12. 76' 140' 204. X イ[カ[[[セM・bNゥゥゥR NQ MtN ゥTQp[NM[V[ゥSRNG MャBTエ [[[NM[[LゥゥS。N N[M[@ ' I ' I M5/PSr 3'5.3/21.8 ; H5/P'5r 33.1/34.6 : M5/P5r .. 3.0/30.'9 : セ@ : I : : ih⦅VAセセセセセセセQNZNVMセセセセセZセセMMiセセセA]]MMMセ@セ hTOpTQ@
30.'!5/30.7 IH4/P4• 3L'!5/37.0 j M4/P4o 34.7/33.1 t I I It
i H'5/P'5• 38.6/2'il.l lMS/PS• 28.'.1/29.6 I M'5/PS• 34.3/30.8 : I I I t H6/P6• 22.4123.1 lM6/P6• 26.1/27.8 h16tP6o 23.6/25.8 : yFigure 10
Predicted and measured turbulence intensity in the occupied regions(%).02'50 1151111 PNセ@ x/IJ 0.81!1 OJ)O
---ᄋセ@ ----+ 0.50 0..,.. ylFigure
11 Spatial distribution of turbulent kinetic energyHォOPNUu、セ@ (---:one-fourth-scale model test M4, X: prototype test P4).·
x/IJ
Figure
13 Spatial distribution of mean temperatures [(T- T .JI セ@ T
rJ (---:
one-fourth-scale model test M4, X: prototype test P4).the points close to the floor surface (yiH
>
0.9271). The average differences between the models and prototypes were 12%, 11%, and 21% for tests M4/P4, MS/PS, and M6/P6, respectively.Discussion
In general, the model tests based on the proposed scaling method are in 'good agreement with their corre-. sponding prototype testscorre-. The models slightly overpredicted
mean air velocities but underpredicted the levels of turbu-lence intensity and turbulent kinetic energy.
The effectiveness of the model prediction varied with the temperatUre differences,
AT/d.
Therefore, one can also improve the model by exploring a different temperature difference (e.g., the temperature difference between the exhaust and diffuser air) as a reference for the critical Archimedes number to reduce such variation. Alternatively, a compensation coefficient may be investigated to account for the effect of the temperature difference Hセt⦅LNLIN@ Howev-er, more experiments are needed to determine the compen-sation coefficient.To extend the application of the proposed scaling method, further research is needed to determine the effects
136 12" 76' 140" 204' X --+ 24" 60"
イNキ ヲ^ セ[M o.:S3/G.60
IH4/P4<
2..38/129;wp.;-i:5Q,i.ii""""'l
I hUOセャ@ 0.29/0.34!
11'!1.,.,. 2.16/L 96 I H:l""' L7:5/L60 . -!H6/P6o 0.2i!lo.30 I1161P6o 0,93/0.96 I1161P6o 1.87/1.:54 IセLキーM[
ML@
o-."-/_0._
62_.,_1H4iP4.0:92/W"""IH4/P4• 0:72iiia!
i hsOセッ@
0.45/0.67iᄋ セ@
0.90/0.92 1115/P5• 0.79/0.84 II I I
I H6/P6o 0.60/0.41 I1161P6o 0.109/0.99 1 H6/P6o 0.62/0.88 l
y
Figure
12 Predicted and measured turbulence kinetic energy in the occupied regions (1000 X k/0.5U/). --+ 24" 60" y 12" 76' 140" 204" Xf H4/i>4; o.z40/o.195 1 H4/P4•
ouuo:228Tii:V;;-o:z66/D.23Sl
!
HS/PSoPNRセYOPNRQT@
!
hZjセッ@
02331D.209!
11'!1/PSo 021610.192セセ@
-I I t
I H6/P6o 0235/0.197 I H6/P6o 0,205/0.178 I 116/P6o 0.140/0.123
エ [[[ーMNセMッRM[[[[Nコ[[
エ [Tセセ[[[[[M
ャ NmipTNBゥゥZRTSOッNRUT
Q@
I H5/PSo 0.27710.257 I hsiセᄋ@ 0.25010.215 I H'!I/P5o 0226/0.223 1
I I I
: H6/P6o PNRセTOP N QWV@ : M6/P6o 0.218/0.177 : 116/P61 OJ71/0.150
Figure
14 Predicted and measured temperatures in occupied regions [(T - T.J/AT,.J.of room aspect ratio, diffuser location, and internal obstruc-tion on the critical Archimedes number and to develop a functional relationship between the critical Archimedes number and the room scale.
SUMMARY AND CONCLUSIONS
For nonisothermal ventilation flow, the critical Archi-medes .number at which the incoming air dropped immedi-ately after entering the room was found to decrease with the · room size. A new scaling method was proposed based on the equality of the relative deviation of Archimedes number from the critical Archimedes number between a reduced-scale model and its prototype. Comparison between the one-fourth-scale model tests based on the new scaling method and the prototype tests indicated the following:
1. Airflow patterns obseryed in the reduced-scale model based on the new scaling method were in good agree-ment with those observed in the prototypes. On aver-age, the mean velocity, temperature, turbulent kinetic energy, and turbulence intensity in the occupied regions were predicted within 11%, 15 %, 14 %, and 26%, respectively, of those measured in the prototype.
2. The proposed scaling method inay be improved by multiplying a compensation coefficient i.n extrapolating the model data, which accounts for the temperature difference between the heated surface and the incoming air. However, more experiments are needed to deter-mine the compensation coefficient.
Further research is needed to determine the effects of the room aspect ratio, · diffuser location, and internal obstruction on the critical Archimedes number and to develop a functional relationship between the critical Archimedes number and the room scale.
ACKNOWLEDGMENT
This study was sponsored by the United States National Science Foundation and the University of Illinois Campus Research Board. The authors are very grateful for their financial support. NOMENCLATURE Variables g p p" Pn Pr P,q Re T, t
1j
.Ardlim:des JliJO"hr, OOfiB:d
as
13 g w \セ@ (1j -
t\セI@u;
= Froude number, defined as Uj(gw,J1
fl,
which represents the ratio of gravitational
effect to inertial effect
= gravitational acceleration rate, fpm2
(mls)2
= room height, ft (m)
= turbulent kinetic energy, fpm2 (mls)2
= length of the room (in Z direction), ft (m)
= length of the diffuser slot (in Z direction),
ft (m)
= thermodynamic pressure, psi (Pa)
dimensionless pressure (ratio between the
pressure at a point and P 11)
= diffuser pressure, psi (Pa)
pd
= pressure number, defined as
pu;
Prandtl number, defined as p/a
= a reference pressure (e.g., the pressure
outside the test room, psi (Pa)
Uw
= Reynolds number, defined as セ@
"
= mean temperature and fluctuation
compo-nent, op (0C)
= maximum temperature in room (e.g., on
the heated surface), °F (DC)
= diffuser air temperature, op
eq
= air temperature at the exhaust, op (0
C)
=
1j _
T, op (oC) =T. - Td,
op (oC)u,
uw
w.
セN@ y,z
y.
ae.
o
p p Subscripts =1j -
Ttl, opC'C)
=
temperature difference between thedif-fuser air and the room air, op
eq
= mean air velocity and fluctuation
compo-nent, fpm (mls)
= standard deviation of velocity, fpm (mls)
= dimensionless mean air velocity and fluctuation component
= reference velocity, diffuser velocity at the
measurement plane (z = 0), fpm (m/s)
= width of the test room (in X direction), ft
(m)
= width of the diffuser slot (in Y direction),
ft (m)
= slot width of the exhaust, ft (m)
= Eulerian Cartesian coordinates with the
origin at the upper left comer of the
two-dimensional room flow (Figure 1), ft (m)
= distance from the ceiling to the diffuser
upper edge, ft (m)
= distance from the ceiling to the upper
"edge of the exhaust, ft (m)
= thermal diffusion coefficient, ft2/min
(m2/s)
= thermal expansion coefficient, 1/R (1/K)
= Kronecker delta(= 1 only .when i = 2
and = 0 otherwise)
= dimensionless mean temperature differ-ence and fluctuation component
= kinematic viscosity, ft2/min (m2/s)
= air density, lbm/ftl HォァOュセ@
i, j = indices representing direction of
coordi-nates (i,j = 1, 2, 3, referring to
longitu-dinal, vertical, and lateral coordinates)
m = denote model
p = denote prototype
REFERENCES
Anderson, R., and M. Mehos. 1988. Evaluation of indoor air pollutant control techniques using scale experiments.
IAQ 88, Engineering solutions to indoor air problems,
pp. 193-208. Atlanta: American Society of Heating, Refrigerating and Air-Conditioning Engineers, Inc. Baturin, V. V. 1972. Fundamentals of industrial ventilation,
3d ed. Oxford: Pergamon Press.
Christianson, L.L. 1989. Building systems: Room air and
air contaminant distribution. Atlanta: American Society of Heating, Refrigerating and Air-Conditioning Engi-neers, Inc.
Christianson, L.L., G.L. Riskowski, J.S. Zhang, and R.
Koca. 1988. Predicting air velocity at the pig level.
In
Proceedings of the Third International Livestock Environment Symposium, Toronto, Canada.
Int-Hout, D. 1989. Physical modeling. In Building Systems:
Room Air and Air Contaminant Distribution, ed. L.L.
Christianson, pp. 22-23. Atlanta: American Society of Heating, Refrigerating and Air-Conditioning Engineers, Inc.
Kays, W.M., and M.E. Crawford. 1980. Convective heat
and mass transfer. New York: McGraw-Hill.
Moog, W. 1981. Roo'm flow tests in a reduced-scale.
ASHRAE Transactions 87(4): 1162-1181.
Pattie, D.R., and W.R. Mil.ne. 1966. Ventilation airflow patterns by use of models. Trt1;nsactions of ASAE 9(5): 646-649.
Timmons, M.B. 1984. Use of physical models to predict the fluid motion in slot-ventilated livestock structures.
Transactions of ASAE 27(2): 502-507.
Whittle, G.E., and E.M. Clancy. 1991. Evaluation of cases B, D, E: Presentation of results from measurements and simulation of test cases B, D, and E. Research
138
Item No. 1.22, Report D, Arup Research and
Develop-ment, London,
UK.
Wu, G.J.', L.L. Christianson, J.S. Zhang, and G.L. Ris-kowski. 1990. Adjustable room ventilation simulator for room air and air contaminant distribution model-ling. In Indoor Air '90, Proc. 5th International
Confer-ence on Indoor Air Quality and Climate 4: 237-242.
Yao, W.Z., L.L. Christianson, and A.J. Muehling. 1986.
Air movement in neutral . pressure swine
build-ings---:Similitude theory and test results. ASAE Paper No. 86-4532, St. Joseph, MI.
Zhang, J.S. 1991. A fundamental study of two dimensional 'room ventilation flows under isothermal and non-isothermal conditions. Ph.D. thesis, University of Illinois at Urbana-Champaigti.
Zhang, J.S., L.L. Christianson, and G.L. Riskowski. 1990. Regional airflow characteristics in a mechanically ventilated room under non-isothermal conditions.
ASHRAE Transactions 95(2).