HAL Id: halshs-00552206
https://halshs.archives-ouvertes.fr/halshs-00552206
Preprint submitted on 5 Jan 2011
HAL is a multi-disciplinary open access archive for the deposit and dissemination of sci-entific research documents, whether they are pub-lished or not. The documents may come from teaching and research institutions in France or
L’archive ouverte pluridisciplinaire HAL, est destinée au dépôt et à la diffusion de documents scientifiques de niveau recherche, publiés ou non, émanant des établissements d’enseignement et de recherche français ou étrangers, des laboratoires
IMF programs and tax effort What role for institutions
in Africa?
Jean-François Brun, Gérard Chambas, Bertrand Laporte
To cite this version:
Jean-François Brun, Gérard Chambas, Bertrand Laporte. IMF programs and tax effort What role for institutions in Africa?. 2011. �halshs-00552206�
CERDI, Etudes et Documents, E 2010.33
Document de travail de la série Etudes et Documents
E 2010.33
IMF programs and tax effort
What role for institutions in Africa?
Jean François Brun*, Gérard Chambas**, Bertrand Laporte*
December 2010
We thank the Agence Nationale pour la recherche (ANR) for financial support. * Associate Professor, CERDI-Université d’Auvergne
** Chargé de Recherches CNRS-CERDI-Université d’Auvergne
Summary
When compared to other developing countries, most Sub-Saharan African countries are characterized by a disappointing level of development. Among the factors explaining this poor performance, the inadequate supply of public goods is often advocated. This inadequate supply is due either to poor efficiency of public expenditure, or to an insufficient tax effort. This paper is focused on this last factor.
One of the reasons for the low level of public revenues could be the weak impact of the IMF programs on the tax effort. In the agreements that developing countries reach with the IMF, they commit to reduce their macro-economic imbalances, notably fiscal deficit, to a sustainable level. The measures necessary to achieve the overall budgetary objectives apply mainly to public expenditures as they are easy to reduce in the short term. However, the hypothesis of a positive effect of IMF programs must be considered: one objective of the African governments could be to maintain public expenditures at their previous level. To this end, African governments could choose to mobilize additional public revenues. Thus, most of IMF programs promote tax reforms leading to a more effective policy of public revenue mobilization.
This last scenario of an increase of the level of public revenue is corroborated by the econometric analysis. The level of public revenue depends, among other factors, on the quality of institutions. However, the institutional quality of custom and tax administrations is weaker in Africa than elsewhere. This poor quality reduces the efficiency of IMF programs which may have a lower impact on the level of public revenue in African countries.
These results point up two main lessons for the IMF (and more generally for lenders) and for recipient countries: 1) The role of technical assistance associated with the IMF programs is crucial, since it enables capacity reinforcement of the technical administrations in charge of the definition and implementation of the reform; 2) The technical assistance for tax and custom administrations must be strengthened for those countries which initially have a poor quality of bureaucracy.
Introduction
In comparison with other developing countries, most sub-Saharan African countries are characterized by a disappointing level of development: in many African countries the economic growth achieved during recent decades is often insufficient to avoid a fall in real income per capita, and the main social indicators of development show an unfavorable trend. Among the factors explaining this poor performance, the inadequate supply of public goods is often advocated (education, health, public infrastructures). This inadequate supply is due either to poor efficiency of public expenditure (World Bank 2004), or to insufficient public revenues level. This paper is focused on this last factor. One of the reasons for the low level of public revenues could be the weak impact of the IMF programs on the tax effort. In the agreements that developing countries reach with the IMF, they commit to reduce their macro-economic imbalances, notably fiscal deficit, to a sustainable level. The measures necessary to achieve the overall budgetary objectives apply mainly to public expenditures as they are easy to reduce in the short term. However, the hypothesis of a positive effect of IMF programs must be considered: one objective of the African governments could be to maintain public expenditures at their previous level. To this end, African governments could choose to collect additional public revenues. Thus, most of IMF programs promote tax reforms leading to a more effective policy of public revenue mobilization.
Paradoxically, despite numerous controversial debates about the effects of IMF programs and, in spite of the role of public revenue mobilization policy on the supply of public goods, there is little evidence regarding the effects of IMF programs on tax effort. So the objective of this article is to given some insights about the impact of IMF programs on public revenue mobilization in developing countries and more precisely in African countries.
1 Tax effort in African countries
The concept of tax effort
The indicator of tax effort used here is the ratio of global public revenue as a share of GDP (Gross Domestic Product). This ratio measures the resources collected by the government in comparison with those produced domestically. This concept of tax effort is to be understood in a wide sense because it covers both tax and non-tax revenues (including dividends from public companies, taxation through stabilization funds). The local resources1 and the social security contributions are also included.
1 Revenues of decentralized local authorities, though of growing size, is often, either not fully recorded, or
This definition of global tax effort is preferred to the one often used, which is limited only to tax revenue (Stotsky and WoldeMariam, 1997, Piancastelli, 2001), because the global indicator used here is not sensitive to possible substitutions between the main categories of public revenues, substitutions which have sometimes2 involved large amounts.
The evolution of tax effort in African countries
In order to compare African countries to other developing countries, the observations concern a large sample of developing countries over the period 1980 to 2007. The sample includes almost all African countries. Several countries groups are distinguished using various criteria:
- The level of development is caught by the GDP per capita. Thus, African countries with low income are distinguished from those with intermediate income. In the same way, the least developed African countries are distinguished from other African countries.
- Countries in the CFA Franc Zone and African countries outside the CFA Zone. Membership of the CFA zone imposes restrictive rules concerning the monetary financing of budget deficits. These rules certainly have an impact on the level of fiscal deficit, on the possible accumulation of public arrears and finally on public revenues (Adam et al. 2001).
- Mobilization of public revenues may differ according to geographical zones. Also the average ratios are calculated for Asia, Latin America, Sub-Saharan Africa, Middle East/North Africa.
2
2 So in the past, for many African countries (Ivory Coast, Madagascar…) the substitution of export taxes and profit taxes to non tax revenues of stabilization funds has resulted in increase in tax revenues even though the total revenues remain unchanged.
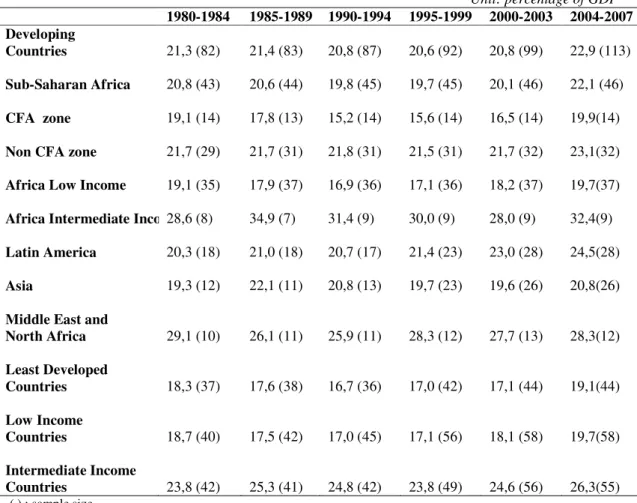
Table 1. Total public revenues of developing countries Unit: percentage of GDP 1980-1984 1985-1989 1990-1994 1995-1999 2000-2003 2004-2007 Developing Countries 21,3 (82) 21,4 (83) 20,8 (87) 20,6 (92) 20,8 (99) 22,9 (113) Sub-Saharan Africa 20,8 (43) 20,6 (44) 19,8 (45) 19,7 (45) 20,1 (46) 22,1 (46) CFA zone 19,1 (14) 17,8 (13) 15,2 (14) 15,6 (14) 16,5 (14) 19,9(14)
Non CFA zone 21,7 (29) 21,7 (31) 21,8 (31) 21,5 (31) 21,7 (32) 23,1(32)
Africa Low Income 19,1 (35) 17,9 (37) 16,9 (36) 17,1 (36) 18,2 (37) 19,7(37)
Africa Intermediate Income28,6 (8) 34,9 (7) 31,4 (9) 30,0 (9) 28,0 (9) 32,4(9)
Latin America 20,3 (18) 21,0 (18) 20,7 (17) 21,4 (23) 23,0 (28) 24,5(28)
Asia 19,3 (12) 22,1 (11) 20,8 (13) 19,7 (23) 19,6 (26) 20,8(26)
Middle East and
North Africa 29,1 (10) 26,1 (11) 25,9 (11) 28,3 (12) 27,7 (13) 28,3(12) Least Developed Countries 18,3 (37) 17,6 (38) 16,7 (36) 17,0 (42) 17,1 (44) 19,1(44) Low Income Countries 18,7 (40) 17,5 (42) 17,0 (45) 17,1 (56) 18,1 (58) 19,7(58) Intermediate Income Countries 23,8 (42) 25,3 (41) 24,8 (42) 23,8 (49) 24,6 (56) 26,3(55) (.) : sample size.
The date presented are are unweighted arithmetic averages calculated over five years periods (1980-1984, 1985-1989, 1990-1994, 1995-1999) and four years periods (2000-2003) and (2004-2007).
Sources: GFS (International Monetary Fund), national authorities; authors’ calculation.
The average ratios of tax effort in Sub-Saharan African Countries have remained unchanged since the beginning of the 1980s, and are rather similar to the average ratios in Latin America or Asia.
Inside the Sub-Saharan African countries, the ratios of public revenue to GDP of non-Least Developed Countries are higher than those of non-Least Developed Countries (LDC). In the same way, the average ratio of public revenue to GDP of intermediate income countries is above the average ratio of low income countries. It can be observed that the average ratio of public revenue in the African LDCs (or low incomes countries) decreased at the end of the 1980s and during the 1990s. For the CFA countries the average ratio of public revenues, initially similar to the one of African countries outside the CFA zone, became significantly lower, particularly during the period 1996-98. The increase of public revenue during the period 2000-02 is mainly exogenous and due to the increase in oil prices (Chambas et al. 2005).
2. Explaining tax effort
Determinants of tax effort: a short survey of the literature
For a representative country, the tax effort is explained by a combination of structural factors and by economic policy decisions.
From the available literature3, four categories of factors explaining tax effort can be distinguished.
1. Economic structural determinants: income per capita, imports as a percentage of GDP, agricultural value added as a share of GDP, and the share of oil and ores exports in total exports. A main factor of the level of public revenue is the level of income per capita, in so far as the increase in the standard of living leads to an increase and a diversification of the demand for public goods such as education, health, public infrastructures, … The structure of the economy also determines the level of public revenue in so far as certain activities can be easily taxed (mining and oil sectors4, international trade5), while others are more difficult to tax (the agricultural sector, in particular the food crop sector). (see for example Bahl, 2003; Alm et al., 2004; Teera, 2002).
2. Macroeconomic policy variables: debt service as a percentage of GDP, inflation rate and real effective exchange rate. The public debt burden is an
3 A survey of the main available articles (Bahl, 1971; Leuthold, 1991; Tanzi, 1992; Stotsky and
Woldemariam, 1997; Piancastelli, 2001; Bahl, 2003; Teera, 2002; Alm et al.; 2004) was done by Bird et al 2006.
4
A large update of the data was done and covered public revenues, ores exports and oil exports. The database for ores and oil exports supplied by UNCTAD was checked with information obtained on the website of the US Geological Survey. The data, which were implausible for certain countries (on the one hand, oil and/or ores producing countries for which the share of oil and/or ores in their total exports was very low and on the other hand countries not identified as oil and/or ores producers for which the share was very high). For these countries a correction of the data was done using the statistical annexes of the “country” reports of the IMF (IMF Country Reports).
5 The ratio of public revenue is positively influenced by trade openness, because trade constitutes a base
which is easier to tax than domestic incomes or transactions ((Bahl, 2003; Ghura, 1998, Stotsky and WoldeMariam, 1997). It is underlined that despite the liberalization policies, trade and more particularly imports always constitute an opportunity for substantial taxation. Indeed the tariff revenues dependent on imports fall strongly, above all since the end of 1990s and this for all groups of developing countries whatever their geographic location (Chambas et al. 2005; Baunsgaard and Keen, 2005). But imports always constitute an essential base for indirect taxes: in a large number of countries excise taxes (tobacco, alcohol and fuel oils) are often mainly collected at the border. A large relative amount of VAT is also collected at the border. The positive effect of openness on public revenues is certainly reinforced for countries with a large share of mining and oil products in their exports (Chelliah et al 1975), as these categories of exportations through royalties can give substantial amounts of public revenues.
important factor of tax effort since government is it encouraged to strengthen the public revenue in order to keep unchanged the level of primary expenditure (Tanzi 1992)6. The willingness to increase public expenditure, and hence revenue, can equally result from the implementation of structural reforms, from the aim to increase public investments (Heller 1975), or from an increased supply of basic public goods such as education and health (Ghura1998). Moreover, high inflation weakens the efficiency of tax collection (Tanzi 1978), even though a real depreciation of the exchange rate reinforces public revenues by boosting the easiest sector to tax (tradable goods sector).
3. Institutional variables: corruption, quality of bureaucracy and democratic accountability. The institutions which directly determine and manage the collection of public revenue are the tax administration and the custom administration. Lately, special attention has been paid to the effects of corruption (Shleifer and Vishny, 1993, Hindriks, Keen and Muthoo, 1999), but the efficiency of the administrative organization is equally crucial (Bird and Casanegra de Jantscher, 1992; Alm et al., 1995). Beyond the tax and customs administrations, the institutional quality of the public sector as a whole determines the quality of the supply of public goods, and so reduces the social cost of taxation by strengthening the tax compliance. (Alesina, 1999; Tanzi and Davoodi, 1997).
4. Aid variables: ODA and instability of ODA. The flow of ODA affects the public revenue level since it constitutes a substitute form of financing. (Gupta, 2003; Ouattara, 2006). The grants do not affect the financial solvency of recipient countries as they do not lead to future repayment charges and hence involve no additional taxes to levy. The grants are higher in countries with the lowest income per capita, thus grants may discourage the public revenue mobilization in recipient countries. On reverse, loans imply future repayment charges and are thus likely to encourage a larger tax effort.
Hypotheses regarding the effect of IMF programs on tax effort
The hypotheses which can be made as to the effect of IMF programs on tax effort are contradictory.
Hypothesis of a negative effect of IMF programs tax effort. Firstly one could think, following some critics of IMF programs, of a negative effect similar to the ones highlighted by various studies dealing with the impact of foreign aid.
6
The incentive to increase public revenue to ensure debt servicing has not been identified in a systematic manner in empirical studies; even though debt outstanding has a positive effect on the public revenue for Tanzi (1992) and Ouatarra (2006), it is not significant for Ghura (1998) even negative for Gupta et al (2003).
For IMF programs, the trade off made to achieve fiscal balance is mainly focused on public expenditure. Most countries benefiting from IMF programs do not put enough focus on strengthening public revenue level for two main reasons: 1) Mobilization of additional public revenues often requires large delays, and is, at the same time, difficult to implement politically and technically; 2) Concluding a program with the IMF, a condition to get additional financing from other lenders, doesn’t exclude that certain African countries rely on external financing rather than on increased public revenues. This effect would be even more likely for countries which have access to grants or to concessional loans. In this case, there are no incentives to mobilize additional public revenues to finance subsequent debt burden. The concessional foreign aid allow to bypass the potential effects of the “Ricardian Equivalence” Theorem, which concerns the loans obtained at market conditions, and which would imply the collection of additional public revenue in order to finance the debt burden.
Hypothesis of a positive effect of IMF programs tax effort. Important arguments are in favor of positive effects of IMF programs on tax effort. 1) Despite the easiness to cut public expenditure, governments may give a high priority to maintaining the level of public expenditure. This drives them to conclude programs with the IMF that include a section aiming at increasing the level of public revenue. This effect is all the more likely as since the 1990s, poverty alleviation programs are relying often on a Big Push strategy and therefore on a large public expenditure. 2) Programs with the IMF paved the way for tax reform and for improved tax administration; in that way, IMF programs should lead to a greater efficiency of public revenue mobilization.
Choosing one of these two hypotheses is the task of the following econometric analysis.
3. Data and estimation method
The equation which explains public revenue as a share of GDP is estimated using data derived from a large sample of countries over a long time period (data on a panel of 99 countries over the period 1984-2007).
The data
The data for public revenue are taken from CERDI’s database which is more comprehensive than available database such as Government Finance Statistics. The dataset was completed with data taken from IMF annual reports. Data concerning aid flows come from the DAC database of the OECD (www.oecd.org/cad/stats). Data concerning the quality of institutions are the indicators which permit the calculation of the synthetic indicator of ICRG (International Country Risk Guide). The fiscal data, other than revenue, come from the Government Finance Statistics database produced by the IMF, completed for African countries by the African database (World Bank), and the statistics of the OECD database for the countries which are members. This last database
allows in particular to take into account fiscal deficits and debt outstanding of the main donors which are used to answer the endogeneity problem.
The endogeneity problem
The endogeneity problem mainly concerns the “Aid” and “IMF program” variables. Actually there is a high risk that aid is endogenous if donor countries determine their aid amounts by reacting to public finance imbalances of recipient countries, in particular to a downfall of public revenue (simultaneity bias)7. Equally aid could be higher for countries with low level of public revenue. These countries may experience greater difficulty to collect public revenues. So, aid and public revenue are thus determined by a third variable left out of the model (omitted variable bias).
In the same way, IMF programs can also be endogenous, to the extent that the programs are agreed following public finance imbalances of the recipient countries.
To give a satisfactory answer to the endogeneity problem, it is necessary to use instrumental variables which are correlated with the level of aid and with the decision to implement an IMF program, and which, at the same time, are exogenous vis-à-vis public finance in the recipient countries.
The procedure adopts the approach initiated by Tavares (2003) for the endogeneity of aid. The procedure consists in building a variable measuring “aid potential” for each recipient country in 3 stages: 1) Selection for each year and each recipient of the 5 largest donors for this country8 among the 21 main DAC countries9; 2) Global aid from each of these donors (measured in constant dollars) is weighted by its proximity to the recipient country10. The proximity used here is either geographic proximity11, or cultural proximity (linguistic or religious12); 3) The variable for aid potential is obtained by aggregating the weighted aid flows.
7
It is also plausible that the institutional variables are endogenous in an equation explaining public revenue, which leads us also to instrument these variables to obtain robust results.
8 A dummy variable allows definition of whether the country forms part of the 5 main donors (coded 1) or
not.
9 Germany, Australia, Austria, Belgium, Canada, Denmark, Spain, Finland, France, Greece, Ireland, Italy,
Japan, Norway, New Zealand, The Netherlands, Portugal, United Kingdom, Sweden, Switzerland, USA.
10 The approach taken for the 5 main donors guarantees enough variability for the instrumental variables in
so far as the 5 main donors can, on the one hand, change from one recipient country to another and, on the other hand, for the same country change from one year to the next. We have also considered the 21 donor countries but then the variability of the instrumental variables is smaller.
11 Geographic proximity is measured as the inverse of the bilateral distance between the recipient country
and Washington (for Canada and USA), Brussels (for European countries), Tokyo (for Japan), and Canberra (for Australia and New Zealand). To take account of cultural proximity we utilized on the one hand, linguistic proximity across a dummy variable which indicates if the countries share a common official language (or a common administrative working language).
12 Religious proximity is measured as the degree of correlation (adjusted to be always positive) in the
However as indicated by Faini (2006), the level of aid granted by a donor depends on the situation of its public finances: a country with a sound situation is inclined to have a high level of ODA. To measure the fiscal stance of donor countries two indicators are used: the conventional deficit and the level of debt outstanding relative to GDP. As for the aid flows, these variables are weighted by geographic proximity for the 5 main donors to the recipient country.
Finally aid received by a country takes into account 5 instruments: 3 variables based on the global aid flows of the main donors and 2 variables based on the fiscal stance of these same donor countries. These instruments are calculated with either the 5 main donors or the 21 OECD countries.
These same instruments can be used to treat the problem of endogeneity of IMF programs: the main contributors to the IMF have a significant influence on IMF policies, notably through the programs contents. As previously stated, the main contributors to IMF resources are also the main providers of aid. The economic and fiscal situation of the main contributors to IMF and their proximity to developing countries are thus the factors which influence the decision of agreement to a program and can so be used as valuable instruments.
The instrumental equations show that the instrumental variables are pertinent13. They effectively permit to explain the amount of aid received and/or the conclusion of an IMF program by the countries after controlling for the exogenous variables in the equation of interest (equation which explains the ratio of public revenue to GDP). Hansen over-identification test are applied.
The construction of the instrumental variables uses aid flows, fiscal variables of donor countries (cf. below) and proximity variables between donors and recipient countries (geographic, linguistic and religious proximity). The distances between the recipient countries and the donors are taken from the CVS database, while the linguistic and religious variables are taken from La Portal et al. (1998)14.
4. Estimation of the effect of IMF programs on tax effort
The regressions were estimated with two stage least squares method. The regressions include fixed country effects and use White’s Correction for the standard errors.
13
These equations are available upon request.
14 The instruments used for the variables aid and IMF program are the same as for the variable
Control Variables
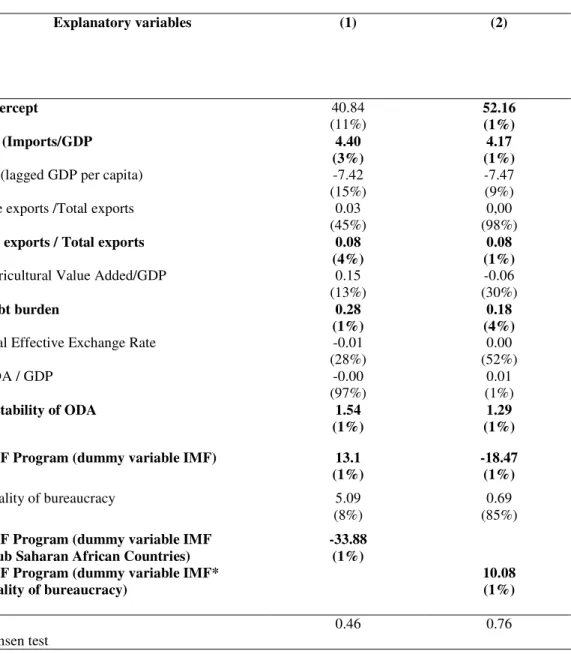
According to the theoretical hypotheses and previous studies, the ratio of public revenue to GDP increases positively with imports. On the opposite, the share of agricultural value added in GDP has a negative but non significant impact. The share of ores exports in total exports is not significant; this is also true for income per capita. On the other hand, oil exports are significant and positive.
The increase in debt burden implies higher public revenue. The other determinants are not significant, but the debt burden certainly captures the effects of budget and monetary policies. The instability of ODA affects positively the tax effort. Thus the instability of ODA encourages governments to a bigger tax effort in order to smoothen the impact of these fluctuations.
Interest variable: the impact of IMF programs
The variable of interest, IMF program, is captured through a dummy variable (IMF). If for the previous fiscal year, the country is under agreement with the IMF, the dummy takes the value “1” and the value “0” otherwise. Given the specific interest in sub-Sahara African countries, a dummy variable “AFRICA” is introduced; this variable takes the value “1” when the country is a sub-Saharan Africa country and “0” otherwise.
The results of the econometric analysis (table 2, equation 1) show a positive effect of IMF programs on the tax effort.
Firstly, the process of negotiation of IMF programs involves close cooperation between the technical administrations of the country and the IMF regarding the reform package. These administrations know perfectly the constraints for improving the public revenue level and for implementing structural reforms. Secondly, the IMF program is signed by political authorities (Minister of Finance, Prime Minister), who are very often concerned by the electoral calendar. Thus, political authorities are inclined to delay the implementation of the structural reforms. However, as an international institution, the IMF has a strong capacity to encourage governments to implement the reforms.
Table 2 The factors of the tax effort in developing countries. Explanatory variables (1) (2) Intercept 40.84 (11%) 52.16 (1%) Ln (Imports/GDP 4.40 (3%) 4.17 (1%)
Ln (lagged GDP per capita) -7.42
(15%)
-7.47 (9%)
Ore exports /Total exports 0.03
(45%)
0,00 (98%)
Oil exports / Total exports 0.08
(4%)
0.08 (1%)
Agricultural Value Added/GDP 0.15 (13%) -0.06 (30%) Debt burden 0.28 (1%) 0.18 (4%)
Real Effective Exchange Rate -0.01 (28%) 0.00 (52%) ODA / GDP -0.00 (97%) 0.01 (1%) Instability of ODA 1.54 (1%) 1.29 (1%)
IMF Program (dummy variable IMF) 13.1
(1%) -18.47 (1%) Quality of bureaucracy 5.09 (8%) 0.69 (85%)
IMF Program (dummy variable IMF *Sub Saharan African Countries)
-33.88 (1%) IMF Program (dummy variable IMF*
quality of bureaucracy)
10.08 (1%)
R2 0.46 0.76
Hansen test
On the reverse, IMF programs are less efficient in sub-Saharan Africa countries. The coefficient for the dummy multiplicative of the variable IMF program (IMF*Sub Saharan African Countries) cancels out the positive effect of the dummy variable IMF program. The explanation is largely based on institutional inefficiency. The efficiency of the tax and customs administrations in most African countries is relatively weak, and the lack of highly skilled staff constitutes a constraint which weakens the efficiency of cooperation between technical administrations and IMF. The implementation of IMF programs with poorer results is accompanied by lower efficiency in terms of public revenue mobilization. The multiplicative variable IMF Program*Administration quality is introduced (equation 2) and highlights the importance of the quality of administration as one of the main determinant for the success of IMF programs.
Conclusion
IMF programs have a positive impact on the public revenue mobilization for countries benefiting from such programs. The process of drawing up the program, which initially involves a tight cooperation between the technical administrations and the IMF, before the final negotiations with the political authorities, allows definition of a program focused on the structural tax reform. The capacity of the IMF to thereafter “impose” the program on the political authorities, makes the program non dependent of the electoral calendar and ensures its implementation and efficiency in terms of public revenue mobilization. The success of reforms, and more generally the efficiency of tax policy, depends largely on the quality of administrations in charge of their definition and implementation. The quality of administrations is weaker in Sub Saharan African countries than elsewhere. This low quality reduces the efficiency of programs, which have only a little impact on the improvement of the public revenue levels in Sub Saharan African countries.
These results point up two main lessons for the IMF (and more generally for lenders) and for recipient countries: 1) The role of technical assistance associated with the programs is crucial, since it enables capacity reinforcement of the technical administrations in charge of the definition and implementation of the reform; 2) The technical assistance for tax and custom administrations must be strengthened for those countries which initially have a poor quality of bureaucracy.
References
Adam C. S., Bevan D. L. and Chambas G., 2001, “Exchange Rate Regimes and Revenue Performance in Sub-Saharan Africa”, Journal of Development Economics, vol. 64, 173-213. Alesina, A., 1999, “Too Small and Too Large Governments”, in: Equity and Economic Policy, ed. By V. Tanzi, K-Y. Chu, and S. Gupta, Washington DC, IMF.
Alm, J., I. Sanchez and A. and De Juan, 1995; “Economic and Noneconomic Factors in Tax Compliance”; Kyklos. Vol.48, p. 3-18.
Alm J. and Martinez-Vasquez J. ed., 2004, Taxing the Hard-to-Tax. Lessons from Theory and
Practice, Elsevier.
Bahl R.W., 2003, “Reaching the hardest to tax: Consequences and possibilities”, paper presented at the Hard to Tax: An international Perspective conference, Andrew Young School of Policy Studies, Georgia State University, May.
Bahl R.W., 1971, “A Regression Approach to Tax Effort and Tax Ratio Analysis” Staff Papers,
IMF, vol. 18, pp. 570-612.
Baunsgaard T. and Keen M., 2005, “Tax Revenue and (or?) Trade Liberalization”, IMF Working
Paper WP/05/112.
Bird R. and M. Casanegra de Jantscher, 1992, Improving Tax Administration in Developing
Countries. IMF, Washington.
Bird R., Martinez-Vazquez J. and Torgler, B., 2006, “Societal Institutions and Tax Reform in Developing Countries”, in Alm J., Martinez-Vazquez J., Rider, M. (eds.), The Challenges of Tax
Reform in a Global Economy. Springer, United States of America, pp. 283-338.
Chambas et al., 2005, Afrique au sud du Sahara. Mobiliser des ressources fiscales pour le
développement, Economica, Paris.
Chelliah R. J., Baas J. and Kelly M. R., 1975, “Tax Ratios and Tax Effort in Developing Countries, 1969-71” IMF Staff Papers, 22, pp. 187-205.
Faini, R. 2006, Foreign Aid and Fiscal Policy, Development Studies Working Papers, Centro Studi Luca d’Agliano, Universtita di Roma Tor Vergata, n° 212, may.
FMI, 2006, Government Finance Statistics, Washington DC. FMI, IMF Country Report, several reports, Washington DC.
Ghura, D., 1998, “Tax Revenue in Sub-Saharan Africa: Effects of Economic Policies and Corruption” IMF Working Paper, No. 98/135, Washington DC: International Monetary Fund. Gupta, S., Clements, B., Pivovarsky, A. and Tiongson, E.R., 2003, “Foreign Aid and Revenue Response: Does the Composition of Aid Matter?”, IMF Working Paper, WP/03/176, IMF, Washington.
Leuthold J.,1991, “Tax Shares in Developing Economies : A Panel Study”, Journal of
Development Economics, Vol. 35, 1991.
Piancastelli M. 2001 “Measuring the Tax Effort of Developed and Developing Countries. Cross Country Panel Data Analysis 1985-1995”, Discussion Paper, IPEA, Rio de Janeiro, September. Heller, P.S., 1975, “A Model of Public Fiscal Behaviour in Developing Countries: Aid, Investment and Taxation”, American Economic Review, vol. 65 (3), p. 429-445.
Hindriks, J., M. Keen and A. Muthoo, 1999, “Corruption, Extortion and Evasion”, Journal of
Public Economics, vol.74, p.395-420.
La Porta, R., Lopez-de-Silanes, F., Shleifer, A., and R. Vishny, 1998, “The Quality of Government”, NBER Working Paper, n° 6727, September.
Ouattara, B., 2006, “Foreign Aid and Government Fiscal Behaviour in Developing Countries: Panel data Evidence”, Economic Modelling, vol. 23(3), pages 506-514, May.
PRS Group, 2006, International Country Risk Guide (ICRG).
Shleifer and Vishny, 1993, Corruption, Quarterly Journal of Economics, vol. 108, August, p.599-617.
Stotsky, J., and A. WoldeMariam, 1997, “Tax Effort in Sub-Saharan Africa”, IMF Working
Paper, n°. 97/107, Washington DC: International Monetary Fund.
Tanzi, V., 1992, “Structural Factors and Tax Revenue in Developing Countries: A Decade of Evidence”, in I. Goldin and A. Winters (eds.), Open Economies: Structural Adjustment and
Agriculture, Cambridge: Cambridge University Press, p. 267-81.
Tanzi, V., and H. R. Davoodi, 1997, “Corruption, Growth, and Public Finances”, IMF Working
Paper, n°182, November.
Tavares, J. 2003, “Does Foreign Aid Corrupt”, Economic Letters, vol.79, April, p.99-106.
Teera, J, 2002, “Tax performance: A comparative Study, Working paper 01-02, Centre for Public Economics, University of Bath.