HAL Id: halshs-01960338
https://halshs.archives-ouvertes.fr/halshs-01960338
Submitted on 10 Jan 2019HAL is a multi-disciplinary open access archive for the deposit and dissemination of sci-entific research documents, whether they are pub-lished or not. The documents may come from teaching and research institutions in France or abroad, or from public or private research centers.
L’archive ouverte pluridisciplinaire HAL, est destinée au dépôt et à la diffusion de documents scientifiques de niveau recherche, publiés ou non, émanant des établissements d’enseignement et de recherche français ou étrangers, des laboratoires publics ou privés.
Ownership and Hospital Productivity
Brigitte Dormont, Carine Milcent
To cite this version:
Brigitte Dormont, Carine Milcent. Ownership and Hospital Productivity. Brigitte Dormont; Carine Milcent. Competition between Hospitals: Does it Affect Quality of Care ?, Editions rue d’Ulm, 2018. �halshs-01960338�
Ownership and hospital productivity
∗ Brigitte Dormont†, and Carine Milcent‡July 15, 2014
Abstract
There is ongoing debate about the e§ect of ownership on hospital performance as regards e¢ciency and care quality. This paper proposes an analysis of the di§erences in productivity and e¢ciency between French public and private hospitals. In France, public and private hospitals do not only di§er in their objectives. They are also sub-ject to di§erent rules as regards investments and human resources management. In addition, they were financed according to di§erent payment schemes until 2004: a global budget system was used for public hospitals, while private hospitals were paid on a fee-for-service basis. Since 2004, a prospective payment system (PPS) with fixed payment per stay in a given DRG is gradually introduced for both private and public hospitals. Payments generally di§er for the same DRG, depending on whether the stay occurred in a private or public hospital. By 2018, a convergence of payments between
∗We are grateful for helpful comments from Audrey Laporte (Toronto University) and Matteo Lippi
Bruni (University of Bologna). We thank Roland Cash for numerous fruitful discussions. We also thank for useful comments the participants of the Health Economics Workshop in PSE, of the Econometrics and Microeconomic applications seminar in Paris 1 University, as well as the participants of the Workshop on Health, inequalities, risk and public policy, Paris Descartes, 2009 and of the Irdes Workshop on Applied Health Economics and Policy Evaluation, Paris, 2010, participants to the ECHE, Helsinki 2011 and to the IHEA Congress, Toronto 2012. All remaining errors are ours. This study is funded in part by grants from CEPREMAP and from the DREES (Direction de la Recherche, des Etudes, de l’Evaluation et des Statistiques) of the French Ministry of Labor and Solidarity.We also gratefully acknowledge the support of Health Chair — a joint initiative by PSL, Université Paris-Dauphine, ENSAE and MGEN under the aegis of the Fondation du Risque (FDR)».
†PLS, Université Paris-Dauphine and Cepremap, France, [email protected]. ‡PSE and Cepremap, France, [email protected].
the private and public sector should be achieved. Pursuing such a convergence comes down to suppose that there are di§erences in e¢ciency between private and public hos-pitals, which would be reduced by the introduction of competition between these two sectors. The purpose of this paper is to compare the productivity of public and private hospitals in France. We try to assess the respective impacts, on productivity di§er-ences, of di§erences in e¢ciency, patient characteristics and production composition. We have chosen to estimate a production function. For that purpose, we have defined a variable measuring the volume of care services provided by each hospital, synthetizing the hospital multiproduct activity into one homogenous output. Our data comes from two administrative sources which record exhaustive information about French hospi-tals. Matching these two database provides us an original source of information, at the hospital-year level, about both the production composition (number of stays in each DRG), and production factors (number of beds, facilities, number of doctors, nurses, of administrative and support sta§, etc.). We observe 1,604 hospitals over the period 1998-2003, of which 642 hospitals are public, 126 are private not-for-profit and 836 are private-for-profit. This database is relative to acute care and covers more than 95 % of French hospitals. We use a stochastic production frontier approach combined with hospitals fixed e§ects. We find that the lower productivity of public hospitals is not explained by ine¢ciency (distance to the frontier), but oversized establishments, pa-tient characteristics and production characteristics (small proportion of surgical stays). Once patient and production characteristics are taken into account, large and medium sized public hospitals appear to be more e¢cient than private hospitals. As a re-sult, payment convergence would provide incentives for public hospitals to change the composition of their supply for care.
1
Introduction
The French hospital industry is one example of a market where public, private nonprofit (NP) and private-for-profit (FP) hospitals co-exist in significant proportions: in 2007, 56 % of stays for acute care occured in public hospitals, 8 % in private nonprofit, and 36 % in for profit hospitals (Arnault et al., 2009). Recently, several administrative reports have shown that in France public and private nonprofit hospitals are more costly than for profit hospitals, for a stay in a given DRG, suggesting that productivity is rather low for public and private nonprofit hospitals (Aballea et al., 2006; DHOS, 2009). Defenders of public and nonprofit hospitals advocates that this productivity gap is not due to a lack of e¢ciency but related by their mandate. Indeed, these hospitals are not allowed to select patients and have to deliver care in relation to social welfare considerations, preventing any specialization in some lucrative activity.
The purpose of this paper is to examine to which extent di§erences in the composition of stays and patient characteristics might explain productivity di§erences that are observed in France between public, private nonprofit (NP) and private-for-profit (FP) hospitals. Refer-ing to the model of yardstick competition (Shleifer,1985), Prospective Payment Systems (PPS) are based on the assumption that hospitals are identical. Any heterogeneity in cost for a stay in a given DRG is supposed to derive from moral hazard, i.e. heterogeneity in cost reduction e§orts provided by hospitals’ managers. Actually, there are many other sources of cost heterogeneity, such as quality of care, patient characteristics, returns to scale, and scope economies. Dealing with adverse selection due to hospital heterogeneity in designing a PPS is an important issue on the research agenda (Ellis, 1998; Keeler, 1990; La§ont and Tirole, 1993; Ma, 1994, 1998; Pope, 1990, Dormont and Milcent, 2005). However, most of the litterature focuses on the reimbursement of a stay in a given DRG, without paying
attention to the potential influence of the composition of stays that form the whole hospital activity.
In practice, Prospective Payment Systems lead to budgets that are linear in the number of stays in each DRG. The implicit assumption underlying such a computation is that there is no scale nor scope economies. Actually, some hospitals might receive an additional annual budget for activities such as teaching, research, palliative care, geriatry, emergency care, or for having a high proportion of low-income patients. But the payment for stays in acute care is designed as if size and composition of activity had no influence on cost per stay. Is it true? Or is this approximation illegitimate?
Our purpose is to evaluate the influence of the composition of stays on hospital pro-ductivity regarding acute care. If the stay composition has an influence on hospitals’ productivity, implementing a yardstick competition is likely to induce changes in the or-ganization of the supply for hospital care. These changes might be mergers, closing1, own-ership conversions, or simply changes in the structure of stays within hospitals, like an increase in the proportion of surgical stays. On the one hand, these changes are desirable when they lead to more e¢ciency in care provision. On the other hand, it is not desirable that hospitals are given incentives to select patients or to discontinue the provision of care services that are important from a social welfare perspective. For the needs to be fullfilled, many governments put mandates on public hospitals that are not shared by their for profit counterparts. Should payments be adjusted for di§erences in the hospital production com-position ? This issue is of major importance when a yardstick competition is implemented between hospitals with di§erent mandates.
In France, public, private nonprofit (NP) and private-for-profit (FP) hospitals di§er not
1Numerous mergers, closing and ownership conversions have been observed in the US care system, citer
only in their objectives. They are also subject to di§erent mandates and to di§erent rules as regards human resources management. Since 2004, a prospective payment system with fixed payment per stay in a given DRG has been gradually introduced for all hospitals. However, two payment schedules are used, one for nonprofit hospitals (public and private), one for private-for-profit hospitals. Currently, payments per stay in a given DRG are on average 27 % higher in the nonprofit sector (public and private) than in the for profit sector (DHOS, 2009).2
A convergence of payments between the nonprofit and for profit sectors was planned by 2018 by the previous government, but this project has been abandoned by the newly elected government. Pursuing such a convergence comes down to supposing that di§erences in cost per stay are due to di§erences in e¢ciency between nonprofit and for profit hospitals, which would be reduced by the introduction of competition between these two sectors. Currently, there is a strong lobbying from the for profit sector in favor of an acceleration of the process towards payment convergence. Given the current gap in payments between nonprofit and for profit hospitals, such a policy would generate sizeable rents for the for profit hospitals.3 On the one hand, these rents are justified since they derive from a payment scheme which permits the revelation of the cost for an e¢cient activity4. On the other hand, they are not fully justified if the lower cost of private hospitals is partly due to the fact that their activity is free of the constraints and mandates that a§ect public hospitals. Our purpose is to question the relevance of the convergence objective by analysing the causes of productivity di§erences that are observed between hospital types before the reform implementation.
2Actually, the level of the average payment di§erence depends on whether it is computed on the basis of
the casemix in the private for-profit (in which case it is equal to 21 %) or public/nonprofit sector (27 %).
3Indeed, in this case payments would be set in between the levels observed in the for profit and non
profit sectors.
4Otherwise, this cost level would remain a private information of the hospital’s manager (La§ont and
More exactly, our purpose is to disentangle the impact of hospital ine¢ciency per se from the impacts of the stay composition and patient characteristics.
Focusing on productivity, we can use a quasi-exhaustive information from an adminis-trative file recording stays for acute care. The empirical analysis is performed on a panel of 1,604 French hospitals observed over the year 1998 to 2003, of which 642 are public, 126 private nonprofit and 836 private-for-profit. For year 2003, this database represents more than 13 millions of stays, covering about 90 % of total discharges for acute care.
We suppose the production function to be identical for all hospitals. Indeed, this as-sumption underlies the introduction of a yardstick competition between hospitals of all types. We adopt a stochastic production frontier approach combined with hospitals fixed e§ects in order to evaluate to what extent di§erences in productivity that are observed between nonprofit hospitals (public and private) and for profit hospitals can be explained by di§erences in patient and production characteristics. Moreover, we examine how the assessment of e¢ciency can be modified when we take the composition of stays into con-sideration. Finally, we draw conclusions on the potential impact of payment convergence between the nonprofit and for profit hospitals.
This article is organized as follows. In Section 2, we provide a quick overview about the literature devoted to ownership and hospital performances. In Section 3, we describe the French regulation of hospital care. A description of the data is provided in section 4. The econometric specification and estimation strategy are explained in Section 5. Our results are presented in Section 6, with an analysis of the components of productivity di§erences between hospital types. Section 7 concludes.
2
Ownership and hospital performances
Numerous papers try to identify the impact of ownership structures in the hospital indus-try. From a theoretical point of view, di§erences in performance should derive from the di§erences in objectives under di§erent ownership structures. In short, public hospitals have little incentives to eliminate waste while nonprofit hospitals might expand the quan-tity and quality of services provided beyond the socially optimal level (Newhouse,1970, Lakdawalla and Philipson, 2006). For profit hospitals are likely to be the most e¢cient: they maximize profit and can lower noncontractible quality to maximize return (Hart et al., 1997). Di§erences in performances among ownership types are likely to be diminished if a payment system based on yardstick competition is implemented.
The empirical litterature investigates the impact of ownership on hospital performance in two ways. Some studies examine the impact of ownership on e¢ciency, while other studies focus on possible supply induced demand behavior and changes in care quality associated to ownership. (i) As concerns e¢ciency, empirical evidence is not very conclu-sive. According to Sloan (2000), there is no systematic di§erence between for profit and nonprofit hospitals. Burgess and Wilson (1996) underline that ine¢ciency has several di-mensions, being reflected in radial, slack or scale ine¢ciency. No kind of hospital ownership appears to be more e¢cient in every dimension. They find that hospitals of the Veteran Administration are more e¢cient than FP and NP hospitals in terms of radial e¢ciency, but are highly ine¢cient as concerns scale. (ii) Other empirical studies examine whether hospital ownership influences treatment costs and quality, for patients admitted for a given illness. If hospitals are paid on a fee-for-services basis, FP hospitals have an incentive to perform more numerous and intensive procedures. It is also the case under a PPS, when a more intensive treatment results in a DRG with more weight. Sloan et al. (2001) show
that payments on behalf of Medicare patients admitted to for profit hospitals following a stroke, a hip fracture, or a congestive heart failure, were higher than those admitted to other hospitals. These findings are consistent with other results concerning hospitals of the US care system. On the other hand, Lien et al. (2008) do not find significant di§erences in treatment expenditures for stroke or heart cardiac between NP and FP hospitals in Taiwan. Turning to the impact of ownership on quality, empirical results show that FP status (or conversion to FP) is connected to a lower care quality (Picone et al., 2002; Lien et al., 2008).
In our study, we are interested in issues of type (i), i.e. productivity and technical e¢ciency. We do not investigate a possible increase in expenditures due to more intensive procedures for a stay in a given DRG. We consider data at the hospital level and examine productivity and technical e¢ciency, taking as given the observed number of stays in each DRG.
3
The French regulation of hospital care
In France, all hospitals are financed by a unique third-party payer, the French National Health Insurance (NHI). The patient can freely choose between public, private NP or FP hospital. In practice, he is referred to the hospital by the specialist who recommanded the hospitalization. Choosing a private-for-profit hospital gives access to better confort and reduces waiting time. There is no evidence of di§erence in care quality between public, non profit and for profit hospitals. Choosing a private-for-profit hospital has implications on the patient’s out-of-pocket expenditures: there are in general extra fees for accomodation and extra payments to the doctor and possibly the anaesthetist. These extra fees are not
covered by the NHI, but may be covered by the patient’s complementary health insurance5. However, most complementary insurance contracts do not cover overbillings (HCAAM, 2009).
In France, public, private nonprofit and for profit hospitals are subject to di§erent rules as regards investments, human resources management and patient selection.
In the public sector the number of beds is defined by an administrative authority, and investment is controlled through financement. Doctors, nurses and other employees are civil servants, which prevents any dismissal or transfer and hampers reorganizations. Owing to their mandates, public hospitals cannot select patients and are assigned to supply a comprehensive range of hospital care services. Finally, they must be open continously: access to care must be garanteed for all, twenty-four hours a day. The characteristics of large public hospitals in France are close to the characteristics of large nonprofit hospitals in the U.S. They account for the majority of admissions, a medical career in public hospitals is rather prestigious, all teaching hospitals are public, and large public hospitals generally provide a high quality of care. In France, small public hospitals are not necessarily rural: there are in general located in small provincial cities. Maintaining acute care activities for small public hospitals is currently under debate: it could be better for social welfare to convert them to nursing homes dedicated to rehabilitation or long term care. Actually, geography does not matter much in France, which is not a very large country and has a reliable transportation network. Each of the 22 administrative areas (Régions) is endowed with a large teaching hospital that supplies all kind of acute care services and performs innovative procedures. In case of need, every citizen can be rapidely admitted in such a
5Currently, more than 90 % French people are covered by a private complementary health insurance,
which is provided by the employer, or subscribed on a voluntary basis. These insurances are subscribed in addition to the NHI. Complementary health insurances have covered 13.7 % of total health care expenditures in 2008 .
regional center, or in another large public hospital.
Private nonprofit hospitals are not numerous. They are subject to the same constraints than public hospitals, except that their doctors, nurses, administrative sta§ and employees are not civil servants. This allows for more flexibility in human resources management: in addition to easier dismissals or transfers, they are not obliged to follow the remuneration scale of the public service and can o§er more generous payments to doctors.
French private-for-profit hospitals have a sizeable contribution to hospital care services: about one third of discharges in acute care occurs in for profit hospitals. One observes a growing specialization towards short stays (< 24 h) and surgical stays : currently half of surgical stays take place in private-for-profit hospitals. They are subject to some adminis-trative constraints: their number of beds is defined by a planification at the regional level and investments in hightech facilities are subject to an authorization. In practice, their bargaining power is non negligible. Doctors salaried in the public sector are allowed, for a limited amount of time per week, to work in a private hospital. They are self-employed for this part of their activity. Above all, FP hospitals have no mandate specifying their supply for care: they can specialize as they want and are allowed to select their patients. Given the existence of a unique third party payer, cost-shifting is not an issue for French hospitals. Patient selection is not mainly based on patients’ income and socio-economic characteris-tics. Richer patients might indeed have a more generous complementary insurance that permit to raise overbilling. But the bulk of the bill is paid by the NHI, irrespective of patient’s income level. On the other hand, FP hospitals have interest to select patients that need intensive care, but are in a relatively good shape (not too old, with little or no secundary diagnoses), in order to maximize their revenues, together with ensuring good outcomes and a low complication rate. On the whole, private FP hospital decisions are
mostly influenced by the demand function they face and by conditions prevailing on the market for health care.
In France, for profit hospital were originally owned and operated by one physician or a group of physicians. Now this physician generation is coming to retirement age and in the process of selling these establishments to investor-owned companies seeking corporate profits. Large chains of hospitals are set up, such as Générale de Santé and Vitalia (partly owned by the investment bank Blackstone). There is no doubt that substantial financial returns are expected from such investments.
Why would public and NP hospitals be less e¢cient than FP hospitals? As stated above, these hospitals have di§erent objectives and mandates and are subject to di§erent rules relative to human resources management and patient selection. Moreover, they were financed according to di§erent payment schemes until 2003: a global budget system was used for nonprofit hospitals (public and private), while private-for-profit hospitals were paid a mix of fee-for-service and payments per day covering accomodation.
It is not obvious that these payment schemes should entail a higher e¢ciency for private FP hospitals. Indeed, their payment was equivalent to a retrospective payment per stay, which does not provide incentives for e¢ciency. As concerns public and private nonprofit hospitals, the global budget system has been implemented with a soft budget constraint, which makes the global budget ressemble to a retrospective payment. In other words, payments implemented before 2004 did not give hospitals of any type much incentive for e¢ciency.
Since 2004, a prospective payment system (PPS) with fixed payment per stay in a given DRG is gradually introduced for both private and public hospitals. In addition to prospective payments per stay, hospitals can receive lump-sum payments to compensate
for activities such as teaching, research, emergency care, preventive care, etc. (Or, 2009). Almost all of these lump-sum payments are granted to public hospitals. As stated above, two di§erent payment schedules are currently used for the prospective payment per stay, one for private-for-profit hospitals, another one for nonprofit hospitals (public or private). This payment scheme introduces two separate arenas of yardstick competition: between for profit hospitals on the one hand, and between nonprofit hospitals, on the other hand. Thus, it provides incentives for e¢ciency for both hospital types. Nevertheless, owing to the lump-sum payments received by public hospitals, and to the di§erence in payment schedules used for the PPS, the power of incentives is probably not the same, depending on the hospital type.
In this paper, we compare the productivity and e¢ciency of French public, private nonprofit and for profit hospitals during period 1998-2003, i.e. before the reform that has introduced a PPS. Hence, it will be possible for us to interpret di§erences in performances over this period as deriving mainly from di§erences in mandates and objectives linked to ownership.
4
The data
A vast majority of papers devoted to hospital e¢ciency focuses on the estimation of a cost function (see, for instance, Wagsta§, 1989, Linna, 1998, Rosko, 2001, Zuckerman et al., 1994, Farsi et al., 2005). Costs functions allow to deal with the multiproduct activity of hospitals and to check for ray economies of scale, product-specific economies of scale, and economies of scope. Despite these advantages, we decided to focus on productivity and to consider a production function. Our motivation is that we aim at performing a relevant comparison of performances between hospital types. As a matter of fact, costs are generally
di¢cult to observe in the for profit sector. For competitive reasons, information about cost is a rather sensitive information. Moreover, doctors might be part owners of for profit hospitals, which add di¢culties to measure real costs and profitability. In addition, in France the cost measure is not comparable between public and private hospitals: it does not encompass the doctors’ payments, nor overbilling in private nonprofit and for profit hospitals, while in public hospitals doctors are salaried and their wages included in the cost.
Taking advantage of the duality theory, we know that di§erences in costs between hospital ownership can result from di§erences in technical e¢ciency (distance to the frontier defined by the production function), di§erences in input prices (payments to care providers and wages di§er in the private and public sectors), and in input allocation. Estimating a production function enables us to evaluate di§erences in technical e¢ciency, and to identify the sources of productivity di§erences. However, we will not be able to examine the impact on costs of di§erences in input prices, and to check for possible allocative ine¢ciency.
4.1 Definition of production
The French classification system was inspired by the classification used in USA by the Health Care Financing Administration. In France, a complete information system that classifies inpatient stays by DRG has been set up since 1994 for non profit hospitals (public and private) and 1997 for private-for-profit hospitals. Denote Njht the number of stays
in hospital h in year t that have been classified in DRG j. The French administrative authority estimates the average cost per stay in a given DRG from a sample of hospitals which participate in the cost database program on a voluntary basis. These average costs are used to build the "Echelle Nationale des Coûts", a costweight scale which is updated
every year. This scale is based on relative costs and gives, for each stay in a given DRG j, the corresponding number of production units, called ISA points6.
Denote pjtthe number of ISA points attributed in year t for a stay in DRG j. It provides
a measure of the volume of corresponding care services. Hence, we define the production of hospital j in year t by:
Qht= J
X
j=1
pjt Njht (1)
This definition synthetizes the multiproduct hospital activity by one homogenous prod-uct, measured in ISA points. To ensure the relevance of our comparison, we use the same "price" scale pjt , j = 1, ..., J ; t = 1, ..., T , for hospitals of any type of ownership. For the
period covered by our data (1998-2003), only the cost database relative to public and NP hospitals is available7. Notice that we focus on the activity relative to acute-care only. As stated above, the PPS concerns the payment of acute-care stays, and does not influence directly the financing of other activities such as teaching or research. Our purpose is to examine whether productivity relative to acute-care is influenced by the stays composition, patient structure and teaching activity.
4.2 Two administrative databasis
Our data stem from two administrative sources: the PMSI and SAE databasis. PMSI stands for Programme de Médicalisation des Systèmes d’Informations, which collects in-formation about hospital activity regarding stays for acute care in all French hospitals. The information is almost exhaustive: participation to PMSI is mandatory, except for very small public hospitals with a specific status (hôpitaux locaux ). In PMSI database,
6ISA stands for "Indice synthétique d’activité", i.e. Synthetic index of activity. 7
information is recorded at the stay level about DRG, secondary diagnoses, procedures im-plemented, severity, mode of entry into the hospital (coming from home or transferred from another hospital), mode of discharge (return home, transfer or death), length of stay, age, and gender of the inpatient.
The SAE8 database provides information at the hospital-year level about production
factors, i.e. number of acute-care hospital beds, facilities, number of doctors, nurses, nursing auxiliairy sta§, administrative sta§ and support sta§ (all are measured in full-time equivalents).
Matching these two database provides information at the hospital-year level, about the composition of hospital activity and its production factors. We eliminated hospitals for which the identification code was not recorded, preventing any match with the SAE database. We also eliminated hospitals with no bed or no employees: these are small establishments devoted exclusively to chemotherapy, radiotherapy or dialysis sessions.
Our final database contains 1,604 hospitals over the period 1998-2003, that is 7,731 observations at the hospital-stay level. This panel is unbalanced: not all hospitals are observed from year 1998 to year 2003. For year 2003, this database represents about 90 % of total discharges for acute-care.
We consider six production factors: the number of acute-care beds, denoted bed, the number of physicians, denoted phys, the number of nurses, nurs, auxiliary nursing sta§, nurs_aux, administrative sta§, adm, and support sta§ , supp.
The number of physicians is not consistently measured across hospital types: it is well recorded for public hospitals, where doctors are salaried, but measured with errors for nearly all for profit and private nonprofit hospitals. Indeed, when self-employed physicians
8
associated with private hospitals are recorded in the SAE database, there is no informa-tion about their work time, so we cannot calculate full-time equivalents. Moreover, the number of physicians is not recorded at all for 435 FP or NP hospitals. In order to treat equally hospitals of all types, we decided to specify the number of physicians as an omitted variable.9 As a result, the number of physicians is a component of the hospital specific
unobserved heterogeneity in our econometric specification. This component being likely to be correlated with other regressors, we have considered a model with hospital fixed e§ects to avoid possible bias.
4.3 Characteristics of public, private nonprofit and for profit hospitals
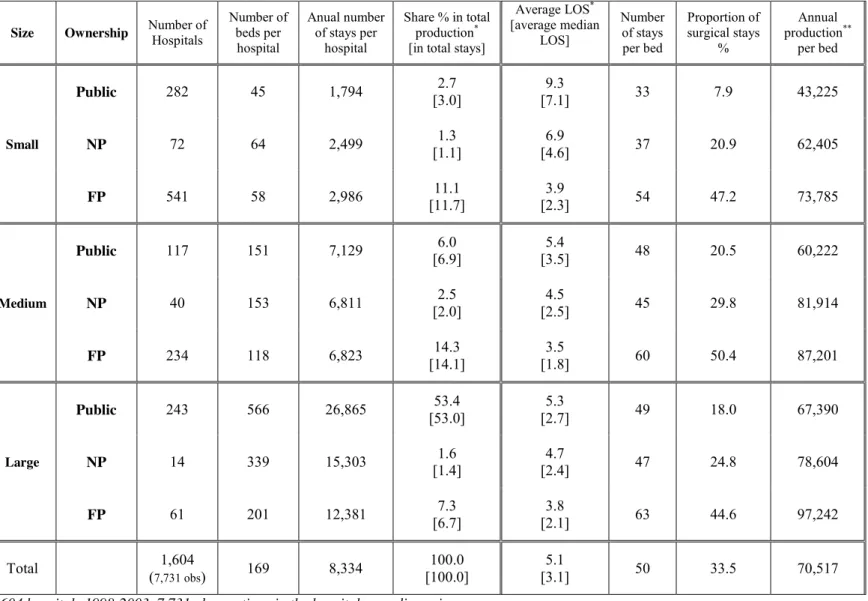
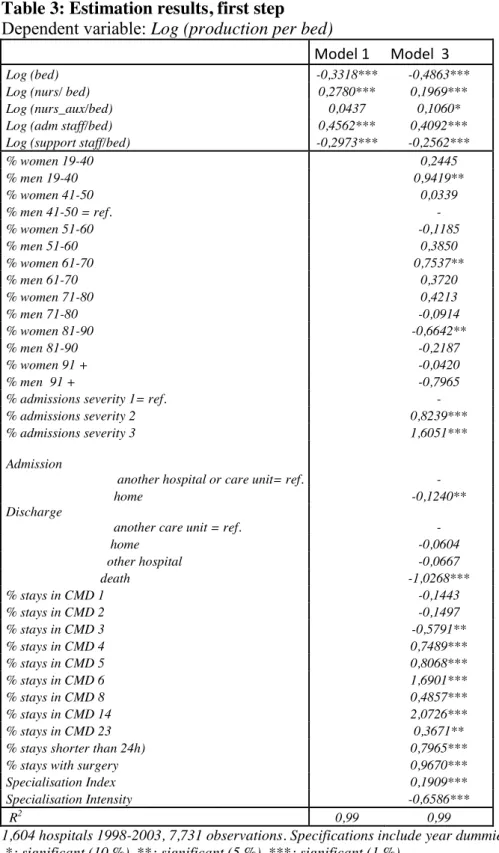
Graphs 1 to 3 and table 1 display the main features of the data. 1,604 hospitals are observed, of which 642 hospitals are public, 126 are private nonprofit (NP) and 836 are private-for-profit (FP). For the purpose of the analysis, we have considered three size groups: small hospitals, with less than 5,000 discharges per year, large hospitals with more than 10,000 discharges per year, and medium hospitals in between.
[Insert graphs 1 to 3 and table 1 about here]
On the whole, 62.9 % of discharges occurred in public hospitals, 4.6 % in private non-profit hospitals, and 32.5 % in for non-profit hospitals. Graph 1 shows that the bulk of hospital care services, measured by production indicator (1) comes from large public hospitals, while for profit hospitals of any size have a smaller contribution to care services. Measuring pro-ductivity by the annual number of ISA points per bed, we find that public hospitals of any size are less productive than private nonprofit and for profit hospitals (table 1 and graph 2). One observes also an amazing proportion of surgical stays, close to 50 % in for
9
profit hospitals of any size (graph 3). Table 1 displays more detailed information about hospital characteristics. Small for profit hospitals appear to be quite numerous with an average number of beds slightly higher than in small public hospitals (58 versus 45). for profit medium sized hospitals are also twice more numerous (234 establishments) than their public counterparts (117 establishments), but with less beds on average (118 versus 151). Large hospitals are mainly public: there are 243 large public hospitals, for only 14 large nonprofit and 61 large for profit hospitals. Large public hospitals ensure 53.4 % of hospital care services. They are enormous, with 566 beds on average, to compare with the 201 beds of their for profit counterparts. In addition to a relatively low proportion of surgical stays, public hospital activity is characterized by longer stays. This is particularly striking for small public hospitals, with an average length of stay (LOS) equal to 9.3 days (3.8 days in small for profit hospitals). This di§erence is still observable as concerns medium-sized and large hospitals: LOS are on average 1.5 to 2 days longer in public hospitals than in private-for-profit hospitals, nonprofit hospitals staying in between (about one day longer than in for profit hospitals).
Table 2 displays information about the level of inputs and the organization of hospital sta§. On average, there are about 3 employees per bed , with large di§erences depending on hospital size and ownership. Public hospitals employ more persons per bed than for profit hospitals: 7.6 for small public hospitals and 3.7 for medium and large public hospitals, while for profit hospitals of any size employ only 1.7 to 1.9 persons per bed. This result holds for each component of hospital sta§: public hospitals have more nurses, more nursing auxiliaries, more administrative sta§ and more support sta§ per bed, than private-for-profit hospitals. The contrast is particularly pronounced as concerns the number of nursing auxiliaries per bed, which is more than six times higher in small public hospitals than in
small for profit hospitals. The number of support sta§ per bed is also very high in public hospitals of any size.10 As for LOS, the characteristics of private nonprofit hospitals as regards the number of employees per bed stay in between characteristics of public and for profit hospitals.
To sum up, public and nonprofit hospitals employ more persons per bed and have longer stays than for profit hospitals, suggesting a less e¢cient use of inputs. It might also derive from characteristics of their activity, such as the fact that they ensure a high proportion of medical stays.
5
Econometric specification and estimation
We consider a Cobb-Douglas production function with 6 production factors : bed, phys, nurs, nurs_aux, adm and supp. One has :
Qht = A (physht)α1(nursht)α2(nurs_auxht)α3(admht)α4(suppht)α5(bedht)β (2)
Taking the logarithms, one obtains the linear expression:
qht− bht = (µ − 1) bht+ α1[log(phys)ht− bht] + α2[log(nurs)ht− bht] (3)
+α3[log(nurs_aux)ht− bht] + α4[log(adm)ht− bht] + α5[log(supp)ht− bht] + a
1 0Table 2 displays also statistics on doctors per bed, computed on a sub-sample of 1,169 hospitals for
which the number of doctors is recorded. For private hospitals, we have no information on the work duration of part-time physicians. We considered three alternative assumptions to build a full-time equivalent measure of the number of doctors: half-time, 10 % or 80 % time. We obtain average numbers of doctors per bed that do not appear to be di§erent between hospital ownership. However, it is di¢cult to draw any conclusion from this result, given the uncertainty about the relevance of our hypotheses. In addition, many self-employed doctors are likely to be not recorded. As stated above, the number of doctors will be treated as an omitted variable in our econometric estimations.
with bht = Log(bedht) and qht = Log(Qht). a is a constant term and µ is the return to
scale parameter. As stated above, we prefer to treat the number of doctors as an omitted variable: it is often not recorded and, when recorded, likely to be measured with errors.
In the econometric specification we formalize hospital unobserved heterogeneity and ine¢ciency as follows:
qht− bht = (µ − 1) bht+ α2[log(nurs)ht− bht] + α3[log(nurs_aux)ht− bht] (4)
+α4[log(adm)ht− bht] + α5[log(supp)ht− bht]
+ct+ γ + δ.teachh+ vh− uh+ ξht.
γ is an intercept, ct is a year fixed e§ect, teachh is a dummy variable indicating whether
h is a teaching hospital. vh is a random variable measuring unobserved heterogeneity at
hospital level and uh ≥ 0 is a non-negative random variable measuring hospital ine¢ciency.
ξht is a statitical noise supposed to be i.i.d. (0, σ2
ξ) and uncorrelated with the explanatory
variables.
We use a two-stage approach: we first apply the OLS to estimate the following specifi-cation:
qht− bht = (µ − 1) bht+ α2[log(nurs)ht− bht] + α3[log(nurs_aux)ht− bht] (5)
+α4[log(adm)ht− bht] + α5[log(supp)ht− bht] + ct+ ηh+ ξht ,
where ηh is a hospital fixed e§ect.
1977, Jondrow et al., 1982) to decompose the estimated hospital fixed e§ects into separate estimates of hospital specific unobserved heterogeneity vh, and hospital ine¢ciency uh.
More exactly one has, from11 (4) :
bηh = γ + δ.teachh+ vh− uh (6)
We assume that uh has a strictly non-negative distribution and that vh has a
symet-ric distribution and apply the maximum likelihood estimator to (6). If one assumes that vh ∼ N(0, σ2v) and uh ∼ N+(0, σ2u), the model is normal-half normal. Another
possibil-ity is to assume that uh follows the exponential distribution, in which case the model is
normal-exponential. The di§erence between the log of output qh and its maximal value
qmax
h given by the frontier is measured by − uh. The estimation makes it possible to
com-pute the asymmetry parameter λ = σu σv
, which gives an evaluation of the magnitude of the ine¢ciency component. In addition, we can compute an e¢ciency rate at the hospital level: ef f ih = exp {−uh} = Qh Qmax h (7)
Our empirical strategy consists in considering three specifications. Our first specification is defined in (5). It is a classical production function connecting inputs and output:
qht− bht = x0ht α + ct+ ηh+ ξht , (Model 1)
where x0ht is a [1,5] vector describing production factors, i.e. the inputs. We also consider two other specifications:
1 1Here we do not add dummies relative to ownership on purpose, in order to examine in the following
qht− bht = x0ht α + z0ht β + c0t+ η0h+ ξ0ht (Model 2)
qht− bht= x0ht α + zht0 β + π0htθ + c00t + η00h+ ξ00ht (Model 3)
In model (Model 2) we add a [1,19] vector z0
ht describing patient characteristics:
pro-portion of patients of given age and gender, severity, entry and discharge mode. In model (Model 3) we add a [1,13] vector π0ht describing production characteristics: proportion of stays in 10 important MDC (Major Diagnostic Categories: neurology (MDC1), ophtal-mology (MDC2), otorhinolaryngology (MDC3), pneuophtal-mology (MDC4), cardiology (MDC5), gastroenterology (MDC6), orthopaedics (MDC8), deliveries (MDC14), short stays (shorter than 24 hours and coded12 MDC24), degree of specialization, proportion of surgical stays. These specifications are rather “eclectic” (Vita, 1990) since variables describing heterogene-ity in the output appear at the right hand side of the production function. We believe it is relevant: the variability of the added regressors is mainly composed of between hospital variability and we specify a fixed hospital e§ect for each equation
Our two-step estimation is rather particular. Most papers devoted to stochastic frontier analysis use a one-step maximum likelihood estimator. For that purpose, it is assumed that hospital specific heterogeneity vh and hospital ine¢ciency uh are both uncorrelated with
regressors. This assumption seems to us quite untenable: vh is linked to omitted variables
such as care quality, or the number of physicians, which are likely to be correlated with the level of inputs. Estimating a fixed e§ect model allows us to obtain consistent estimations of the production function parameters. Moreover, we assume that the first step estimates
1 2
of ηh are consistent. This is not obvious, but makes it possible to avoid assuming an independency between regressors and random variables vh and uh.
Another important issue is whether hospital specific heterogeneity should a§ect the production function or the ine¢ciency component. Greene (2004) shows that within a fixed e§ect approach, there is no satisfactory specification: either the fixed e§ect is en-tirely absorbed in the ine¢ciency component, or it a§ects the production function only. Ine¢ciency is either overestimated or underestimated. Many papers suppose that the inef-ficiency term uhis random and uncorrelated with the regressors of the production function,
but formalize the idea that it is correlated to time and some covariates (Battese and Coelli, 1992,1995; Rosko, 2001, and Herr et al., 2010). But why are these covariates excluded from the production function regressors? There is no clear-cut discussion on whether they might explain production or ine¢ciency.
Consider variables zht0 : in model (Model 2) they are added to regressors x0ht to explain hospital productivity qht− bht. Another specification could be adopted, which consists in
supposing that variables zht0 explain hospital ine¢ciency (Battese and Coelli, 1995). In the first case these variables influence the frontier, in the second case they a§ect the distance to the frontier.
Our purpose is to take public hospital mandates into account in the production function specification. For instance, the fact that they are not allowed to select patients entails specific values of zht0 , which reflect patient composition as regards age, gender and severity. We want to evaluate to which extent the assessment of hospital e¢ciency is influenced by the frontier specification. Model (Model 1) is a classical production function. In model (Model 2) we add patient characteristics to the frontier specification. In model (Model 3) we add production composition. If model (Model 2) is the right specification, then model
(Model 1) is not consistently estimated if one supposes random e§ects uh and vh and if
variables zht0 , which are omitted in (Model 1) are correlated with regressors x0ht. Estimating a fixed e§ect model allow us to avoid these omitted variable bias.
The production function is supposed to be identical for all hospitals. Indeed, this as-sumption underlies the introduction of a yardstick competition between hospitals of all types. The robustness of the results with respect to the treatment of doctors as an omitted variable is checked by carrying the estimations on a restricted sample where physicians are observed (see appendix). We also show that our conclusions are not changed when we consider a translog production function.
6
Results
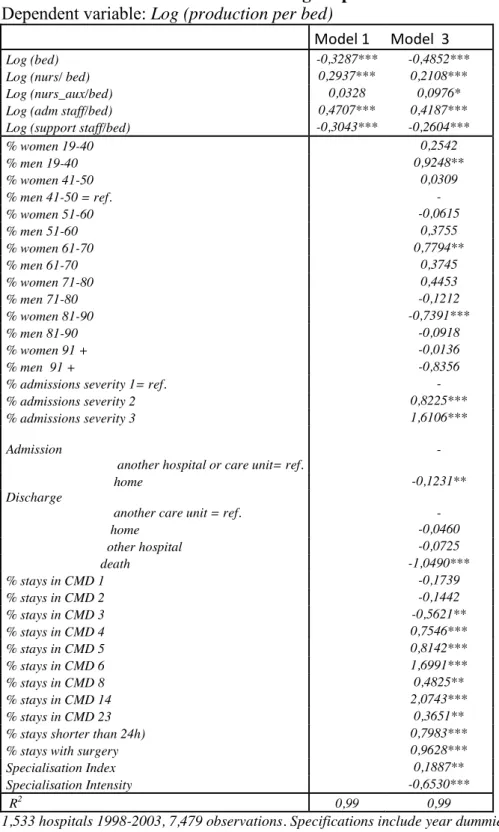
The estimations of Model 1 and Model 3 are displayed in table 3.13
All models give similar results as concerns the influence of production factors on hos-pital productivity (table 3). Every component of hoshos-pital sta§ has a positive marginal productivity, except support sta§, whose coe¢cient is negative. The positive impact of nursing auxiliaries is weakly significant, and in Model 3 only.
The negative coe¢cients obtained for the number of beds suggest that the returns to scale are decreasing (see expression (3)). However, such a conclusion is not relevant. Indeed, the specification includes a constant specific to each hospital, which is likely to be connected to its size. This result only means that locally, around the level corresponding to its specific constant, a decrease in the number of beds induces an increase in hospital productivity. This result does not tell anything about the optimal size of establishments,
1 3We do not publish the results for Model 2, which are available on request. Indeed, this model gives
that is, about the productivity levels of hospitals of di§erent sizes.14
6.1 Productivity relies on uncomplicated stays with intensive procedures The estimation of Model 3 makes it possible to examine the impact of patient characteristics on hospital productivity, as well as the impact of production composition. The proportion of patients aged more than 80 has a negative influence on productivity, which is significant for women aged 81-90. Conversely, the proportion of women aged 61-70 has a positive impact, as well as the proportion of young men (aged 19-40). The proportion of patients of severity 2 or 3 has a positive impact on productivity. It is important to avoid any misinterpretation of the meaning of this variable: compared to the reference (severity degree equal to 1), severity degrees 2 or 3 do not indicate the presence of comorbidities with complication risks. They only indicate that an intensive, or very intensive, surgical procedure was performed. Finally, the estimations show that the proportion of patients who died during their stay has a strong negative influence on hospital productivity.
These results show how the measure of hospital production works. As stated above, it is based on a valuation of stays in di§erent DRGs on the basis of the costweight scale (see (1)). A stay contributes to an improvement in productivity if (i) it is associated to the performance of a rather invasive procedure; (ii) it is "simple", i.e. it corresponds to a single pathology in the DRG classification. Indeed, intensive procedures are well paid in terms of ISA points, and a simple stay is shorter and uses less resources (for the same return in ISA points) than a complicated stay with comorbidities. This is why stays of very old people are unfavorable to productivity: old patients are generally a§ected by several illnesses or
1 4The issue of optimal size is out of the scope of this study. However, we have estimated a production
function without hospital fixed e§ects, including a polynomial function of the number of beds in order to examine the relation between size (measured by the bed number) and productivity. With a polynom of degree 3, we have obtained a local minimum of productivity for a size equal to 8 beds, and a maximum for a size equal to 253 beds.
complication factors, and their frailty impedes the use of invasive procedures. For the same reason, stays with severity degrees equal to 2 or 3 greatly improve productivity, since they are associated to the performance of intensive procedures. Finally, a patient who dies in hospital is the worst case: it is generally a very old person, with many comorbidities and high complication risks. In this case, a large amount of resources is spent for a classification in a single DRG.
Estimations displayed in the lower part of table 3 show the influence of the composition of hospital activity on productivity. The proportion of surgical stays has a large positive impact on productivity (a 0.1 increase in this proportion increases productivity by 9.7%). The proportion of short stays (less than 24H) also has a large positive impact: a 0.1 increase in the proportion of short stays raises productivity by 7.9%. The same mechanisms are at work: surgical stays are well paid in ISA points and short stays use less resources. We also find that some types of activity have a positive impact on productivity: this is the case for stays in the MDC14 (Deliveries), MDC5 (Circulatory system), MDC6 (Digestive system), MDC4 (Respiratory system) and MDC8 (Orthopaedics).
6.2 The diagnosis of e¢ciency is contingent upon taking into account patient and production characteristics
The results of the second step of the estimation are summarized in tables 4a and 4b. The asymmetry parameter is reduced when we introduce patient characteristics in the definition of the frontier (Model 2), and reduced further when production characteristics are added to the specification (Model 3). This shows that the estimate of the ine¢ciency term partly captures the influence of variables that are omitted in Model 1.
and the maximal level of productivity in case of full e¢ciency. Hence, we can compute e¢ciency rates defined by (7): ef f ih = exp {−uh} . This term is interpreted as follows:
ef f ih = 82.4 , for instance, means that the hospital has delivered a value of care services
equal to only 82.4 % of the amount it could have provided if it were fully e¢cient. We obtain an estimate of ef f ih for each of the 1,604 hospitals of the sample. The distributions
and medians of the estimated ef f ih are displayed in graphs 4 and 5, and in table 4b, by
hospital ownership and size.
The e¢ciency rates derived from the estimation of Model 1 suggest that public hospi-tals are less e¢cient than private-for-profit hospihospi-tals, whatever their size (table 4b). The di§erence is sizeable as concerns small hospitals: small public hospitals are amazingly ine¢cient, with a median e¢ciency rate equal to 17.2%! The gap between public and private-for-profit hospitals is reduced for medium size hospitals: 64.2% versus 80.8%. And it is even smaller for large hospitals, with still a higher e¢ciency of private FP hospitals: their median e¢ciency rate is 88.7 % while it is 82.4 % for large public hospitals. Private nonprofit hospitals of any size show intermediate e¢ciency rates, but rather close to the performance of for profit hospitals.
As stated above, our empirical strategy consists in examining how the assessment of productive e¢ciency is modified when regressors describing hospitals’ patient and produc-tion characteristics are included in the frontier specificaproduc-tion. It is quite logical that the introduction of additional regressors to the specification influences e¢ciency assessment, because it induces a shift in the frontier location. Yet, there is no mechanical reason for the introduction of patient and production characteristics to work in favor of an improvement of the public sector’s performance. We know, however, that private-for-profit hospitals are free to select their patients and to choose the hospital services they want to supply.
It is likely that their choices as concerns patient selection and supply strategies aim at improving e¢ciency. If this argument is correct, we should obtain an improvement of pub-lic hospital performance when we introduce patient and production characteristics in the frontier specification.
Indeed, the relative performance of public hospitals is clearly improved when we in-troduce patient characteristics in the frontier specification (Model 2). The improvement is accentuated when production characteristics are included. According to the results of Model 3, the most e¢cient hospitals are public hospitals, at least as concerns large and medium sized establishments.15
Graph 4 and 5 display the distributions of the e¢ciency rates estimated with Model 1 and Model 3. They show that large and medium sized public hospitals appear to be the most e¢cient when patient and production characteristics are taken into account, while they appear to be the least e¢cient when patient and production characteristics are taken into account.
We have checked the robustness of this result by estimating a Translog production function, and by eliminating teaching hospitals from the sample. We have also estimated the model on a restricted sample of 1,169 hospitals where the number of physicians is observed (in this case, physicians are not treated as an omitted variable). We have also checked the results obtained when very small local or "hybrid" hospitals16 are eliminated. In any case, we find that public hospitals are more e¢cient than private-for-profit hospitals when e¢ciency rates are estimated with Model 3, while the reverse is true when they are
1 5
The performance of small public hospitals, though higher than in Model 1, is still very poor. Their median e¢ciency rate is 48.2 % with Model 3.
1 6These hospitals have a non negligible proportion of very long stays, which suggests that they provide
estimated with Model 1.17
6.3 The sources of productivity di§erences between public and private hospitals
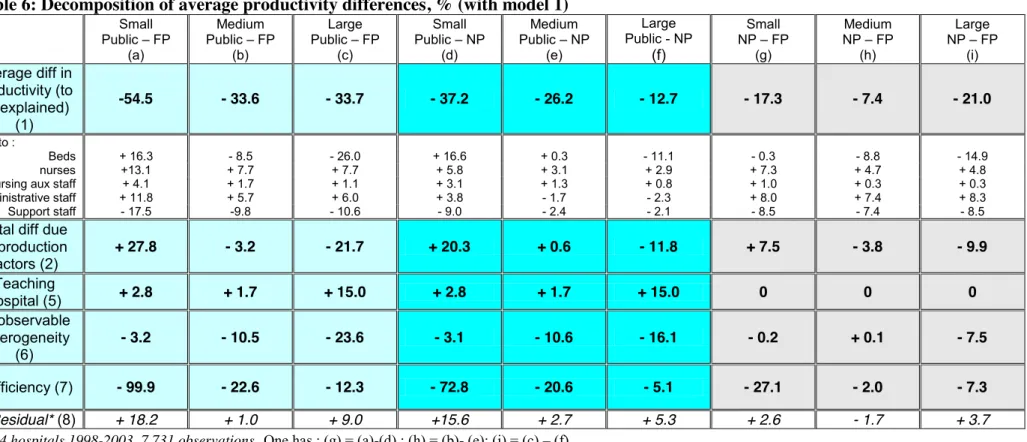
The estimation of the production function makes it possible to evaluate the components of productivity di§erences between hospitals, depending on their ownership. The use of a Cobb-Douglas specification has the advantage of leading to a formula with additive contributions of inputs, patient and production characteristics.18 With three types of ownership (public, private-for-profit and nonprofit) and three categories of hospital size, nine combinations can be considered. The results derived from the estimation of Model 3 are displayed in table 5. Results derived from the estimation of Model 1 are given in table 6 in the appendix: they lead to identical conclusions as concerns the impact of production factors.
For large hospitals, the contrasts displayed in table 5, column (c) show that public hospitals are less productive than private-for-profit hospitals: the gap is sizeable, equal to - 33.7%. The contributions of production factors to this gap are detailed in table 5, with the resultant given line (2). The principal negative e§ect comes from the number of beds (- 38.1%), which is particularly high in the public sector (see the descriptive analysis in section 4.3). The excessive number of support sta§ also has a strong negative influence on public hospital productivity (- 9.1%). We have seen that the proportion of support sta§ is particularly large in public hospitals (section 4.3). As shown by Clark and Milcent (2011), political considerations in connection with the local unemployment rate might influence
1 7Tables 7 and 8a, b in the appendix provide the results obtained when teaching hospitals are removed
from the sample.
1 8Actually, the whole two-step estimation procedure is non linear, which causes a non zero residual in
employment in French public hospitals. In total (line (2)), the resultant of productivity di§erences due to production factors causes a productivity gap of - 33.6% for public hos-pitals. Patient characteristics also have a negative impact on public hospital productivity (- 11.1%), as do production characteristics. The latter explains a 29% gap with respect to private-for-profit hospitals, of which 25.7% are due to the proportion of surgical stays: the specialization of private-for-profit hospitals in surgical stays explains their higher pro-ductivity. Conversely, the positive impact of teaching hospitals, hightech establishments which are exclusively public, and the impact of unobserved heterogeneity, work in favor of the productivity of public hospitals. The influence of unobserved heterogeneity is likely to reflect the impact of omitted variables such as the number of doctors, or the existence of economies of scale or scope. Finally, as stated above, di§erences in productive e¢ciency work in favour of public hospitals (column (c), line (7)). However, the impact on the productivity gap of di§erences in e¢ciency is very limited: + 0.7% only.
Private nonprofit hospitals are not very common in France, unlike the USA. Some people try to promote this type of ownership in France, arguing that it combines flexibility in human resources management, as in the private sector, with an objective function that is compatible with mandates in connection with the public interest (Silber, 2005). Actually, the relative performance of large private nonprofit hospitals with respect to for profit hospitals is about the same as the relative performance of large public hospitals (table 5). The productivity gap is smaller, though still sizeable (- 21.0%, see column (i)).We find that the same factors explain the lower productivity of large nonprofit hospitals: the number of beds, support sta§ in excess, as well as production composition, characterized by a low proportion of surgical stays. One noticeable result is that patient composition tends to improve productivity of large nonprofit hospitals (+ 2.2%, line (3), column (i)), contrary
to what we find for public hospitals. To sum up, large nonprofit hospitals appear quite similar to large public hospitals, except that they benefit from an advantageous patient composition. Since they are not allowed to select patients, other mechanisms must be at work. One explanation could lie in specific links between nonprofit hospitals and some complementary health insurance compagnies, resulting in preferential assignment of their enrollees to nonprofit hospitals. Indeed, optional complementary insurance is subscribed to by higher proportion by high income individuals than low income individuals.
These results are confirmed by an examination of medium size hospitals. In this cate-gory, private nonprofit and for profit hospitals are quite numerous: 40 nonprofit and 234 for profit hospitals are observed, giving robustness to the conclusions drawn above.
The only noticeable di§erence is that the number of beds in public and nonprofit hospi-tals has a lower negative impact: the productivity loss is equal to about 12% (line "beds", columns (b) and (h)).
The performance of small public hospitals is very poor, compared to small private-for-profit hospitals: the productivity gap amouts to - 54.5%! This gap is explained by patient composition (- 25.8%), production characteristics (- 45.7%) and high ine¢ciency (- 34.1%) (table 5, column (a)).
7
Conclusion
The hospital payment reform of 2004 has introduced yardstick competition to provide incentives for e¢ciency in care delivery. Convergence of payments was supposed to establish competition mechanisms between public (or nonprofit) and for profit hospitals, in order to reduce their cost di§erences. The latter might derive from productivity gaps or, for a given level of productivity, from di§erences in input prices. They can also derive from
allocative ine¢ciency when hospitals do not adjust the input proportion in connection to their relative prices. If hospitals are cost e¢cient, di§erences in productivity might result from input price di§erence between sectors (In France nurses’ wages are higher in private than in public hospitals, Aude and Raynaud, 2009). More simply, productivity di§erences can stem from productive ine¢ciency, when actual production is below the production frontier.
Focusing on hospital productivity instead of hospital costs amounts to examining only one cause of cost di§erences between public and private hospitals. However, this approach has two advantages: (i) it makes possible the use of a performance indicator, which is reliable and comparable between private and public hospitals; (ii) contrary to studies on costs, that restrict the analysis to a rather limited hospital subsample, it enables us to use comprehensive administrative data, that represent about 90% of admissions for acute care in France.
We show that the appraisal of productive e¢ciency depends closely on the production frontier specification. With a classical production function linking inputs to output, the estimated e¢ciency rates of public hospitals are lower than those of private nonprofit hospitals, which are themselves lower than the e¢ciency rates of private-for-profit hospitals. This ranking in e¢ciency is observed whatever the size of the establishments. But this ranking is reversed when the frontier specification includes hospital patient and production characteristics. Except for small establishments, public hospitals then appear to be more e¢cient than private-for-profit hospitals. Private nonprofit hospitals are also more e¢cient than for profit hospitals, whatever their size. This result concerning the inversion of the ranking of e¢ciency rates is particularly robust: it is obtained for several specifications of the production function, whether or not teaching hospitals are included, whether or not
physicians are included in the regressors, etc.
These results should be interpreted in the light of the mandates and rules that regulate the activity of public hospitals. It is striking that the ranking in e¢ciency is reversed when patient and production composition is included in the analysis. Indeed, the structure of activity and patient composition are exogenously given for public hospitals, because they have to provide care in relation to needs and are not allowed to select patients.
Our estimates make it possible to assess the components of the productivity di§erences by type of hospital ownership. The lower productivity of public hospitals is mainly explained by an excessive number of beds, an excessive number of support sta§, as well as patient and production composition (in particular, the small proportion of surgical stays). It is not explained by lower e¢ciency.19
The fact that hospital productivity is influenced by patient and production composition is problematic. As a result, the payment reform is likely to encourage public hospitals to manipulate their patient composition and modify the structure of their supply for care. On the basis of our estimates, they should for instance admit less women aged 80 and increase the proportion of surgical stays. In principle, a payment scheme based on yardstick competititon is an instrument to improve productive e¢ciency. It is not supposed to influence allocative e¢ciency. The fee schedule is supposed to reflect costs associated to e¢cient activity. Tari§s are not supposed to be prices that would reflect the social value, or desirability of a stay in a given DRG. Our results suggest that the production function is such that production composition a§ects productivity. In this context, a system based on a prospective payment per stay might be harmful to allocative e¢ciency.
8
References
Aballea, P., Bras, P.-L.and S. Seydoux, 2006. Mission d’appui sur la convergence tarifaire
public privé, rapport IGAS n◦2006 009 http://lesrapports.ladocumentationfrancaise.fr/BRP/064000080/0000.pdf
Aigner, D.J., Lovell, C.A.K. and Schmidt P. (1977) Formulation and Estimation of Stochastic Frontier Production Function Models, Journal of Econometrics, Vol.6, 21-37.
Arnault, S., F. Evain, A. Fizzala and I. Leroux, 2009. L’activité des établissements de santé en 2007 en hospitalisation complète et partielle, Etudes et Résultats n◦ 691, mai.
Aude, J., Raynaud, D., 2009. Les écarts de salaires bruts entre hôpitaux publics et cliniques privées en 2007, Economie Publique, 24-25: 221-247
Battese, G. and Coelli T., 1992. Frontier production functions, technical e¢ciency and panel data: with application to paddy farmers in India., Journal of Productivity Analysis ; 3: 153—169.
Battese, G. and Coelli T., 1995. A model for technical ine¢ciency e§ects in a stochastic frontier production function for panel data. Empirical Economics ; 20:325—332.
Burgess J. F., and P. W. Wilson (1996), Hospital Ownership and Technical Ine¢ciency, Management Science, Vol. 42, No. 1, pp. 110-123
Chalkley, M. and J. M Malcomson, 2000. Government purchasing of health services, in: Culyer A.J. and Newhouse J.P. editors, Handbook of Health Economics, Vol. 1A (North Holland, Amsterdam), Chapter 15, 847-890.
Clark A. E. & Milcent, C., 2011. Public Employment and Political Pressure : The Case of French Hospitals. Journal of Health Economics. 30(5) : 1103-1112.
DHOS 2009. Rapport 2009 au Parlement sur la convergence tarifaire. http://www.sante.gouv.fr/IMG/pdf/Rapport_convergence_2009.pdf
A Multiple Output Analysis, Journal of Health Economics, vol 8: pp 253-270.
Dor, A. and D. E. Farley, 1996 , Payment source and the cost of hospital care: Evidence from a multiproduct cost function with multiple payers, Journal of Health Economics, vol 15: pp 1-21.
Dormont, B. and C. Milcent, 2005. How to Regulate Heterogenous Hospitals ? Journal of Economics and Management Strategy, Vol. 4, # 3, 591-621, 2005.
Ellis, R. P., 1998. Creaming, Dumping, skimping: Provider competition on the inten-sive and exteninten-sive margins, Journal of Health Economics, vol 17: pp 537-555
Farsi, M., Filippini, M., and Kuenzle, M., 2005. Unobserved heterogeneity in stochastic cost frontier models:
an application to Swiss nursing homes. Applied Economics 37, 2127—2141.
Greene, W. 2004. Distinguishing between Heterogeneity and Ine¢ciency: Stochastic Frontier Analysis of the WHO’s Panel Data on National Health Care Systems, Health Economics, Vol 13, Issue 10: pp 959-980
Hart, O., Shleifer, A., Vishny, R.W., 1997. The proper scope of government: theory and an application to prisons. Quarterly Journal of Economics 112 (4), 1127—1162.
HCAAM, 2009. Rapport du Haut Conseil pour l’Avenir de l’Assurance Maladie, sep-tembre. http://www.securite-sociale.fr/IMG/pdf/hcaam_rapport2009.pdf
Jondrow J., Lovell C.A.K.,Materov I.S. and Schmidt P. (1982) On the Estimation of Technical Ine¢ciency in the Stochastic Frontier Production Function Model, Journal of Econometrics, Vol.19, 233-238
Keeler E. B., 1990. What proportion of hospital cost di§erences is justifiable ?, Journal of Health Economics 9(3), 359-365.
hospitals. Health Economics, vol. 17(9), 1057-1071
La§ont J. J. and J. Tirole, 1993. A theory of incentives in procurement and regulation, MIT Press
Lakdawalla, D. and T. Philipson, 2006. The nonprofit sector and industry performance Journal of Public Economics 90, 1681—1698
Lien, H.-M., S.-Y. Chou and J.-T. Liu, 2008. Hospital ownership and performance: Evidence from stroke and cardiac treatment in Taiwan Journal of Health Economics 27, 1208—1223
Linna M., 1998. Measuring hospital cost e¢ciency with panel data models, Health Economics, 7: pp 415-427.
Ma, A. C. T., 1994. Health care payment systems: cost and quality incentives, Journal of Economics and Management Strategy, vol 3, n◦1: pp 93-112
Ma, A. C. T., 1998. Health care payment systems: cost and quality incentives- Reply, Journal of Economics and Management Strategy, vol 7, n◦1: pp 139-142
Newhouse, J.P., 1970. Toward a theory of nonprofit institutions: an economic model of a hospital. American Economic Review 60 (1), 64—74.
Or, Z., 2009. Activity based payment in France. Euro Observer, vol. 11, n◦4, pp 5-6. Picone, G.A., Chou, S.-Y., Sloan, F.A., 2002. Are for profit hospital conversions harm-ful to patients and to medicare? Rand Journal of Economics 33 (3), 507—523.
Pope, G., 1990. Using hospital-specific costs to improve the fairness of prospective reimbursement, Journal of Health Economics, vol 9, n◦3: pp 237-251
Rosko, M. 2001. Cost e¢ciency of US hospital: A Stochastic Frontier Approach, Health Economics, Vol 10: pp 539-551
16: pp 319-327
Silber D. (2005) Hôpital : le modèle invisible, note de l’Institut Montaigne, juin http://www.institutmontaigne.org/medias/documents/hopital_le_modele_invisible.pdf
Sloan, F., 2000. Not-for profit ownership and hospital behavior. In: Culyer, Newhouse (Eds.), Handbook of Health Economics. North Holland.
Sloan, F.A., Picone, G.A., Taylor Jr., D.H., Chou, S.-Y., 2001. Hospital ownership and cost and quality of care: is there a dime’s worth of di§erence? Journal of Health Economics 20 (1), 1—21.
Vita, M. G., 1990. Exploring hospital production relationships with flexible functional forms, Journal of Health Economics, vol. 9(1), pages 1-21.
Wagsta§ A. (1989a) Estimating e¢ciency in the hospital sector: a comparison of three
statistical cost frontiers, Applied Economics, 21, p. 659-672.
Zuckerman S. et al.(1994) Measuring hospital e¢ciency with frontier cost functions, Journal of Health Economics, 13, p. 255-280.
Table 1: Basic feature of the data
Size Ownership Number of Hospitals
Number of beds per hospital Anual number of stays per hospital Share % in total production* [in total stays]
Average LOS* [average median LOS] Number of stays per bed Proportion of surgical stays % Annual production** per bed Small Public 282 45 1,794 [3.0] 2.7 [7.1] 9.3 33 7.9 43,225 NP 72 64 2,499 [1.1] 1.3 [4.6] 6.9 37 20.9 62,405 FP 541 58 2,986 [11.7] 11.1 [2.3] 3.9 54 47.2 73,785 Medium Public 117 151 7,129 [6.9] 6.0 [3.5] 5.4 48 20.5 60,222 NP 40 153 6,811 [2.0] 2.5 [2.5] 4.5 45 29.8 81,914 FP 234 118 6,823 [14.1] 14.3 [1.8] 3.5 60 50.4 87,201 Large Public 243 566 26,865 [53.0] 53.4 [2.7] 5.3 49 18.0 67,390 NP 14 339 15,303 [1.4] 1.6 [2.4] 4.7 47 24.8 78,604 FP 61 201 12,381 [6.7] 7.3 [2.1] 3.8 63 44.6 97,242 Total (7,731 obs1,604 ) 169 8,334 [100.0] 100.0 [3.1] 5.1 50 33.5 70,517
1,604 hospitals 1998-2003, 7,731 observations in the hospital-year dimension
Small hospitals: less than 5,000 discharges per year; Large hospitals: more than 10,000 discharges per year.
*
LOS is measured in days: we provide the mean of the LOS averaged at the hospital level, and the mean of the LOS median, computed at the hospital level.
**
Graph 1
Graph 2
Graph 3
Contribution to hospital care services
0 10 20 30 40 50 60 Public NFP FP Small Medium Large
Productivity: annual number of ISA points (thousand) per bed
0 20 40 60 80 100 120 Public NFP FP Small Medium Large
Proportion of surgical stays
0 10 20 30 40 50 60 Public NFP FP Small Medium Large
Table 2 Organization of hospital staff Size Ownership Number of beds
Total persons /bed Doctors# / bed Nurses/bed Nursing auxiliairy staff/bed Adm.staff/ bed Support staff/bed Small Public 45*** 7.62*** 0.24*** 1.63*** 3.84*** 0.68*** 1.23*** NP 64*** 3.56 0.20*** [0.15 ;0.24 ] 1.10 1.12 0.53*** 0.62 FP 58*** 1.76*** [0.13 ;0.36 ]0.26*** 0.51*** 0.59*** 0.25*** 0.14*** Medium Public 151*** 3.66 0.29** 1.08** 1.33*** 0.38 0.57*** NP 153*** 2.62*** 0.17*** [0.15 ;0.19 ] 0.83*** 0.71*** 0.44** 0.47*** FP 118*** 1.67*** 0.22*** [0.13 ;0.29 ] 0.54*** 0.58*** 0.21*** 0.12*** Large
Public 566(ref) 3.65(ref) 0.32(ref) 1.16(ref) 1.15(ref) 0.39 (ref) 0.63 (ref)
NP 339*** 2.86** 0.13***
[0.11 ; 0.14] 0.95** 0.77* 0.47** 0.55
FP 201*** 1.91*** 0.27***
[0.17 ;0.35 ] 0.63*** 0.65*** 0.21*** 0.14***
Total 169 3.14 0.26 0.87 1.23 0.35 0.44
1,604 hospitals 1998-2003, 7,731 observations in the hospital-year dimension
The difference with the average level in large public hospitals is significant 1% (***),5% (**),10% (*)
# Doctors are observed on a sub sample of 1,169 hospitals only (5,798 observations on 1998-2003). For private hospitals (for profit and non profit) part-time doctors are supposed to work half time (coefficient 0.5). Between brackets is given the range obtained with two other hypotheses: coefficients 0.1 and 0.8.