HAL Id: hal-02476328
https://hal.archives-ouvertes.fr/hal-02476328
Submitted on 26 May 2020
HAL is a multi-disciplinary open access archive for the deposit and dissemination of sci-entific research documents, whether they are pub-lished or not. The documents may come from teaching and research institutions in France or abroad, or from public or private research centers.
L’archive ouverte pluridisciplinaire HAL, est destinée au dépôt et à la diffusion de documents scientifiques de niveau recherche, publiés ou non, émanant des établissements d’enseignement et de recherche français ou étrangers, des laboratoires publics ou privés.
Distributed under a Creative Commons Attribution - NonCommercial - NoDerivatives| 4.0 International License
Spatial distribution of starch, proteins and lipids in
maize endosperm probed by scanning transmission
X-ray microscopy
Camille Rivard, Benedicte Bakan, Claire Boulogne, Khalil Elmorjani, Sufal
Swaraj, Rachid Belkhou, Didier Marion
To cite this version:
Camille Rivard, Benedicte Bakan, Claire Boulogne, Khalil Elmorjani, Sufal Swaraj, et al.. Spatial distribution of starch, proteins and lipids in maize endosperm probed by scanning transmission X-ray microscopy. Journal of Spectral Imaging, 2019, 8, pp.1-8. �10.1255/jsi.2019.a21�. �hal-02476328�
Correspondence
Camille Rivard (camille.rivard@synchrotron-soleil.fr) and Didier Marion (didier.marion@inra.fr) Received: 13 March 2019 Revised: 20 October 2019 Accepted: 4 November 2019 Publication: 13 November 2019 doi: 10.1255/jsi.2019.a21 ISSN: 2040-4565 Citation
C. Rivard, B. Bakan, C. Boulogne, K. Elmorjani, S. Swaraj, R. Belkhou and D. Marion, “Spatial distribution of starch, proteins and lipids in maize endosperm probed by scanning transmission X-ray microscopy”, J. Spectral Imaging 8, a21 (2019). https://doi.org/10.1255/jsi.2019.a21
© 2019 The Authors
This licence permits you to use, share, copy and redistribute the paper in any medium or any format provided that a full citation to the original paper in this journal is given, the use is not for commercial purposes and the paper is not changed in any way.
In thIs Issue:
spectral preprocessing to compensate for packaging film / using neural nets to invert the PROSAIL canopy model
JOURNAL OF
SPECTRAL
IMAGING
Short Communication openaccess Special Issue on Spectral Imaging in Synchrotron Light FacilitiesSpatial distribution of starch, proteins
and lipids in maize endosperm probed by
scanning transmission X-ray microscopy
Camille Rivard,a,* Benedicte Bakan,b Claire Boulogne,c Khalil Elmorjani,d Sufal Swaraj,e Rachid Belkhouf and
Didier Mariong,*
aDPT CEPIA, INRA, 44316 Nantes, France and Synchrotron SOLEIL, 91190 Gif-sur-Yvette, France. E-mail: camille.rivard@synchrotron-soleil.fr,
https://orcid.org/0000-0001-5601-1989
bBIA, INRA, 44316 Nantes, France. https://orcid.org/0000-0001-9088-1232
cI2BC, CEA, CNRS, Univ. Paris-Sud, Univ. Paris-Saclay, 91198 Gif-sur-Yvette, France. https://orcid.org/0000-0001-9633-9807 dBIA, INRA, 44316 Nantes, France
eSynchrotron SOLEIL, 91190 Gif-sur-Yvette, France. https://orcid.org/0000-0001-7351-2320 fSynchrotron SOLEIL, 91190 Gif-sur-Yvette, France. https://orcid.org/0000-0002-2218-7481
gBIA, INRA, 44316 Nantes, France. E-mail: didier.marion@inra.fr, https://orcid.org/0000-0002-0672-6545
The main storage components of the maize endosperm are starch, proteins and lipids. Starch and proteins are heterogeneously deposited, leading to the formation of vitreous and floury regions at the periphery and at the centre of the endosperm. The vitreous/floury mass ratio is a key physi-cal parameter of maize end-uses for the food, feed and non-food sectors, as well as for the resistance of seeds to environmental aggressions. To improve maize breeding for vitreousness, one of the main issues is to finely delineate the molecular and physicochemical mechanisms associated with the formation of endosperm texture. In this context, we use scanning transmission X-ray microscopy at the C K-edge on maize endosperm resin-embedded ultrathin sections. The combination of local near edge X-ray absorption fine structure (NEXAFS) spectroscopy and high-resolu-tion images enable us to achieve a quantitative fine descriphigh-resolu-tion of the spatial distribuhigh-resolu-tion of the main components within the endosperm.
Keywords: carbon, lipid, starch granule, protein, soft X-ray imaging and spectroscopy, STXM
Introduction
The multiple end-uses of maize crops are, in part, based on the assembly of the main storage components of the endosperm, i.e. starch and proteins (zeins). Indeed, starch and proteins are heterogeneously deposited leading to the formation of vitreous (endosperm periphery) and floury
regions (endosperm centre). Vitreousness determines the food and feed quality of maize and is also important for the resistance of seeds to environmental biotic and abiotic stresses.1 The molecular and physicochemical basis of
2 Spatial Distribution of Starch, Proteins and Lipids in Maize Endosperm by Scanning Transmission X-Ray Microscopy
for commercial inbred lines.2–4 Using Raman
microspec-trometry3 and matrix-assisted laser desorption/ionisation
(MALDI) mass spectrometry imaging,4 it was shown that
vitreousness follows the gradient from the periphery to the centre of the endosperm that is related to starch, protein and lipid gradients. Indeed, starch content and crystallinity increase from the periphery to the centre of the endosperm, while the protein content is higher at the periphery than in the centre. Starch crystallinity gradients are well related to changes in the amylose and amylopectin (the linear and branched carbohydrate polymers of starch granules, respectively) mass ratio, and to changes in contents and composition of lipids embedded in starch granules. These starch-bound lipids are composed of free fatty acids and lysophosphati-dylcholine (lysoPC) that are complexed with amylose helices.5 By MALDI imaging we also observed a gradient
of lysoPC from the periphery to the endosperm centre.4
These results obtained by different techniques suggest that the distribution of carbon (C) between starch poly-saccharides, proteins and lipids controls the packing of the endosperm starch–protein matrix and, therefore, are closely related to the endosperm vitreousness. However, any of the techniques used in these studies could high-light the spatial distribution of the key components at a high spatial resolution.
C K-edge near edge X-ray absorption fine structure (NEXAFS) spectromicroscopy on a scanning transmis-sion X-ray microscope is well suited to the study of the carbonated molecules with a spatial resolution down to 30 nm and without any labelling agents. This tech-nique has been used in biology for the characterisation of proteins and DNA in chromosomes,6–8 in wood and
lignified plants,9,10 in modern and fossil sporoderms,11
and in bones and teeth.12 Some studies were dedicated
to C characterisation in cells or soft tissues, such as the mapping of the matrix of microbial biofilms and standard lipid proteins,13 the mapping of C. crescentus cells,14 the
modification of polysaccharides in vascular plant cell walls,15 the mapping of vascular smooth muscle cells,16
the determination and location of plant biopolymers in lentils and wheat grain17 or the mapping of proteins in
amyloid plaques correlated with Alzheimer’s disease.18
In the present communication we use scanning trans-mission X-ray microscopy (STXM) at the C K-edge to determine the spatial distribution of the three main components of maize endosperm to better understand the heterogeneity of endosperm composition.
Material and methods
Sample preparation
Maize grains were supplied by Limagrain Europe (Saint-Beauzire, France) and reference samples were purified by the INRA-BIA laboratory (Nantes, France) from these maize grains (lipids) or from commercial products (starch and proteins) according to the procedure described in References 3, 4 and 19. Zeins, the main maize endosperm proteins representing about 80 % of the total proteins, were used as reference proteins. Crude zeins (Sigma-Aldrich, France) were solubilised in ethanol 70 % in water and precipitated with acetone at –20 °C. After centrifugation at 8000 g the zein sediment was dispersed in deionised water and freeze-dried. Crude starch (Sigma-Aldrich, France) was washed for 1 h with 70 % ethanol, then twice with deion-ised water and freeze-dried. Starch was cryo-ground after extraction in order to obtain enough thin fragments for X-ray transmission measurements. Lipids were extracted from endosperm flour with 2-propanol and chloroform-methanol 2 : 1 (v : v) and finally purified by phase parti-tioning in chloroform-methanol-NaCl 1 % as previously described.4 After drying, maize lipids were fractionated on
a silica solid phase extraction cartridge (500 mg, SupelClean LC-Si, Supelco, USA) by eluting successively the column with chloroform-acetic acid 1 % (non-polar lipids), acetone (glycolipids) and methanol (phospholipids).4 Each lipid
frac-tion is a mixture of different molecules sharing structure similarities. For example, glycolipids are mainly composed of galactosyldiacylglycerol, non-polar lipids are composed of triacylglycerols and phospholipids of phosphatidylcho-line.4 Nevertheless, in each fraction, the proportion of the
different molecules reflects the proportion of these mole-cules in the corresponding maize endosperms. Starch lipids were extracted from the freeze-dried maize starch with hot 80 % 1-propanol in water and purified by phase partitioning in chloroform–methanol–NaCl 1 %. These lipids are mainly composed of free fatty acids and lysophosphatidylcho-line.4 The reference samples were dissolved or dispersed
in appropriate solvent (water, ethanol or chloroform, as a function of the reference), adapting the concentration for each reference to obtain a thin and homogeneous deposit after droplet deposition onto a Si3N4 window (50 nm
thicknesses, 0.5 × 0.5 mm2 area, Norcada Inc., Edmonton,
Canada) and air-dried. Ultrathin sections of maize grains on grids were prepared at Imagerie Gif platform following the protocol described in Table 1.
The grids and the Si3N4 windows were mounted on the
micro-scope and pre-screened using an optical micromicro-scope to select the areas of interest. The sample holder was then placed in the experimental scanning transmission X-ray microscope chamber and pumped down to 10–2 mbar.
C K-edge NEXAFS spectra collection
The micro-spectroscopic data were collected on the scanning transmission X-ray microscope end-station of the HERMES beamline (SOLEIL synchrotron), a particu-larly well-adapted beamline for carbon K-edge investiga-tions.20,21 The X-ray beam was focused to 38 nm using
a 30 nm Fresnel zone plate and the transmission signal was collected using a photomultiplier tube. The C1s→π* transition in the NEXAFS spectra of a PC71BM sample22
at 284.43 eV was used for energy calibration. The stacks of images were collected on fields of view from 8 µm to 15 µm large, scanning the sample with 50 nm steps in both horizontal and vertical directions at each energy increment over the energy range of C K-edge. Each stack was composed of 165 images, covering the energy range between 270 eV and 350 eV, with a sampling step set of 1 eV from 270 eV to 280 eV, 0.2 eV from 280 eV to 283 eV, 0.08 eV from 283 eV to 290 eV (the edge region) and 1.2 eV from 290 eV to 350 eV.
C K-edge NEXAFS data analyses
The stack of images was analysed using aXis2000 (http:// unicorn.mcmaster.ca/aXis2000.html)23 and Mantis
(http://spectromicroscopy.com)24 software. The images
were aligned using the alignment routine of the Stack
Analyze program (Jacobsen/Stony Brook). The transmis-sion images were then converted into optical density (OD) scales according to the following equation: OD = –ln(I/
I0) = σt = µρt, where I0 represents the incident X-ray flux
measured on a free area of the sample holder, I represents the measured transmitted intensity at the pixel of interest,
σ is the linear absorption coefficient, t is the thickness, µ
is the mass absorption coefficient and ρ is the density. An image taken before the edge is considered as background and subtracted from the others. Principal component analysis (PCA) was applied on stacks of images using Mantis software and the number of principal components (PC) was determined based on the recommendations for STXM analyses.25 Cluster analyses (CA) and non-negative
matrix approximation (NNMA) routines were conducted using Mantis default settings and using the PC number previously determined. For NNMA, the initial spectra were the cluster spectra found in the CA. Quantitative component images were produced using the singular value decomposition linear regression procedure with starch, zeins and lipids as reference spectra. RGB images were plotted using Fiji software.26
Results and discussion
References spectra
The C K-edge NEXAFS spectra collected on purified references evidence specific features useful to discrimi-nate the three main components of maize endosperm, i.e. Step Chemical products and equipment
Cylinder volume (1.2 mm in diameter, 400 µm in height) extraction from maize grain endosperm
VT1200S vibratome, Leica Microsystems Whatman WB100028 punch Uni-Core
400 µm-flat specimen carriers 16706899, Leica Microsystems High pressure freezing EM PACT2, Leica Microsystems
n using Dextran cryoprotectant, 31389, Sigma
n or without Dextran
Cryo-substitution EM AFS2 and FSP, Leica Microsystems
n using HM20 acrylate resin, 14345, EMS
n or using glycidyl methacrylate resin, 868-77-9, Spi CHEM
Resin polymerisation n –45 °C for 48 h then 0 °C for 28 h under ultraviolet light for HM20
n –30 °C during 24 h using 15 µL of N,N-dimethyl-p-toluidine, Merck 8.22040.0005 for 5 mL of resin, for GMA
100 nm thick ultrathin sectioning Ultramicrotome UC6, Leica Microsystems Ultrathin sections deposition on grids Uncoated Cu grids, G2375C, Agar Scientific
4 Spatial Distribution of Starch, Proteins and Lipids in Maize Endosperm by Scanning Transmission X-Ray Microscopy
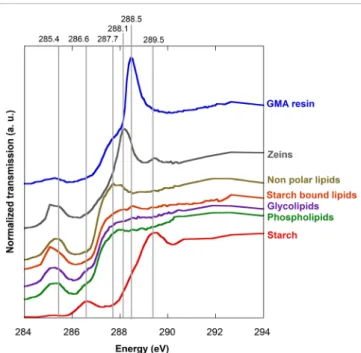
starch, proteins (zeins) and lipids (Figure 1). The starch spectrum displays a broad white line centred on 289.5 eV and a pre-edge at 286.6 eV.These features are in agree-ment with the published spectrum of wheat starch.17 The
edge of the zein spectrum is shifted towards lower
ener-gies in comparison to starch, with an intensive feature at 288.1 eV corresponding to the amide carbonyl group (peptide bond in proteins). In the post-edge region of the zeins spectrum, a peak occurs at 289.5 eV, as observed in the albumin spectrum.13,18 The edge position of the
three types of lipids display similar positions (around 287 eV) and are even more shifted toward lower energies in comparison to starch and zein edge spectra. The large pre-edges of lipids between 284.9 eV and 285.5 eV are superimposed on the zein pre-edge. The non-polar lipids display a broad white line at 287.7 eV, whereas the other analysed lipids do not evidence this pronounced peak. The GMA resin evidenced a white line at 288.5 eV with a
pre-edge shoulder around 287.7 eV.
Effect of resin on spectrum acquisition
Studies of plant tissues at the C K-edge, and thus the protocols of preparation of plant tissues have been poorly documented in the literature. Our samples were prepared using two types of resins and with or without Dextran, a cryo-protectant commonly used for the preparation of transmission electron microscopy samples during cryo-plunge to reduce crystallisation and better preserve the samples’ structures. The energy stack recorded on samples embedded in the HM20 resin evidenced radiation damage due to carbon deposition on the surface area of samples and leading to the visual blackening of the surface area and to a flattening of the C
Figure 1. C K-edge NEXAFS spectra of the set of refer-ences and of the resin. For clarity the spectra were shifted vertically to avoid superimposition. Grey lines corresponding to the energies of the single energy images in Figure 2.
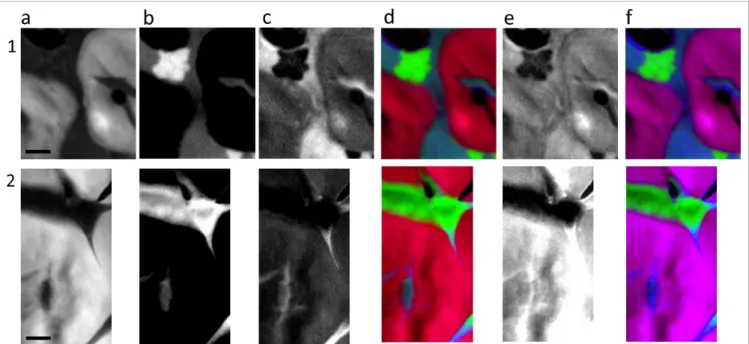
Figure 2. OD STXM images at the C K-edge of two parts of the maize endosperm (stacks 1 and 2) of a: before the edge (275.5 eV); b: lipids-zeins pre-edge (285.4 eV); c: starch pre-edge (286.6 eV); d: lipids white line (287.7 eV); e: zeins white line (288.1 eV); f: resin white line (288.5 eV); and g: starch white line (289.5 eV). White and black areas correspond to high and low X-ray absorption, respectively. Scale bar is 2 µm.
K-edge spectra (not shown). This radiation damage effect is enhanced by the use of Dextran. By contrast, no such effects have been observed on the samples embedded in the GMA resin without Dextran. The results presented hereafter were obtained with the latter sample prepara-tion procedure.
Stack analyses
The single energy images extracted from the stacks show the contrast resulting from the C composition hetero-geneity of the sample (Figure 2). The white areas on Figure 2c, d and e evidence the location of starch, lipids and zeins, respectively. Figure 2b, recorded at 285.4 eV corresponds to a combination of lipids and zeins
distribu-tions (the image appears as a combination of the images of Figure 2d and e), the pre-edges of these two species being at the same energy position (Figure 1). Figure 2f, corresponding to the resin intensive feature energy, shows a relatively low contrast in the image resulting from the contribution of almost all the constituents of the preparation, including resin, except for the two holes which appear totally black. Figure 2g is supposed to correspond to the starch distribution, but at this energy all the species, including resin, contribute to the starch signal scrambling.
To limit artefacts resulting from the presence of the resin, PCA, CA and NNMA analyses were conducted on the stacks of images in the energy range from 283.6 eV
Figure 3. Statistical analyses. a: composite cluster images; b: corresponding spectra (colour of the spectra corresponds to colour on the image a); c: NNMA spectra; d: corresponding NNMA images; and e: comparison between reference spectra, CA and NNMA spectra. In d, white and black areas correspond to high and low X-ray absorption respectively. Scale bar is 2 µm.
6 Spatial Distribution of Starch, Proteins and Lipids in Maize Endosperm by Scanning Transmission X-Ray Microscopy
to 288.3 eV (cutting just after the zein white line) only. Five and seven PCswere obtained by PCA analyses for stack 1 and 2, respectively. Among the spectra obtained with CA, only three types of spectra describe all the voxels of the stack of images, holes excluded (sp5 in stack 1) as sp1 and 2 for stack 1, sp1, 2, 3 and 5 for stack 2 and sp4 and 6 for stack 2 are considered as the same shape, the variation only comes from a slight variation of intensity (Figure 3a and b). As for CA, some spectra obtained using NNMA routines can be considered as similar; the resulting components images stack 1 sp1 and sp2 and stack 2 sp1, sp2 and sp3, describe the same area (Figure 3d) and correspond to the spatial distribution of starch (Figure 3e). The sp4 stack 1 components image evidences specific features not visible on CA images such as the white patch visible on Figure 2e, stack 1. The corresponding spectra sp4 shows a large double
peak between 285 eV and 286 eV and a sharp peak at 288.1 eV. These features are characteristic of zeins refer-ence spectra (Figure 1 and 3e).
Figure 4 shows components images of each of the spectral reference components (starch, zeins, non-polar lipids and starch bound lipids) and the resulting RGB composite images. As expected, starch appears
only localised in the large spherical grains (Figure 4a). Zeins are localised in well-defined round glob-ules (Figure 4b, stack 1) or distributed in all the inter-starch grain space as a function of the area of the endosperm investigated (Figure 4b, stack 2). Non-polar lipids are mainly detected in the inter-starch grains space with more or less abundance as a function of the area of the endosperm. They are also detected in the centre of the starch grains (Figure 4c). The starch grains do not appear totally lacking in lipids (Figure 4c) and interestingly, when fitting the stack of images using starch bound lipids (Figure 4f), significantly higher amounts of starch bound lipids are detected co-localised with starch in comparison to fitting with polar lipids. Moreover, the different nuances of the red and of the violet of the starch grains in the RGB images (Figure 4d and f, respectively) between the two stacks of the endosperm clearly evidence a differ-ence of composition with a higher starch/lipids ratio for stack 1 than for stack 2. All the features evidenced though CA and NNMA images were also observed in these distribution maps, validating our assumption that our selected references are able to describe all the features observed in the C K-edge spectra.
Figure 4. Components images of two parts of the maize endosperm (stacks 1 and 2). a: starch; b: zeins; c: non-polar lipids; d: RGB starch (red), zeins (green), non-polar lipids (blue) images; e: starch bound lipid; and f: RGB starch (red), zeins (green), starch bound lipids (blue) image. Scale bar is 2 µm. For a to c and e, white and black areas correspond to high and low abundance, respectively. Intensity grey scale is similar for both parts for each molecule. Colour scale is similar for both parts for each molecule.
Conclusion
These investigations strongly confirm the feasibility of discriminating the three main components in maize endosperm using C K-edge STXM spectromicroscopy, even on resin-impregnated samples and without any staining. As the samples were prepared and analysed under identical conditions, the proportions of the compo-nent obtained in the compocompo-nents images of several samples can be directly quantitatively compared. The spectral images with 38 nm spatial resolution make it possible to discriminate, locate and quantify starch, zeins and lipids as well as the different types of lipids. The next step of this work is to analyse several areas in the vitreous and floury parts in endosperm to be able to quantify, with statistical information, the evolution in terms of main components and distribution to better understand the evolution in between vitreous and floury parts.
Acknowledgements
The authors would like to thank Frédéric Jamme and Pierre Legrand for their encouragement in exploring soft X-ray capabilities for biological samples. We acknowl-edge SOLEIL for provision of synchrotron radiation facili-ties through the proposal 20161149.
References
1. S. Tamagno, I.A. Greco, H. Almeida and L. Borrás,
“Physiological differences in yield related traits between flint and dent Argentinean commercial maize genotypes”, Eur. J. Agron. 68, 50 (2015).
https://doi.org/10.1016/j.eja.2015.04.001
2. M. Gayral, B. Bakan, M. Dalgalarrondo, K. Elmorjani,
C. Delluc, S. Brunet, L. Linossier, M.-H. Morel and D. Marion, “Lipid partitioning in maize (Zea mays L.) endosperm highlights relationships among starch lipids, amylose, and vitreousness”, J. Agric. Food
Chem. 63(13), 3551 (2015). https://doi.org/10.1021/ acs.jafc.5b00293
3. M. Gayral, C. Gaillard, B. Bakan, M. Dalgalarrondo,
K. Elmorjani, C. Delluc, S. Brunet, L. Linossier, M.-H. Morel and D. Marion, “Transition from vitreous to floury endosperm in maize (Zea mays L.) kernels is related to protein and starch gradients”, J. Cereal
Sci. 68, 148 (2016). https://doi.org/10.1016/j. jcs.2016.01.013
4. M. Gayral, M. Fanuel, H. Rogniaux, M. Dalgalarrondo,
K. Elmorjani, B. Bakan and D. Marion, “The spatio-temporal deposition of lysophosphatidylcholine within starch granules of maize endosperm and its relationships to the expression of genes involved in endoplasmic reticulum–amyloplast lipid trafficking and galactolipid synthesis”, Plant Cell Physiol. 60(1), 139 (2019). https://doi.org/10.1093/pcp/pcy198
5. S. Pérez and E. Bertoft, “The molecular structures
of starch components and their contribution to the architecture of starch granules: a comprehensive review”, Starch - Stärke 62(8), 389 (2010). https://doi. org/10.1002/star.201000013
6. S. Williams, X. Zhang, C. Jacobsen, J. Kirz, S. Lindaas,
J.V. Hof and S.S. Lamm, “Measurements of wet metaphase chromosomes in the scanning trans-mission X-ray microscope”, J. Microsc. 170(2), 155 (1993). https://doi.org/10.1111/j.1365-2818.1993. tb03335.x
7. H. Ade, X. Zhang, S. Cameron, C. Costello, J. Kirz
and S. Williams, “Chemical contrast in X-ray micros-copy and spatially resolved XANES spectrosmicros-copy of organic specimens”, Science 258(5084), 972 (1992).
https://doi.org/10.1126/science.1439809
8. Z. Yangquanwei, S. Neethirajan and C. Karunakaran,
“Cytogenetic analysis of quinoa chromosomes using nanoscale imaging and spectroscopy techniques”,
Nanoscale Res. Lett. 8(1), 463 (2013). https://doi. org/10.1186/1556-276X-8-463
9. G.D. Cody, “Probing chemistry within the membrane
structure of wood with soft X-ray spectral micros-copy”, in AIP Conference Proceedings 507, 307 (2000).
https://doi.org/10.1063/1.1291162
10. C.K. Boyce, G.D. Cody, M.L. Fogel, R.M. Hazen,
C.M.O. Alexander and A.H. Knoll, “Chemical evi-dence for cell wall lignification and the evolution of tracheids in early Devonian plants”, Int. J. Plant Sci. 164(5), 691 (2003). https://doi.org/10.1086/377113
11. S. Bernard, K. Benzerara, O. Beyssac, G.E. Brown,
L.G. Stamm and P. Duringer, “Ultrastructural and chemical study of modern and fossil sporoderms by scanning transmission X-ray microscopy (STXM)”,
Rev. Palaeobot. Palynol. 156(1), 248 (2009). https:// doi.org/10.1016/j.revpalbo.2008.09.002
12. J. Cosmidis, K. Benzerara, N. Nassif, T. Tyliszczak
8 Spatial Distribution of Starch, Proteins and Lipids in Maize Endosperm by Scanning Transmission X-Ray Microscopy
biological materials by scanning transmission X-ray microscopy (STXM) at the Ca L2,3-, P L2,3- and C K-edges”, Acta Biomater. 12, 260 (2015). https://doi. org/10.1016/j.actbio.2014.10.003
13. J.R. Lawrence, G.D.W. Swerhone, G.G. Leppard,
T. Araki, X. Zhang, M.M. West and A.P. Hitchcock, “Scanning transmission X-ray, laser scanning, and
transmission electron microscopy mapping of the exopolymeric matrix of microbial biofilms”, Appl.
Environ. Microbiol. 69(9), 5543 (2003). https://doi. org/10.1128/AEM.69.9.5543-5554.2003
14. K. Benzerara, T.H. Yoon, T. Tyliszczak, B. Constantz,
A.M. Spormann and G.E. Brown, “Scanning trans-mission X-ray microscopy study of microbial calci-fication”, Geobiology 2(4), 249 (2004). https://doi. org/10.1111/j.1472-4677.2004.00039.x
15. G.D. Cody, J. Brandes, C. Jacobsen and S. Wirick,
“Soft X-ray induced chemical modification of poly-saccharides in vascular plant cell walls”, J. Electron
Spectrosc. Relat. Phenom. 170(1–3), 57–64 (2009).
https://doi.org/10.1016/j.elspec.2008.09.007
16. J. Sedlmair, S.-C. Gleber, S.Ö. Mert, M. Bertilson,
O. von Hofsten, J. Thieme and T. Pfohl, “Imaging of vascular smooth muscle cells with soft X-ray spec-tromicroscopy”, Microsc. Microanal. 17(6), 991 (2011).
https://doi.org/10.1017/S1431927611012165
17. C. Karunakaran, C.R. Christensen, C. Gaillard, R.
Lahlali, L.M. Blair, V. Perumal, S.S. Miller and A.P. Hitchcock, “Introduction of soft X-ray spectromi-croscopy as an advanced technique for plant biopol-ymers research”, PLoS ONE 10(3), e0122959 (2015).
https://doi.org/10.1371/journal.pone.0122959
18. N.D. Telling, J. Everett, J.F. Collingwood, J. Dobson,
G. van der Laan, J.J. Gallagher, J. Wang and A.P. Hitchcock, “Iron biochemistry is correlated with amyloid plaque morphology in an established mouse model of Alzheimer’s disease”, Cell Chem. Biol. 24(10), 1205 (2017).
https://doi.org/10.1016/j.chem-biol.2017.07.014
19. M. Gayral, K. Elmorjani, M. Dalgalarrondo, S.M.
Balzergue, S. Pateyron, M.-H. Morel, S. Brunet,
L. Linossier, C. Delluc, B. Bakan and D. Marion, “Responses to hypoxia and endoplasmic reticulum
stress discriminate the development of vitreous and floury endosperms of conventional maize (Zea mays) inbred lines”, Front. Plant Sci. 8, 557 (2017). https:// doi.org/10.3389/fpls.2017.00557
20. R. Belkhou, S. Stanescu, S. Swaraj, A. Besson, M.
Ledoux, M. Hajlaoui and D. Dalle, “HERMES: a soft X-ray beamline dedicated to X-ray microscopy”, J.
Synchrotron Radiat. 22(4), 968 (2015). https://doi. org/10.1107/S1600577515007778
21. S. Swaraj, R. Belkhou, S. Stanescu, M. Rioult, A.
Besson and A.P. Hitchcock, “Performance of the HERMES beamline at the carbon K-edge”, J. Phys.
Conf. Ser. 849(1), 012046 (2017). https://doi. org/10.1088/1742-6596/849/1/012046
22. B. Watts, S. Swaraj, D. Nordlund, J. Lüning and
H. Ade, “Calibrated NEXAFS spectra of common conjugated polymers”, J. Chem. Phys. 134(2), 024702 (2011). https://doi.org/10.1063/1.3506636
23. A.P. Hitchcock, “Soft X-ray spectromicroscopy of
polymers and bipolymer interfaces”, J. Synchrotron
Radiat. 8(Pt 2), 66 (2001). https://doi.org/10.1107/ S0909049500016447
24. M. Lerotic, R. Mak, S. Wirick, F. Meirer and C.
Jacobsen, “MANTiS: a program for the analysis of X-ray spectromicroscopy data”, J. Synchrotron
Radiat. 21(5), 1206 (2014). https://doi.org/10.1107/ S1600577514013964
25. M. Lerotic, C. Jacobsen, T. Schäfer and S. Vogt,
“Cluster analysis in soft X-ray spectromicroscopy”,
Ultramicroscopy (100), 35 (2004). https://doi. org/10.1016/j.ultramic.2004.01.008
26. J. Schindelin, I. Arganda-Carreras, E. Frise, V. Kaynig,
M. Longair, T. Pietzsch, S. Preibisch, C. Rueden, S. Saalfeld, B. Schmid, J.-Y. Tinevez, D.J. White, V. Hartenstein, K. Eliceiri, P. Tomancak and A. Cardona, “Fiji: an open-source platform for biological-image
analysis”, Nat. Methods 9(7), 676 (2012). https://doi. org/10.1038/nmeth.2019