Fire resistance behaviour of lightweight framed construction
Texte intégral
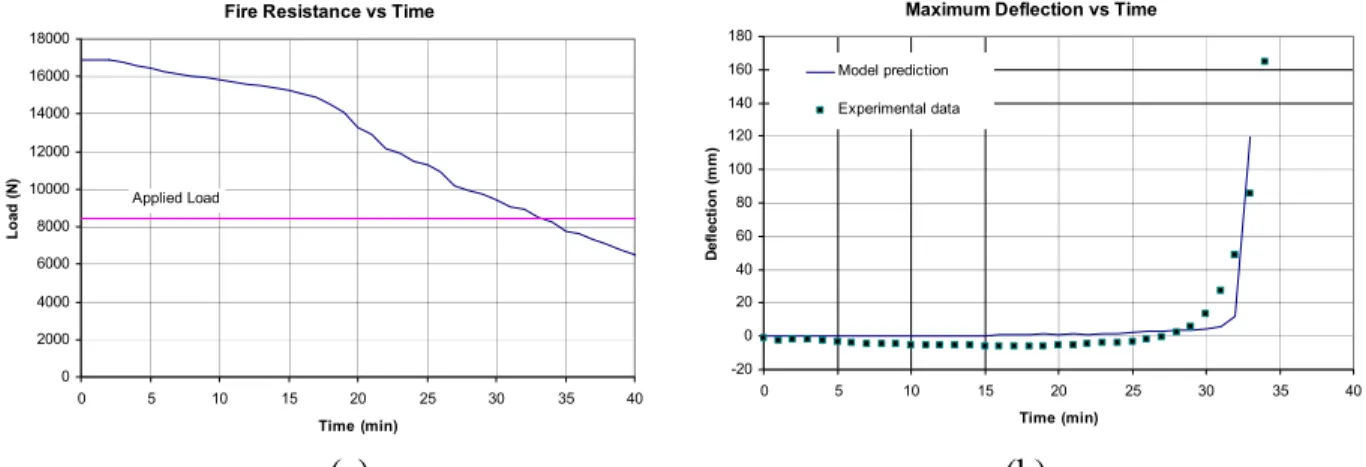
Figure
![Table 1. Wall assembly parameters and fire resistance test results [3] and [4]](https://thumb-eu.123doks.com/thumbv2/123doknet/14190507.477925/5.1188.106.1090.144.647/table-wall-assembly-parameters-resistance-test-results.webp)
![Table 2. Floor Assembly Parameters and Fire Resistance Test Results [5] and [6]](https://thumb-eu.123doks.com/thumbv2/123doknet/14190507.477925/6.1188.107.1117.139.661/table-floor-assembly-parameters-resistance-test-results.webp)

![Table 4 lists predictions for Tests 16 and 17 based on measured temperature histories, and also, based on histories obtained from heat transfer simulations [8]](https://thumb-eu.123doks.com/thumbv2/123doknet/14190507.477925/17.918.104.816.863.1048/predictions-measured-temperature-histories-histories-obtained-transfer-simulations.webp)

Documents relatifs
4 School of Physics State Key Laboratory of Nuclear Physics and Technology, Peking University,
Ces scénarios n’ont pas pu être implémentés pendant le projet Régal, mais les acteurs des chaines d’approvisionnement ont indiqué une préférence pour les scénarios
Type Interval Population effective sizes of the ancestral population N Uniform {10–100 000} Population leading to Brazilian population founder event NOb Uniform {10–100 000}
The amplification signals, GP, 59ETS, ITS1, ITS2, 39ETS and Sal1-2 were proportionally dependent on the amount of a-AtNUC-L1 antibodies added to the ChIP fraction (lanes 1 to
Multiple endocrine neoplasia syndrome type 1 (MEN1), which is secondary to mutation of the MEN1 gene, is a rare autosomal-dominant disease that predisposes mutation carriers
Our Baseline and Low-oil-price scenarios assume domestic tariffs remaining constant relative to the price of the imported non-energy good (see Annex B for indexation
Cette fonction morale et politique du mélodrame classique est assumée expli- citement par son créateur dans le discours qui encadre la publication de son œuvre théâtrale sous
One particular problem is context interchange, whereby each source of information and potential receiver of that information may operate with a different context, leading to
