Publisher’s version / Version de l'éditeur:
Vous avez des questions? Nous pouvons vous aider. Pour communiquer directement avec un auteur, consultez la
première page de la revue dans laquelle son article a été publié afin de trouver ses coordonnées. Si vous n’arrivez pas à les repérer, communiquez avec nous à PublicationsArchive-ArchivesPublications@nrc-cnrc.gc.ca.
Questions? Contact the NRC Publications Archive team at
PublicationsArchive-ArchivesPublications@nrc-cnrc.gc.ca. If you wish to email the authors directly, please see the first page of the publication for their contact information.
https://publications-cnrc.canada.ca/fra/droits
L’accès à ce site Web et l’utilisation de son contenu sont assujettis aux conditions présentées dans le site LISEZ CES CONDITIONS ATTENTIVEMENT AVANT D’UTILISER CE SITE WEB.
Internal Report (National Research Council of Canada. Institute for Research in Construction), 1992
READ THESE TERMS AND CONDITIONS CAREFULLY BEFORE USING THIS WEBSITE.
https://nrc-publications.canada.ca/eng/copyright
NRC Publications Archive Record / Notice des Archives des publications du CNRC :
https://nrc-publications.canada.ca/eng/view/object/?id=4978805f-ac85-4d07-89e1-14b914c6960f https://publications-cnrc.canada.ca/fra/voir/objet/?id=4978805f-ac85-4d07-89e1-14b914c6960f
NRC Publications Archive
Archives des publications du CNRC
For the publisher’s version, please access the DOI link below./ Pour consulter la version de l’éditeur, utilisez le lien DOI ci-dessous.
https://doi.org/10.4224/20374933
Access and use of this website and the material on it are subject to the Terms and Conditions set forth at Assessment of the Thermal Performance of the NVLAP Round Robin Wall Specimen in IRC's Guarded Hot Box Facilities
ASSESSMENT OF THE THERMAL PERFORMANCE OF THE NVLAP ROUND ROBIN WALL SPECIMEN IN IRC'S GUARDED HOT BOX FACILITIES 1.0 SUMMARY
The
NVLAP
(National Voluntary Laboratory Accreditation Program)/C-236 Round Robin has two purposes. It serves as an accreditation test for NVLAP Laboratories and provides more data for a precision and bias statement for the C-236 standard. The thermal performance of a standard test specimen was determined in the two guarded hot box facilities at the Institute for Research in Construction, National Research Council Canada ( I R W C C ) . The tests were performed under ASTM designation C-236 set by the American Society for Testing and Materials.The thermal resistance of the test specimen was measured at four different temperature conditions in the guarded hot box that is generally used to test walIs (South box). The specimen was then tested in the guarded hot box generally used to test windows (North box) where three of the South box test conditions were repeated.
2.0 TEST SPECIMEN
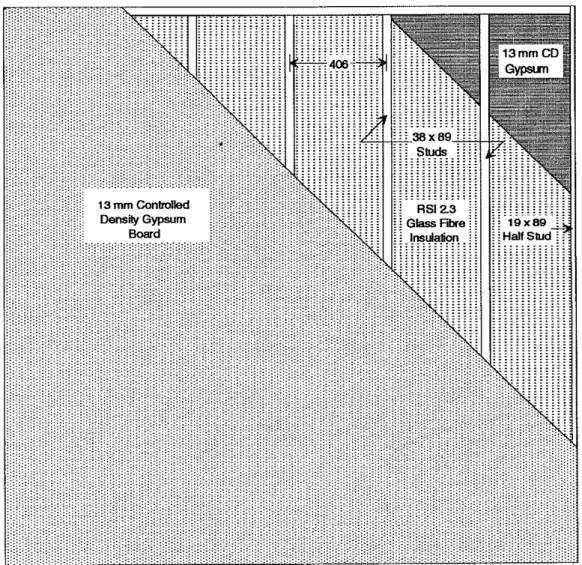
The test specimen (Figure 1) was constructed to the guidelines set by Rollin Inc., the NVLAP round robin coordinator. The test specimen was a 38 mm by 89 mm wood stud construction containing unfaced RSI-2.3 glass fibre insulation. This was fmished on the hot and cold surfaces with controlled density (CD) gypsum ceiling board.
The framing members were comprised of carefully selected knot free California redwood. The studs and single top and bottom plates were milled to 37 mm by 87 mm and the half stud widths, located at both ends of the specimen, were milled to 19 mm by 87 mm. The moisture content of the framing material was measured using a "Protimeter: Diagnostic" model D179TS. These readings indicated a moisture content between 7 and 8 percent. This value was obtained from four observations on each piece of wood and is well below the 12 percent limit set by Rollin Inc. The average density of the framing members was determined to be 440 kg/m3. The framing material was fastened together using 89 mm common nails. Pilot holes were drilled to ensure that the material did not split.
The glass fibre insulation used to fi the stud cavities was manufactured by Manville and had nominal physical dimensions of 92 mm by 381 mm by 2.44111. The relaxed thickness of this material was found to be 89 mm. The insulation was type B 328, unfaced RSI-2.3. This insulation was carefully installed in the stud cavities to ensure minimum air gaps between the insulation and the framing material and the gypsum board. The average density of the glass fibre insulation was determined to be 14.0 kg/m3.
Controlled density (CD) gypsum ceiling board, 13 mm thick, was used to cover the specimen. The board was secured using #8 by 32 mm bugle head drywall screws. These were located every 204
mm
along the studs and the top and bottom plates. A vertical seam, located at the center stud, was finished with one layer of drywall tape and two coats of joint compound. Two coats of white latex paint were applied to both sides of the specimen. The same construction techniques were used on both sides of the specimen. The moisture content of the gypsum board was measured by taking weight measurements before and after drying in an oven. The moisture content was found to be 0.5 percent. The average density of the gypsum board was determined to be 628 kg/m3.3.0 PROCEDURE
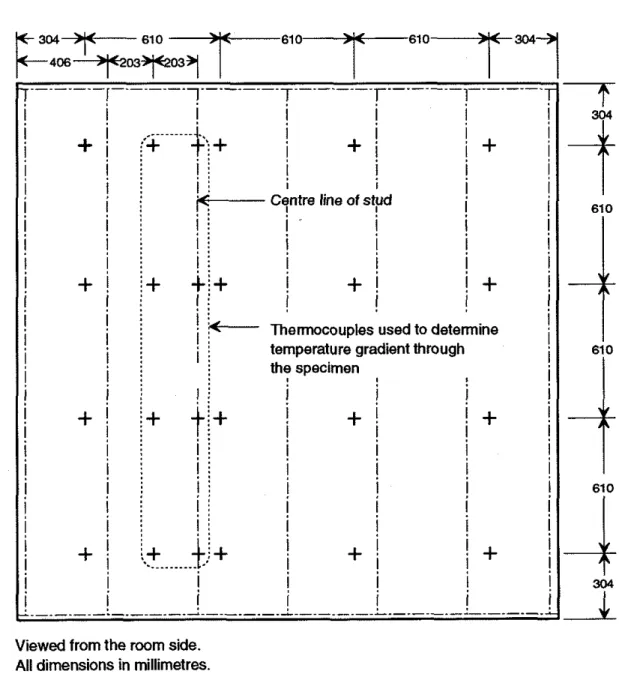
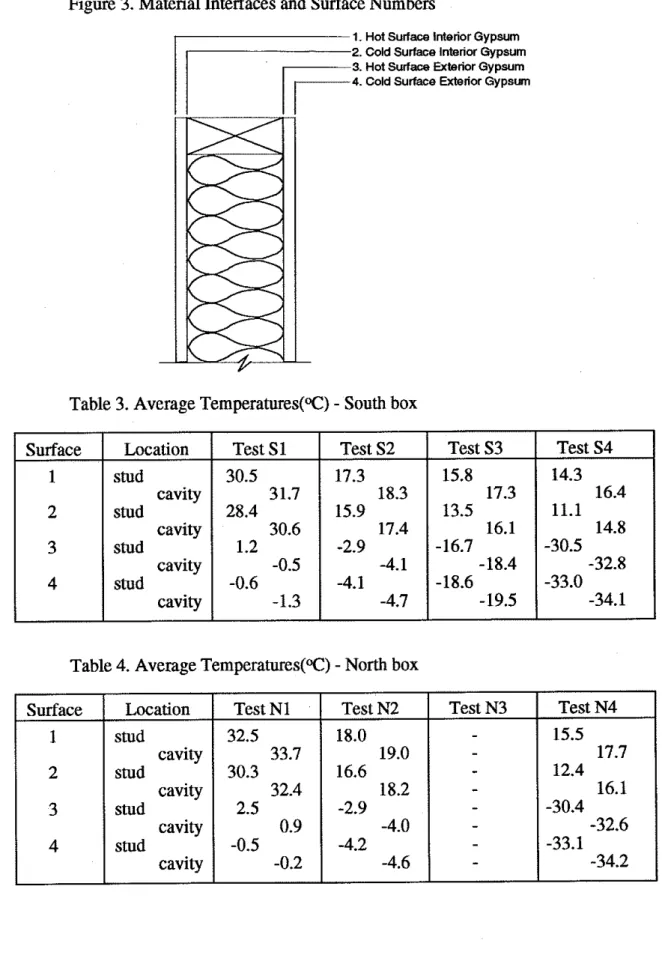
Type T thermocouples were attached to the hot and cold surfaces to measure the respective surface temperatures of the test specimen (Figure 2). Thermocouples to measure the temperature gradient through the specimen (Figure 2) were consistently located at the material interfaces shown in Figure 3.
The heat transfer through the specimen and the thermal resistance of the specimen were determined using the procedures outlimed in Appendix A and Appendix B.
Test 1 was conducted with nominal temperatures of 340C on the hot side and -20C on the cold side. This test provides the highest mean temperature. Tests 2, 3 and 4 are performed with a hot air temperature of 200C while the cold air temperatures were nominally -50C, -20% and -35OC respectively. Tests 1, 2 and 4 were repeated, with approximately the same temperature conditions, in the North box.
Figure 1. NVLAP Specimen
NOTE: Dimensias in miUmetres.
Page 3
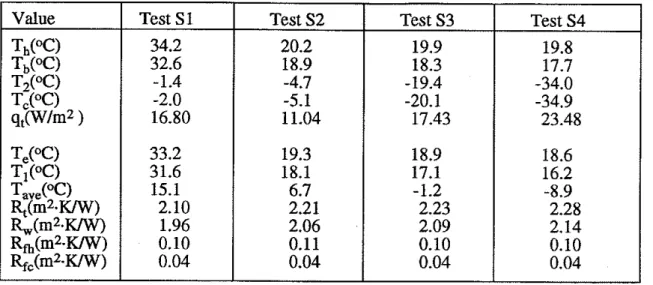
4.0 RESULTS
The results of the heat transmission tests are listed in Tables 1 and 2. The hot air temperature (Th), baffle temperature (Tb), cold surface temperature (TJ, cold air temperature (T,), and the heat flux (qJ were determined from measurement. The equivalent hot
air
temperature (Te), the average warm surface (T,), the average specimen temperature (T,,e), the total resistance (&), the specimen resistance (R,), the hot surface film resjstance
(Rd
and the cold side film resistance(Rf3
were calculated using the procedures outlined in Appendix A and Appendix B.Figure 2. Location of thermocouples
. -. -. -. -
r.-.-.-.-,-.-.-.-.
Ii
I I I I+
I Ij
+ i
:.
.
!
+j
I!
i
!
I I I I1
Ii
-
I :F
Cyntre lime of s t p!
I i. .
I Ii
!
;
i
Ij
!
I;
!
i I Ij
1 I;
!
;
I I I+
!
i+
t;+
!
+ !
!
+
I I:
!
i I I II
!
i
!
i Thermocouples used to determineI I
;
!
itemperature gradient through I
!
;
I;
the specimen!
!
i !j
! I Ii
! i
I!
!
I+ )
I!
I I!
i
j
;
!
I I I;
Ii
I!
I I j I ,:
, I Ij
I;
!
;
Ii
j
I I i I :. .
I I+
+
.. . .*;+
j
+ Ij
!
I I!
I I!
Ii
... Ij
I!
IViewed from the room side. All dimensions in millimetres,
Table 1. Measured and calculated results - South box.
Table 2. Measured and calculated results - North box. Value Td°C) Tb(OC) T2(OC) TC(OC) q,(Wlm2 T,(OC) Tl(OC) TaVe(OC) Rt(m2.WW) fa(m2.K/W) Rm(m2.K/W) Rf,(mZ-WW)
Additional thermocouples were affixed to the interior of the test specimen (see Figure 3). They were consistently located in order to produce temperature profiles along the stud line and the center of the insulating cavity. The average temperatures, shown in Tables 3 and 4, were calculated by averaging the four thermocouple readings along either the stud line or cavity.
Test S1 34.2 32.6 -1.4 -2.0 16.80 33.2 31.6 15.1 2.10 1.96 0.10 0.04 Value Th(OC) Tb(Oc) T2(OC) Tc(OC) qt(W/m2) Te(OC) Tl(OC) Tave(OC) Rt(m2.WW) k(m2.WW) %(m2.WW) R f , ( m 2 . ~ ) Test S2 20.2 18.9 -4.7 -5.1 1 1.04 19.3 18.1 6.7 2.21 2.06 0.11 0.04 Test N1 35.2 35.3 -0.2 -0.9 17.20 35.3 33.6 16.7 2.10 1.96 0.10 0.04 Test S3 19.9 18.3 -19.4 -20.1 17.43 18.9 17.1 -1.2 2.23 2.09 0.10 0.04 Test N2 20.1 20.2 -4.6 -5.0 11.44 20.2 18.9 7.2 2.19 2.05 0.11 0.03 Test S4 19.8 17.7 -34.0 -34.9 23.48 18.6 16.2 -8.9 2.28 2.14 0.10 0.04 Test N3 N 0 T P E R F 0 R M E D Test N4 20.0 20.2 -34.2 -35.0 24.12 20.2 17.5 -8.4 2.28 2.14 0.11 0.03
Figure 3. Material Interfaces and Surface Numbers
1. Hot Surface Interior Gypsum 2. Cold Surtace Interior Gypsum
3. Hot Surface Exterior Gypsum
,-4. Cold Surface Exterior Gypsun
Table 3. Average Temperature~(~C) - South box
Table 4. Average Temperatures(OC) - North box
Test S4 14.3 16.4 11.1 14.8 -30.5 -32.8 -33.0 -34.1 Test S3 15.8 17.3 13.5 16.1 -16.7 -18.4 -18.6 -19.5 Test S2 17.3 18.3 15.9 17.4 -2.9 -4.1 -4.1 -4.7 Surface 1 2 3 4 Test N4 15.5 17.7 12.4 16.1 -30.4 -32.6 -33.1 -34.2 Test N3 - -
-
-
- - --
Location stud cavity stud cavity stud cavity stud cavity Test N2 18.0 19.0 16.6 18.2 -2.9 -4.0 -4.2 -4.6 Test S 1 30.5 31.7 28.4 30.6 1.2 -0.5 -0.6 -1.3 Test N1 32.5 33.7 30.3 32.4 2.5 0.9 -0.5 -0.2 Surface 1 2 3 4 Location stud cavity stud cavity stud cavity stud cavityPage 6
5.0 COMMENTS
As can be seen in Tables 1 and 2, thermal resistance measured by the two guarded hot boxes are in close agreement. It should be noted that the two guarded hot boxes are not identical, in that the methods of heat delivery are different. The South box uses free convection (see Figure A2, Appendix A), while the North box utilizes a powered isothermal bafflelradiative surface.
The NVLAP round robin has reinforced the confidence in measurements obtained
from the two guarded hot box facilities. The results from the three different tests at nominally the same temperature conditions produced results that were close to identical. The values obtained at IRC may vary from values obtained from other sources due to the fact that test specimens that will be produced at other facilities will be similar, but not identical to the one used in the tests in the North and South boxes.
It was noted that the thickness of the insulation batts varied significantly from piece to piece. It is suggested that more consistent insulation and simplified construction be used in any further round robins.
APPENDIX A
TEST PROCEDURE AND CALORIMETER HEAT TRANSFER CCHARACTERlSTlCS FOR THE SOUTH BOX
CALORIMETER HEAT TRANSFER CHARACTERISTICS
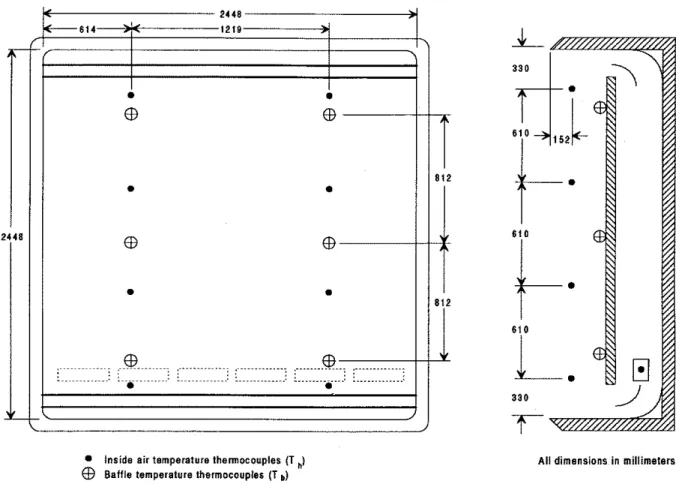
The calorimeter (Figures A1 and A2) is constructed of 76 mm isocyanurate foam
covered inside and outside with fiberglass and polyester resin. The inside dimensions of the box are 2490 mm high by 2490 mm wide by 675 mm deep. The box has one 2490 mm
square side open. A baffle of 40 mm fiberglass resin covered isocyanurate foam is installed 230 mm from the back wall. The baffle is the full calorimeter width and 2015 mm high
leaving a gap of 238 mm across the top and bottom. A row of electric heaters are installed
between the baffle and the back wall just above the bottom of the baffle so that the baffle shields the test specimen from direct radiation from the heaters. Air heated by these heaters flows up between the baffle and the back wall, through the gap at the top, down the 405 mm
space between the baffle and the test wall and back through the gap at the bottom.
The heat transfer to the test wall is by convection from the air and by radiation from the baffle and the inside calorimeter surfaces in the view of the test specimen. The mean temperature of the baffle and calorimeter surfaces, Tb, is thus lower than the mean hot air temperature, Tb, because of the radiation loss. This presents a problem in calculating the total resistance, R,, and hot side
air
f i resistance,R
,
,
from measured values. To cope with this problem, an equivalent temperature, T,, is calculated such that if Th and Tb were both equal to T,, the same heat flow would result as that for the actual air and calorimeter surface temperatures and the same radiation and convection coefficients.The total heat flow into the hot surface of the test specimen, q,, will be the sum of the convective component, qc, and the radiative component, &. That is:
where: A and B are constants
TI is the specimen hot surface temperature
Ff and
F,
are form and emmisivity factors which in this case are assumed to be equal to 1.0o is the Stefan-Boltzman constant o = 5.6703 x lo-* [W/(m2.K4)]
The constants A and B were evaluated from the results of a series of tests on a special test specimen. The wall was constructed from very stable and uniform insulating boards with surface coverings of 6 mm plywood. From the tests on this wall, where q,, Th, TI, and Tb were measured, and q, were calculated. Values of A = 3.025 and B = 1.25 were found
to give a good representation of qc for all heat flows by the equation qc = A(Th -
2 When the test wall has framing or other components that influence the hot surface temperature, the average surface temperature, TI, is used in the preceding equation. It is assumed that this approach gives better precision than trying to establish a weighted temperature average from measurements.
Once the average surface temperature of the wall is established, coefficients for the convective and radiative exchange, hc and
4 ,
can be calculated.The hot side equivalent temperature, T,, can be calculated by the following equation.
The total resistance, Rt, wall resistance, R,, hot side f i resistance, Rfn, cold side film resistance, Rfc, measured in the test are calculated as follows CT, is the measured cold air temperature and T2 is the measured cold surface temperature).
The values assigned to
R,
and Rfc in wall design resistance values,&,
are usually 0.12 m2KIW and 0.03 m2K/W respectively. The total design resistance then becomes:The design U-value is then:
Ud = lIRd
TEST PROCEDURE
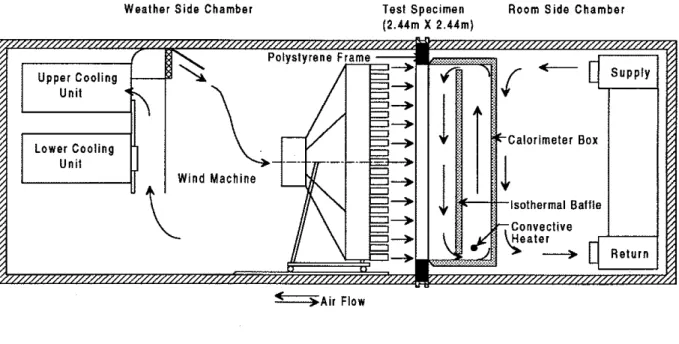
The test specimen is mounted vertically into a 2.44 m by 2.44 m opening of a polystyrene lined steel test frame. The hot and cold side perimeters of the test specimen are taped to the test frame to eliminate any air leakage around the test specimen.
The test frame, with the specimen installed, is mounted to the cold side chamber of the Environmental Test Facility. The calorimeter (metering box) used to measure heat flow through the specimen is installed over the hot surface of the test specimen. The hot side chamber of the Environmental Test Facility is then joined to the cold side chamber as shown in Figure A2.
During a steady state test, the calorimeter air temperature is maintained constant at the test temperature conditions. Eight equally spaced thermocouples are located in the air on the hot and cold sides of the test specimen as well
as
six on the baffle in the calorimeter. It is estimated that temperatures are measured by the thermocouples with an accuracy of +.O.lQC. Power to the calorimeter is measured continuously and 6 hour averages are recorded. A test is assumed to be at steady state conditions when four consecutive 6 hour averages are observed to change by less than 1%. It is estimated that the heat flow is measured by the calorimeter with an accuracy of 23%Figure Al. IRCYNRCC Calorimeter.
Inside air temperature thermocouples (T J
@ Baffle temperature thermocouples (T J
All dimensions in millimelers
APPENDIX B
TEST PROCEDURE AND CALORIMETER HEAT TRANSFER CHARACTERISTICS FOR THE NORTH BOX
CALORIMETER HEAT TRANSFER CHARACTERISTICS
The general approach used to determine the heat transmission characteristics of the test specimen is outlined in the paper DBR's Approach for Determining the Heat
Transmission characteristics of Wimhws, by R.P. Bowen, BRN 234, IRC, Nov. 1985 (copy
attached). In summary, the approach involves measuring the total power supplied to the
calorimeter and deducting the heat transfer through the mask to arrive at the heat transfer through the specimen. From the specimen heat transfer, using the relationships for the radiation and convective heat transfer from the calorimeter to the specimen, the equivalent room-side surface temperature of the specimen is calculated. The equivalent weather-side surface temperature is also calculated from the specimen heat transfer and the air film provided by the wind machine. The thermal conductance, resistance, design thermal resistance and design coefficient of heat transmission are calculated.
The following is a summary of the equations used for the calculations
where
QT
= total measured power supplied to the calorimeterQ = the heat transfer through the test specimen
Q,
= the heat transfer through the mask In turn Q is given byQ = Q c + Q r
and Q = A~
c
( T ~-
T ~ ) Bwhere Q = convective component of the heat transfer from the calorimeter to the specimen Qr = radiative component of the heat transfer from the calorimeter to the specimen
Th = the calorimeter air temperature A, = area of specimen
Ti
= the room-side specimen surface temperatureTi = the temmrature of surface i with radiation interchange with surface 1 FIi = the intekhange factor for radiation from surface 1 tothe other surfaces
i=3 for mask F13 = 0.040
i=4 for baffle F14 = 0.674
i=5 for calorimeter F15 = 0.1 16
o = the Stefan-Boltzmann constant = 5.6703
x
W 1(m2
K4) B & C are constants for the convective heat transfer to the specimenPage B 2 The constants B and C were established from the results of a series of tests using the same mask as used for the test specimen but with specially constructed calibration specimens 1.0 x 1.6 m and 0.8 x 1.0 m in place of the test specimen. The calibration test conditions were nominally the same as those for the test specimen; that is, 22
OC
room-side and -7 OC,-210C, and -35 OC weather-side temperatures. From the measurements with the calibration specimen and the conductance which was determined in the Thermal Conductivity Laboratory of IRC, Qr was calculated and Qc established for each set of conditions. A linear fit of the data yields values of
B = 1.266 and C = 1.581 W / (m2 K1.266).
Once the mean surface temperature of the test specimen is established, coefficients for the convective and radiative exchange, hc and hr, can be calculated:
h, = 1.581 (Th - T,)o.266 = qc I (Th - TI) W I (m2
-
K)h, = q , l ( ~ ~ - ~ ~ ) W l ( m ~ . K )
The room-side surface film coefficient, fi, or i?lside film resistance Rfi is then f i = h , + h , W / ( m 2 . K )
1
Rfi =
-
m 2 . mfi
The equivalent weather-side surface temperature, T2, is calculated by
where Tc = the weather-side
air
temperaturefo = weather-side surface film coefficient established during calibration tests was 25.2 W I (m2 K) (weather-side film resistance Rfo is then 0.04 m2.K/W)
Expressions to Calculate Specimen R-value and U-value
The test specimen conductance, C, W / (m2' K) and resistance, R, m2
.
K / W are calculated by:The values assigned to Rfi and Rfo in window design resistance values, RD, are usually:
The design U-value; UD is then: UD= 1 lRDWI(m2-K)
TEST PROCEDURE
A steel frame was used to hold the test assembly consisting of a wall, referred to as the mask, and the test specimen. The mask was constructed of 150 mm extruded polystyrene insulation with 17 mm of plywood covering on the room-side and weather-side surfaces. The thermal resistance of the mask was determined in the Environmental Test Facility prior to making an opening for the test specimen. The mask, with a calibration specimen in the opening made for the test specimen, was calibrated using the same room-side and weather- side conditions as those to be used for the test specimen.
Subsequently, the test specimen was installed into the mask. The specimen was centered in the opening and sealed to minimize air leakage through the opening. Thermocouples were used to measure the room-side and weather-side surface temperatures on the mask.
The test assembly was mounted on the weather-side chamber of the Environmental Test Facility. The calorimeter used to measure the heat flow through the test assembly was mounted over the room-side surface of the test assembly. The room-side chamber was joined to the weather-side chamber.
Figure B1: NRC/IRC Environmental Test Facility (North Box)
Weather Side Chamber Test Specimen Room Side Chamber (2.44m X 2.44m)
. .