HAL Id: hal-02883916
https://hal.archives-ouvertes.fr/hal-02883916
Submitted on 3 Jul 2020HAL is a multi-disciplinary open access archive for the deposit and dissemination of sci-entific research documents, whether they are pub-lished or not. The documents may come from teaching and research institutions in France or
L’archive ouverte pluridisciplinaire HAL, est destinée au dépôt et à la diffusion de documents scientifiques de niveau recherche, publiés ou non, émanant des établissements d’enseignement et de recherche français ou étrangers, des laboratoires
Extension and Limits of Cryoscopy for Nanoconfined
Solutions
Benjamin Malfait, Alban Pouessel, Aicha Jani, Denis Morineau
To cite this version:
Benjamin Malfait, Alban Pouessel, Aicha Jani, Denis Morineau. Extension and Limits of Cryoscopy for Nanoconfined Solutions. Journal of Physical Chemistry Letters, American Chemical Society, 2020, 11 (14), pp.5763-5769. �10.1021/acs.jpclett.0c01564�. �hal-02883916�
Extension and Limits of Cryoscopy for Nanoconfined
Solutions
Benjamin Malfait,† Alban Pouessel,† Aîcha Jani,† Denis Morineau†*
†Institute of Physics of Rennes, CNRS-University of Rennes 1, UMR 6251, F-35042 Rennes,
France
Corresponding Author
* Email: [email protected]
This work investigates the phase behavior of aqueous solutions of glycerol confined in
MCM-41 and SBA-15 nanoporous matrixes by calorimetry. Limitations due to overfilling and eutectic
freezing are prevented by the absence of an external liquid reservoir and by the glassforming
property of glycerol. Consequently, the stability of nanoconfined ice in equilibrium with aqueous
solutions is studied over a wide range of compositions. In confinement, a large temperature
depression of the liquidus line is observed. A thermodynamic model accounting simultaneously
for the cryoscopic and the Gibbs-Thomson effects gives a consistent view of the phase diagram
for large pores (Rp = 4.15 nm). For smaller pores (Rp = 1.8 nm), it reveals that the water activity
strongly deviates from the bulk solution with the same composition, indicating the possible role of
The lowering of the melting point of frozen liquids by the addition of a solute is a fundamental
and well-established phenomenon. Its early study by Bernoulli dates back to the eighteenth
century.1 The linear relation between the melting depression and the amount of salts dissolved in
water, usually known as the Blagden’s law was proposed in 1788.2 About one century later, this
prediction was extended to different systems, including organic and inorganic solvents and solutes.
This phenomenon was established as one of the three Raoult’s laws, which embrace the overall
colligative properties of solutions.3
The melting point depression of aqueous solutions induced by solutes, such as inorganic salts or
alcohols serves many important applications.4 Fundamentally, it is the basis of cryoscopy and a
related method, which was used to determine the molar mass and degree of ionic dissociation of
solutes.5 It also has many practical uses such as road salting in winter, the formulation of
anti-freezing additives (e.g. ethylene glycol) in the radiators of cars, or cryoprotectant agents (e.g.
glycerol, trehalose) for the safe storage and manipulation of food, pharmaceutical and medical
materials.6, 7 This phenomenon also profits to living organisms, which produce natural solutes with
a high biopreservative action (e.g. sugars, polyols) in order to adapt to severe icy conditions.8 The
exceptional melting point reduction achieved by mixing H-bonded molecules is also at the basis
of the very promising family of alternative solvents, known as deep eutectic solvents.9-11
When they are spatially confined at the nanometer scale, many fundamental properties of the
liquid states are also modified. Experimental and molecular simulation studies on various types of
well as the colligative nature of the freezing point depression by addition of solutes must be
reconsidered in nanoconfined geometry.
At present, only a few studies are available in the literature and apparently contradicting
behaviors were observed, some studies indicating no cryoscopic effect in confinement, and others
indicating enhanced cryoscopic effects.
On the one hand, it has been shown that the melting point of confined solutions was basically
independent on the initial solute concentration in two studies that addressed solutions of different
nature (benzene-cyclohexane mixtures in SBA-15 silicates,24 and series of alkali halides solutions
in MCM-41 and SBA-15 silicates25). In both cases, the authors demonstrated that this constant
temperature was in fact related solely to the eutectic point, and not to the liquidus line.
One the other hand in the limit of high dilution, an enhancement of the cryoscopic effect under
confinement was shown for NaCl solutions in SBA-15 and MCM-4126 and benzene-toluene
mixtures in SBA-15.27 The former study was complemented by Jantsch et al. in the range of higher
concentrations for CaCl2 and LiCl solutions confined in SBA-15 and MCM-41 mesoporous
silicates.28 The combined effects of confinement and the presence of solutes were accounted for
by an effective activity, in which the solute effect at ambient pressure and the Kelvin pressure
effect were estimated independently. Although satisfying for the largest pore sizes of the SBA-15
materials (Rp > 5 nm), this classical thermodynamic approach failed to understand observations
made for smaller pore size, where no concentration dependence on the ice melting was observed.
This observation was attributed to the exclusion of ions from small pores.28
observations of the liquidus line are missing, since existing studies were either restricted to the
limit of high dilution or unrelated to the liquidus line itself because of eutectic freezing and solute
exclusion.25, 26, 28 Besides, other specific phenomena have been invoked to interpret experimental
observations in the presence of excess liquid, such as the variation of the ice-liquid surface tension
as a function of the composition,26 the unexpected exclusion of ions from small pores,28 the effects
of secondary confinement or the precipitation of solute nanocrystals.25
In this Letter, we argue that a necessary condition of access to the liquidus line in porous media,
which prevents from the intervention of other physical phenomena, lies in the actual control of the
composition of the confined solution. This point has not received sufficient attention so far. In fact,
to the best of our knowledge, the existing studies implied an external reservoir of excess liquid so
that the liquid composition in the pores was allowed to vary with temperature, as demonstrated
experimentally.24, 25 This effect was thoroughly explained by Findenegg et al.25 In this study, they
argued that during cooling, the external reservoir crystallizes first, and this increases the solute
concentration of the remaining excess liquid, which is in equilibrium with the confined fluid. As a
consequence, the concentration of the confined liquid also increases before it crystallizes. For
diluted systems, we infer that this drift of the concentration of the confined liquid could lead to the
apparent enhanced cryoscopic effect in the confined state.26, 27 At variance for concentrated
systems, because the solute is also expected to crystallize, the variation of concentration of the
confined solution during cooling is finally bounded by the bulk eutectic composition, before
freezing starts in the pores. In this case, no information on the liquidus line can be attained either.
In this Letter, we report on a study aiming at revealing the confinement effects on the liquidus
line and thus the cryoscopic properties of aqueous solutions by selecting, for the first time, a set of
conditions which fulfill two important prerequisites: First, a temperature invariant composition of
the confined liquid, implying pore filling with no excess-liquid. Second, the absence of any solute
precipitate over the widest range of concentration, from the dilute to the highly (pure) concentrated
regime. The later condition means that the solute can be maintained easily in its supercooled liquid
state so that solute precipitation and eutectic freezing is fully avoided. Under these conditions, we
could unravel experimental evidences of the limits of cryoscopy at the nanoscale.
For this purpose, we chose glycerol as a solute instead of ionic salts. Glycerol has been
extensively used as a cryoprotectant, and as a prototypical glassforming liquid, its crystallization
could be easily avoided in normal conditions.29-31 The phase diagram of water-glycerol solutions
confined in the well-defined cylindrical pores of MCM-41 and SBA-15 silicates (pore radius RP =
1.8 and 4.15 nm) was determined by DSC. The exact value of the composition of the confined
aqueous solution, ranging from pure water to pure glycerol, was reached by a careful control of
the filling fraction and the confirmed absence of any thermal event due to a hypothetical excess
liquid as demonstrated in the Supporting Information.
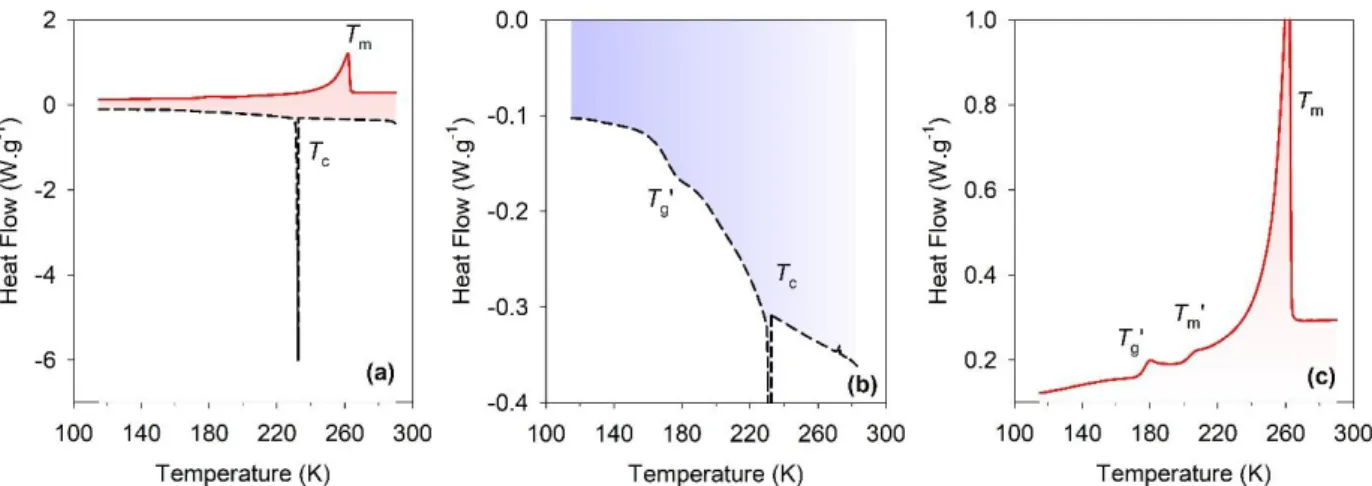
The phase behavior of glycerol aqueous solutions has been extensively studied in the bulk
state.32-35 Glycerol has a pronounced tendency to supercool in normal conditions, and seeding is
usually required to induce crystallization.32 The two equilibrium liquidus lines that cross at an
eutectic point (glycerol mass fraction 𝑊GE = 66.7%, and TE = 226.65 K) are shown in Figure S1a.
Without seeding, only water normally crystallizes during cooling, which leads to the different
large mass fractions of glycerol (𝑊G > 70%) the entire solution can be supercooled and it forms a glassy state at the temperature Tg. For small fractions of glycerol (𝑊G < 45%), ice forms on
cooling, while the co-existing freeze-concentrated aqueous solution remains disordered (liquid or
glassy). This was also confirmed by our measurement for WG = 30% illustrated in Figure S2, where
the crystallization is indicated by the endothermic peak at Tc. On heating, according to the many
studies on glycerol solutions, including the most recent work by the group of Loerting, the first
thermal event at Tg’ is attributed to the glass transition of the maximally-freeze-concentrated
(MFC) solution.33-37 The melting of ice occurs on an extended temperature range. At low
temperature, the onset of melting depends on the activity of water in the MFC solution, while the
last crystallites melt at a temperature Tm fixed by the activity of water in the entirely melted
solution. We referred to Tm as the liquidus, and to Tm’ as the onset of freezing, noting also that the
latter event can be additionally affected by “interface ice” effects and the combination of “cold
recrystallization/ice dissolution as discussed in the litterature.34, 35 In the intermediate region (45%
< 𝑊G < 70%), both situations (ice formation or not) occur depending on the thermal treatment, allowing the independent determination of Tg and Tg’. This is illustrated by our measurement for
WG = 60% in Figure S3.
The DSC thermograms acquired during the heating ramp as a function of the temperature and
the glycerol mass fraction are illustrated in Figures 1a and 1b, for the solutions confined in the
SBA-15 and the MCM-41, respectively. For completeness, enlarged views of the different
individual thermograms acquired on heating and on cooling are provided in Supporting
ice formation implied up to three exothermic peaks, but only a single endothermic event on
melting.38 We made similar observation for the thermograms of the confined solutions on cooling
(Figure S4). It is also noteworthy that in SBA-15, the onset of crystallization shifted to lower
temperature on increasing the amount of glycerol, and exhibited significant thermal hysteresis. At
variance in MCM-41, the crystallization was weakly dependent on WG and the thermal hysteresis
was virtually absent. This observation of the disappearance of the thermal hysteresis in small pores
extends previous conclusions made for pure water.38
Figure 1. Thermograms of the glycerol – water binary mixture confined in (a) SBA-15 and in
(b) MCM-41 as a function of the temperature and the glycerol mass fraction. The endothermic heat
flow points upward and the heating ramp was 5 K.min-1. On the glycerol-rich side of the phase
diagram, the shift to lower temperature of the glass transition as a function of the glycerol mass
of the amount of ice that melted at a barely varying temperature for MCM-41 is underlined by a
red arrow.
Due to these effects of metastability, the scans on cooling are not appropriate to obtain reliable
information on the liquidus. The scans acquired on heating have been used instead, including
thermal cycling for WG=60% as also done for the bulk. They are illustrated in Figures S6, S7, and
S8. The behaviors obtained in the porous matrixes were qualitatively similar to those of the bulk
solutions, and are summarized in Figure 1 by a 3D plot of all the thermograms acquired on
warming.33-37 This similarity is due to the tendency of ice to crystallize in mesopores, which is no
more the case in micropores (i.e. Rp = 1.0 nm).39 On the quantitative level however, large
differences were observed between the three systems concerning the melting temperatures and
their dependence on the glycerol composition.
This is illustrated in Figure 1 by a heat capacity jump at the glass transition temperature Tg for
glycerol-rich mixtures. For water-rich mixtures, we observed the coexistence of the broad
endothermic melting peak of ice with a maximum located at Tm and the glass transition temperature
of the maximally-freeze-concentrated (MFC) solution Tg’. The transition temperatures of the
different systems are compared in Figure 2. The composition of the MFC solution 𝑊G′ is barely dependent on the initial composition of the solution and it is therefore straightforward that for 𝑊 < 𝑊G′, provided that ice crystallization occurs, this composition determines the value of the glass transition Tg’.36, 40 This is illustrated in Figure 2, by identifying 𝑊G′ as the composition where the
extrapolated value of Tg’ crosses Tg. The composition of the MFC solution could also be evaluated
of 𝑊G′ ≈ 70% for the confined systems. Within experimental uncertainties, they appeared similar to the value reported for the bulk solution 𝑊G′ = 75%.36
Figure 2. Phase diagram of the glycerol – water binary mixture in the bulk state, including data
from the literature (open symbols) and from the present study (hourglass symbols), confined in
SBA-15 (half-filled symbol) and confined in MCM-41 (filled symbol) as a function of the mass
fraction of glycerol. The experimental liquidus (circles), the glass transition temperatures of the
homogenous aqueous solution Tg (squares), and the maximally freeze concentrated solution Tg’
(diamonds). The theoretical predictions from extended Gibbs-Thomson equation with ideal mixing
(eq. 4, short dashed line). Solid lines are guides to the eyes. The bulk liquidus, Tg and Tg’ are
extracted from ref. 32, 33, and 34.
We now consider the ultimate goal of this study on a quantitative level, which is to resolve the
confinement effect on the liquidus line illustrated in the phase diagram presented in Figure 2. In
confinement, we observed a reduction of Tmconf with respect to TmBulk, which evokes the
well-known confinement effect on the melting point of pure compounds, as usually named the
mass fraction 𝑊G , as denoted the cryoscopic effect. However, this cryoscopic effect is much reduced for the smallest pore radius, being only a few degrees for Rp = 1.8 nm, compared to a few
tens of degrees for both the bulk and for largest pore radius Rp = 4.15 nm.
Figure 3. Sketch of the confined water and aqueous solution in different region of the phase
diagram.
The thermodynamics of the confined system illustrated in Figure 3 can be expressed by the Gibbs
energy of a cylindrical ice crystal composed of 𝑛𝑠 water molecules, in contact with a liquid solution
of solute molar fraction x under full wetting condition (cf. Supporting Information), which writes
as
𝐺𝑠(𝑇, 𝑛𝑠) = 𝑛𝑠𝜇𝑠(𝑇) + 2𝑛𝑠𝑣𝑠
𝑟 𝛾𝑠𝑙+ 2𝜋𝑟 2𝛾
with r the radius of the crystal, 𝑣𝑠is the molar volume of water in ice, 𝜇𝑖 the chemical potential
of phase i (i = s, l for solid ice and liquid), and 𝛾𝑠𝑙 the ice-solution surface energy.
The melting temperature 𝑇𝑟𝑥 of the confined ice is determined by the equilibrium condition between the solid and the liquid solution, which implies that
(𝜕𝐺𝑠 𝜕𝑛𝑠) = ( 𝜕𝐺𝑙 𝜕𝑛𝑙) (2) and so 𝜇𝑠(𝑇𝑟𝑥) − 𝜇 𝑙(𝑇𝑟𝑥, 𝑥) = − 2 𝑣𝑠𝛾𝑠𝑙 𝑟 (3)
In order to deduce the melting temperature 𝑇𝑟𝑥 by solving eq 3 the knowledge of 𝜇
𝑙(𝑇, 𝑥) and
𝛾𝑠𝑙 is required. This is straightforward if one makes the further assumptions that (a) the variation with T and x of the solid-liquid surface energy is negligible, (b) the solution fulfills the ideal mixing
approximation, and (c) the heat capacity contribution to the bulk water Gibbs energy difference is
small compared to the melting enthalpy term ∆𝐻𝑚 (cf. Supporting Information). The two latter
assumptions are used in the classical derivations of the Raoult’s law and Gibbs-Thomson equation respectively.
The melting point of ice 𝑇𝑟𝑥 writes then as an extended version of the Gibbs-Thomson equation
𝑇𝑟𝑥− 𝑇𝑏𝑢𝑙𝑘0 =−2𝛾𝑠𝑙𝑣𝑠𝑇𝑏𝑢𝑙𝑘0
∆𝐻𝑚𝑟 +
𝑅𝑇𝑟𝑥 𝑇𝑏𝑢𝑙𝑘0 ln (1−𝑥)
∆𝐻𝑚 (4)
with x being the glycerol molar fraction, ∆𝐻𝑚 the bulk ice melting enthalpy and R the gas
Interestingly, the right side of eq 4 comprises two terms, which reflect the cumulative effects of
confinement and solute on the ice melting point depression.
For pure water (x = 0), one recovers the classical Gibbs-Thomson equation
𝑇𝑟0− 𝑇
𝑏𝑢𝑙𝑘0 =
−2𝛾𝑠𝑙𝑣𝑠𝑇𝑏𝑢𝑙𝑘0
∆𝐻𝑚𝑟 (5)
which is in perfect agreement with the experimental values (Table 1 in Supporting Information)
if one assumes an interfacial layer of unfreezable liquid of thickness e = 0.6 nm, so that r = Rp-e,
and the value of the Gibbs-Thomson constant 𝐶𝐺𝑇 =2𝛾𝑠𝑙𝑇𝑏𝑢𝑙𝑘0
∆𝐻𝑚𝜌𝑠 = 52.4 𝐾. 𝑛𝑚 in accordance with
Findenegg.38 It should be noted that there are ongoing discussions about the nature of confined ice
(hexagonal/cubic, stacking disordered).42 Our calculation is based on the values (𝑇𝑏𝑢𝑙𝑘0 and ∆𝐻𝑚) of the bulk (hexagonal) ice phase. This choice is in line with the widely used methods of
thermoporosity, and is also supported by the quantitative agreement obtained for pure water.
For the aqueous solutions, the predictions from eq 4 are shown as short dashed lines in Figure
2. For the SBA-15, the experimental cryoscopic depression of 𝑇𝑟𝑥 is larger than predicted.
However, the level of disagreement is very similar to that already observed for the bulk solution
(open and hourglass circles). It is thus reasonable to attribute it to a same origin. Regarding the
three approximations made, it means that invoking the hypothetical variation of 𝛾𝑠𝑙 is not needed in the present study and that most probably, the ideal mixing approximation is the main limitation
Figure 4. Inverse melting temperature as a function of the water molar fraction (logscale) of the
glycerol – water binary mixture bulk (triangle), confined in SBA-15 (square) and in MCM-41
(circle). The theoretical predictions based on the extended cryoscopic equation with ideal mixing
(eq. 6, dashed line).
Under the same level of approximation, we removed the explicit references to 𝛾𝑠𝑙 and to the ice
radius r (cf. Supporting Information) and derived the extended cryoscopic equation with ideal
mixing 1 𝑇𝑟𝑥− 1 𝑇𝑟0 = − ( 𝑇𝑏𝑢𝑙𝑘0 𝑇𝑟0 ) 𝑅 ln (1−𝑥) ∆𝐻𝑚 (6)
where all the effects of confinement are implicitly contained in the melting point temperature of
pure water 𝑇𝑟0. For bulk water (𝑇
𝑟0 = 𝑇𝑏𝑢𝑙𝑘0 ), one recovers the classical cryoscopic equation 1 𝑇𝑏𝑢𝑙𝑘𝑥 − 1 𝑇𝑏𝑢𝑙𝑘0 = − 𝑅 ln (1−𝑥) ∆𝐻𝑚 (7)
According to eq 6, the effect of adding a solute on the inverse melting point variation should be
larger for a confined system than for the bulk since it scales with 𝑇𝑏𝑢𝑙𝑘
0
𝑇𝑟0 > 1, the latter coefficient
being a consequence of the Gibbs-Thomson confinement effect for the pure water.
This model actually gave a quantitative prediction of the asymptotic variation of 𝑇𝑟𝑥 in the dilute
regime for Rp = 4.15 nm and for the bulk (solute molar fraction lower than 5%), as illustrated by
Figure 4. In the more concentrated regime, deviations from a linear cryoscopic variation were
observed, which obviously underlines the breakdown on the ideal mixing approximation for
aqueous solutions. Contrariwise, for Rp = 1.8 nm the extended cryoscopic equation failed to
reproduce the weak dependence of 𝑇𝑟𝑥 on the mixture composition, even in the limit of highly diluted system where non-ideality effects are usually reduced. It means that in small pores, other
effects than the simple deviation of aqueous solutions from the ideal mixing approximation must
be present.
experimental values of the melting points and using an extended cryoscopic model with non-ideal
mixing (eq. 8). It is computed with the experimental Gibbs energy for pure water from ref. 43.
Water activity of glycerol – water binary mixture derived from the vapor pressure at 25°C (dashed
line) from ref. 44.
In order to gain a better insight, it is worth coming back to the initial expression of the Gibbs
energy (eq 3), with a better degree of approximation. In the following, we only retained the
assumption that (a) the variation of 𝛾𝑠𝑙 is negligible as justified previously, while the non-ideal character of mixing was included, and the precise chemical potential of water was obtained from
a detailed consistent thermodynamic integration of calorimetric data.43 Under these minimal
hypothesis, the activity of water in the confined solution could be evaluated with eq 8, (cf.
Supporting Information) based on the experimental values of the melting point temperature of the
confined solution 𝑇𝑟𝑥 , and the pure water 𝑇𝑟0 , with ∆𝜇0(𝑇) being the difference in the chemical
potential between ice and liquid pure bulk water, determined by Johari 43 in a temperature range
from 273,15 to 153K and later parametrized by Koop et al. 45
𝑎(𝑟, 𝑇𝑟𝑥, 𝑥) = 𝐸𝑥𝑝 {
∆𝜇0(𝑇𝑟𝑥)−∆𝜇0(𝑇𝑟0)
𝑅 𝑇𝑟𝑥 } (8)
The values of the water activity obtained from eq 8 are presented in Figure 5. They are also
compared with a different evaluation of the water activity, defined classically as the ratio of the
vapor pressure of water in equilibrium with a water-glycerol solution to the saturation vapor
pressure of pure water at 25°C.44 For bulk solutions, an excellent agreement was obtained between
the activity derived from the melting point and from the vapor pressure, with a clear demonstration
values. A possible tiny deviation from this bulk-like behavior could be hardly confirmed in the
concentrated regime within experimental uncertainties. On the contrary, a clear breakdown of this
bulk-like behavior occurred for the smaller pore size in the MCM-41, where the activity of water
in the confined mixtures exhibited a much weaker dependence on the solute concentration.
Interestingly, the liquidus line can be viewed as the melting temperature Tmconf of the tiniest
fraction of ice that remains in the nanoconfined solution, when all the rest of the freezable water
has already melted. From this viewpoint, our results suggest that the composition of the solution,
which determines through its water activity the value of Tmconf is different from the average
composition of the entire solution. However at lower temperature, when the entire fraction of
freezable confined water has formed ice, the composition of the maximally freeze-concentrated
solution agrees well with the bulk value (𝑊G′ ≈ 70%). We argue that this indicates that local heterogeneities of concentration are involved, and that they trigger the position of the liquidus,
which cannot be explained solely by the average composition of the whole confined liquid. This
conclusion is the main novelty with respect to the existing literature. Indeed in previous studies,
the concentration of the whole confined solution was expected to vary on approaching the liquidus
line because of eutectic freezing, solute precipitation, solute rejection and the presence of an extra
reservoir of liquid.24-28 On the contrary, the glassforming ability of glycerol demonstrates that the
eutectic point did not play any role. The fact that the whole composition of the confined liquid at
Tmconf could be different from the mother solution due to external ice freezing25 or to the solutes
exclusion from the pores28 can be also safely ruled out in this study. First, it was shown that all the
side of the melting peak of the confined ice and the formation of the maximally freeze-concentrated
solution (𝑊G′ ≈ 70%) implied that the nanoconfined ice was interacting with the remaining glycerol aqueous solution, the latest being also present in the pores. In other words, there was no
sign of solute exclusion.
In conclusion, we have shown that an extended Gibbs-Thomson equation, or extended
cryoscopic equation assuming ideal mixing, gave an appropriate description of the phase behavior of confined glycerol aqueous solution, provided that the pore size is large enough (Rp = 4.15 nm).
In this case, the Gibbs-Thomson effect was dominant, and the cryoscopic effect could be
quantitatively reproduced assuming that the activity of water in the confined solution was
comparable to that of the bulk at the same composition. Strikingly, for a smaller pore (Rp = 1.8
nm), the phase behavior indicated that the end of melting on heating and also the onset of freezing
on cooling were determined by a very different water activity, which exhibited a much weaker
dependence on the solute concentration. We consider that the conditions used in the present study
allowed us to refute other interpretations that have been previously invoked in studies influenced
by eutectic freezing, in-pore concentration variation and outer-pore excess liquid. Instead, this
study underlines the inhomogeneous character of the nanoconfined aqueous solution. It is worth
mentioning that microphase separation phenomena induced by nanoconfinement and interfacial
interaction have been reported for different binary liquid mixtures based on dynamical
information.39, 46-48 Moreover, direct structural evidences were also obtained from neutron
scattering methods and molecular simulation.49-51 The microphase segregation facilitating ice
formation in water-rich domains was also invoked to rationalize the enhanced tendency for partial
far. This Letter suggests that water-rich nanoregions, and not the average concentration of the
solution, determine the liquidus line, and the onset of crystallization as well. At temperature below
the liquidus line, ice further invades the matrix porosity. We showed that this growth of crystals
performs in interaction with a confined freeze-concentrated solution. This is demonstrated by the
large depression of the onset of melting with respect to the liquidus -and likewise the extension to
lower temperature of the freezing process on cooling. The fraction of ice is finally limited by the
formation of a nanoconfined maximally freeze-concentrated solution, with a composition that is
reminiscent of the bulk one. To our best knowledge, this Letter provides the first evidence of a
link between water microsegregation and the liquid-solid phase diagram in nanoconfined
solutions. It brings a new insight on a topics founded on two fundamental pillars of the
thermodynamics of condensed matter physics (i.e. the Blagden and Raoult’s law of cryoscopy and
the Gibbs-Thomson effect) and how their combined effects could reveal new phenomena in
aqueous solutions confined at the nanoscale. It indicates that their possible impacts in many applied
fields of confined solutions should be carefully scrutinized in the future.
ASSOCIATED CONTENT
Supporting Information
Phase diagram of bulk glycerol-water solutions with and without crystal seeding. DSC thermograms on heating and cooling of two bulk solutions and all the solutions confined in MCM-41 and SBA-15. Melting enthalpy of confined glycerol-water solutions. Effect of thermal cycling on the DSC thermograms of glycerol-water solution (WG=60%) in the bulk state and confined in
glycerol-in SBA-15 and MCM-41 usglycerol-ing the classical Gibbs-Thomson equation (Table S1). Materials and methods. Related references.
ACKNOWLEDGMENTS
Support from Rennes Metropole and Europe (FEDER Fund – CPER PRINT2TAN), and
the ANR (Project NanoLiquids N° ANR-18-CE92-0011-01) is expressly acknowledged. This
work is part of the Ph.D. thesis of A.J. who benefits from a grant from the French Ministry of
Higher Education, Research, and Innovation. We thank Odile MERDRIGNAC (Institut des Sciences Chimiques de Rennes) for her assistance with Nitrogen isotherms experiments for the characterization of the MCM-41 and SBA-15 materials.
REFERENCES:
1. Reif-Acherman, S., The Pre-History of Cryoscopy: What was Done before Raoult?
Quimica Nova 2009, 32 (6), 1677-1684.
2. Blagden, C., Experiments on the Effect of Various Substances in Lowering the Point of
Congelation in Water. By Charles Blagden, M. D. Sec. R. S. and F. A. S. Philosophical
Transactions of the Royal Society of London 1788, 78, 277-312.
3. Raoult, F. M., Sur le Point de Congélation des Liqueurs Alcooliques. Comptes Rendus de
l'Académie des Sciences 1880, 90, 865-868.
4. Angell, C.; Bressel, R.; Green, J.; Kanno, H.; Oguni, M.; Sare, E., Liquid Fragility and
the Glass-Transition in Water and Aqueous-Solutions. Journal of Food Engineering 1994, 22
(1-4), 115-142.
5. Gerold, A.; Jastrzebski, J.; Kronenburg, C.; Krause, N.; vanKoten, G., Determination of
the Degree of Aggregation of Organocopper Compounds by Cryoscopy in Tetrahydrofuran.
Angewandte Chemie-International Edition in English 1997, 36 (7), 755-757.
6. Rall, W.; Fahy, G., Ice-Free Cryopreservation of Mouse Embryos at -196-Degrees-C by
Vitrification. Nature 1985, 313 (6003), 573-575.
7. Berendsen, T.; Bruinsma, B.; Puts, C.; Saeidi, N.; Usta, O.; Uygun, B.; Izamis, M.;
Toner, M.; Yarmush, M.; Uygun, K., Supercooling Enables Long-Term Transplantation
Survival Following 4 Days of Liver Preservation. Nature Medicine 2014, 20 (7), 790-793.
8. Bale, J.; Hayward, S., Insect Overwintering in a Changing Climate. Journal of
9. Abbott, A.; Boothby, D.; Capper, G.; Davies, D.; Rasheed, R., Deep Eutectic Solvents
formed between Choline Chloride and Carboxylic Acids: Versatile Alternatives to Ionic Liquids.
Journal of the American Chemical Society 2004, 126 (29), 9142-9147.
10. Zhang, Q.; Vigier, K.; Royer, S.; Jerome, F., Deep Eutectic Solvents: Syntheses,
Properties and Applications. Chemical Society Reviews 2012, 41 (21), 7108-7146.
11. Ge, X.; Gu, C.; Wang, X.; Tu, J., Deep Eutectic Solvents (DESs)-Derived Advanced
Functional Materials for Energy and Environmental Applications: Challenges, Opportunities,
and Future Vision. Journal of Materials Chemistry a 2017, 5 (18), 8209-8229.
12. Jackson, C. L.; McKenna, G. B., The Melting Behavior of Organic Materials Confined in
Porous Solids. Journal of Chemical Physics 1990, 93 (12), 9002-9011.
13. Jackson, C.; McKenna, G., The Glass-Transition of Organic Liquids Confined to Small
Pores. Journal of Non-Crystalline Solids 1991, 131, 221-224.
14. Granick, S., Motions and Relaxations of Confined Liquids. Science 1991, 253 (5026),
1374-1379.
15. Christenson, H. K., Confinement Effects on Freezing and Melting. Journal of
Physics-Condensed Matter 2001, 13 (11), R95-R133.
16. Morineau, D.; Xia, Y. D.; Alba-Simionesco, C., Finite-Size and Surface Effects on the
Glass Transition of Liquid Toluene Confined in Cylindrical Mesopores. Journal of Chemical
Physics 2002, 117 (19), 8966-8972.
17. Alba-Simionesco, C.; Dosseh, G.; Dumont, E.; Frick, B.; Geil, B.; Morineau, D.;
Teboul, V.; Xia, Y., Confinement of Molecular Liquids: Consequences on Thermodynamic,
Static and Dynamical Properties of Benzene and Toluene. European Physical Journal E 2003,
18. Alcoutlabi, M.; McKenna, G. B., Effects of Confinement on Material Behaviour at the
Nanometre Size Scale. Journal of Physics-Condensed Matter 2005, 17 (15), R461-R524.
19. Alba-Simionesco, C.; Coasne, B.; Dosseh, G.; Dudziak, G.; Gubbins, K. E.;
Radhakrishnan, R.; Sliwinska-Bartkowiak, M., Effects of Confinement on Freezing and Melting.
Journal of Physics-Condensed Matter 2006, 18 (6), R15-R68.
20. Kityk, A. V.; Wolff, M.; Knorr, K.; Morineau, D.; Lefort, R.; Huber, P., Continuous
Paranematic-to-Nematic Ordering Transitions of Liquid Crystals in Tubular Silica
Nanochannels. Physical Review Letters 2008, 101 (18), 187801.
21. Morineau, D.; Alba-Simionesco, C., Does Molecular Self-Association Survive in
Nanochannels? Journal of Physical Chemistry Letters 2010, 1 (7), 1155-1159.
22. Richert, R., Dynamics of Nanoconfined Supercooled Liquids. Annual Review of Physical
Chemistry, Vol 62 2011, 62, 65-84.
23. Huber, P., Soft Matter in Hard Confinement: Phase Transition Thermodynamics,
Structure, Texture, Diffusion and Flow in Nanoporous Media. Journal of Physics-Condensed
Matter 2015, 27 (10).
24. Krycka, K.; Dura, J.; Langston, L.; Burba, C., Nanoconfinement-Induced Phase
Segregation of Binary Benzene-Cyclohexane Solutions within a Chemically Inert Matrix.
Journal of Physical Chemistry C 2018, 122 (14), 7676-7684.
25. Meissner, J.; Prause, A.; Findenegg, G., Secondary Confinement of Water Observed in
Eutectic Melting of Aqueous Salt Systems in Nanopores. Journal of Physical Chemistry Letters
26. Burba, C.; Janzen, J., Confinement Effects on the Phase Transition Temperature of
Aqueous NaCl Solutions: The Extended Gibbs-Thomson Equation. Thermochimica Acta 2015,
615, 81-87.
27. Ito, Y.; Miyaoka, T.; Tomita, N.; Yoshimi, T.; Sugimoto, T.; Takemura, T.; Nagoe,
A.; Fujimori, H., Freezing-point Depression of Benzene Confined in Mesoporous Silica SBA-15
on Doping with a Slight Amount of Toluene: Ideal Behavior in a Nanometer-sized Space.
Chemistry Letters 2017, 46 (3), 296-298.
28. Jantsch, E.; Weinberger, C.; Tiemann, M.; Koop, T., Phase Transitions of Ice in
Aqueous Salt Solutions within Nanometer-Sized Pores. Journal of Physical Chemistry C 2019,
123 (40), 24566-24574.
29. Ediger, M. D.; Angell, C. A.; Nagel, S. R., Supercooled Liquids and Glasses. Journal of
Physical Chemistry 1996, 100 (31), 13200-13212.
30. Busselez, R.; Lefort, R.; Guendouz, M.; Frick, B.; Merdrignac-Conanec, O.; Morineau,
D., Molecular Dynamics of Glycerol and Glycerol-Trehalose Bioprotectant Solutions
Nanoconfined in Porous Silicon. Journal of Chemical Physics 2009, 130 (21), 214502.
31. Busselez, R.; Lefort, R.; Ghoufi, A.; Beuneu, B.; Frick, B.; Affouard, F.; Morineau,
D., The non-Gaussian Dynamics of Glycerol. Journal of Physics-Condensed Matter 2011, 23
(50).
32. Lane, L., Freezing Points of Glycerol and its Aqueous Solutions. Industrial and
Engineering Chemistry 1925, 17, 924-924.
33. Murthy, S.; Singh, G., Examination of the Concentration Dependence of T-g of Binary
34. Bachler, J.; Fuentes-Landete, V.; Jahn, D.; Wong, J.; Giovambattista, N.; Loerting, T.,
Glass Polymorphism in Glycerol-Water Mixtures: II. Experimental Studies. Physical Chemistry
Chemical Physics 2016, 18 (16), 11058-11068.
35. Bachler, J.; Handle, P.; Giovambattista, N.; Loerting, T., Glass Polymorphism and
Liquid-Liquid Phase Transition in Aqueous Solutions: Experiments and Computer Simulations.
Physical Chemistry Chemical Physics 2019, 21 (42), 23238-23268.
36. Zhao, L.; Cao, Z.; Wang, Q., Glass Transition of Aqueous Solutions Involving
Annealing-Induced Ice Recrystallization Resolves Liquid-Liquid Transition Puzzle of Water.
Scientific Reports 2015, 5.
37. Popov, I.; Greenbaum, A.; Sokolov, A.; Feldman, Y., The Puzzling First-Order Phase
Transition in Water-Glycerol Mixtures. Physical Chemistry Chemical Physics 2015, 17 (27),
18063-18071.
38. Findenegg, G. H.; Jahnert, S.; Akcakayiran, D.; Schreiber, A., Freezing and Melting of
Water Confined in Silica Nanopores. Chemphyschem 2008, 9 (18), 2651-2659.
39. Elamin, K.; Jansson, H.; Kittaka, S.; Swenson, J., Different Behavior of Water in
Confined Solutions of High and Low Solute Concentrations. Physical Chemistry Chemical
Physics 2013, 15 (42), 18437-18444.
40. Schawe, J., A Quantitative DSC Analysis of the Metastable Phase Behavior of the
Sucrose-Water System. Thermochimica Acta 2006, 451 (1-2), 115-125.
41. Jani, A.; Sohier, T.; Morineau, D., Phase behavior of aqueous solutions of ethaline deep
eutectic solvent. Journal of Molecular Liquids 2020, 304.
pore filling: a synchrotron based X-ray diffraction study. Physical Chemistry Chemical Physics
2020, Advance Article.
43. Johari, G. P.; Fleissner, G.; Hallbrucker, A.; Mayer, E., Thermodynamic Continuity
between Glassy and Normal Water. Journal of Physical Chemistry 1994, 98 (17), 4719-4725.
44. Nakagawa, H.; Oyama, T., Molecular Basis of Water Activity in Glycerol-Water
Mixtures. Frontiers in Chemistry 2019, 7.
45. Koop, T.; Luo, B. P.; Tsias, A.; Peter, T., Water Activity as the Determinant for
Homogeneous Ice Nucleation in Aqueous Solutions. Nature 2000, 406 (6796), 611-614.
46. Hamid, A. R. A.; Mhanna, R.; Catrou, P.; Bulteau, Y.; Lefort, R.; Morineau, D.,
Multiple Glass Transitions of Microphase Separed Binary Liquids Confined in MCM-41.
Journal of Physical Chemistry C 2016, 120 (20), 11049-11053.
47. Swenson, J.; Elamin, K.; Chen, G.; Lohstroh, W.; Sakai, V. G., Anomalous Dynamics
of Aqueous Solutions of di-Propylene Glycol Methylether Confined in MCM-41 by Quasielastic
Neutron Scattering. Journal of Chemical Physics 2014, 141 (21).
48. Sattig, M.; Elamin, K.; Reuhl, M.; Swenson, J.; Vogel, M., Dynamics of
DiPGME-Water Mixtures in Mesoporous Silica. Journal of Physical Chemistry C 2017, 121 (12),
6796-6806.
49. Hamid, A. R. A.; Mhanna, R.; Lefort, R.; Ghoufi, A.; Alba-Simionesco, C.; Frick, B.;
Morineau, D., Microphase Separation of Binary Liquids Confined in Cylindrical Pores. Journal
of Physical Chemistry C 2016, 120 (17), 9245-9252.
50. Mhanna, R.; Hamid, A.; Dutta, S.; Lefort, R.; Noirez, L.; Frick, B.; Morineau, D.,
More Room for Microphase Separation: An Extended Study on Binary Liquids Confined in
51. Essafri, I.; Morineau, D.; Ghoufi, A., Microphase Separation of a Miscible Binary Liquid
Mixture under Confinement at the Nanoscale. Npj Computational Materials 2019, 5.
52. Demuth, D.; Sattig, M.; Steinrucken, E.; Weigler, M.; Vogel, M., H-2 NMR Studies on
the Dynamics of Pure and Mixed Hydrogen-Bonded Liquids in Confinement. Zeitschrift Fur
Physikalische Chemie-International Journal of Research in Physical Chemistry & Chemical Physics 2018, 232 (7-8), 1059-1087.
Supporting Information: Extension and Limits of
Cryoscopy for Nanoconfined Solutions
Benjamin Malfait,† Alban Pouessel,† Aîcha Jani,† Denis Morineau†*
†Institute of Physics of Rennes, CNRS-University of Rennes 1, UMR 6251, F-35042 Rennes,
France
Corresponding Author
* Email: [email protected]
1. Phase Diagram and thermograms of Bulk
Glycerol-Water Solutions
Figure S1. Phase diagram of the glycerol – water binary mixture as a function of the mass fraction of glycerol. (a) Glycerol crystallization was induced by seeding. The experimental equilibrium liquidus lines (filled circles) and eutectic point (TE) are from ref. 1. (b) Glycerol did not crystallize (metastable
region). The glass transition temperatures of the homogenous aqueous solution Tg (black filled circles)
from ref. 2, those of the maximally freeze concentrated solution Tg’ (filled triangles) and the onset of
melting of ice in the maximally freeze-concentrated solution Tm’ (filled squares) are from ref. 3. The
values obtained from this study (open symbols). The theoretical predictions from ideal mixing are illustrated as dashed lines. Solid lines are guides for the eyes. The composition of the maximally freeze-concentrated solution (WG’) is indicated by the intercept between Tg’ and Tg.
Figure S2. Thermogram of the bulk glycerol solution (WG = 30%). (a) A first cooling ramp
from 290K to 110K (black dashed line) and heating (red solid line), (b) and (c) magnified views
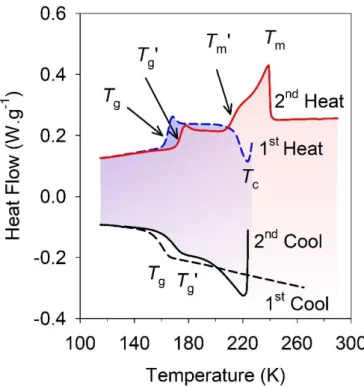
Figure S3. Thermogram of the bulk glycerol solution (WG = 60%) with application of a
specific thermal cycling. A first cooling ramp from 290K to 110K (black dashed line) presents
a liquid-to-glass transition at Tg, a subsequent first heating ramp up to 227K (blue dashed line)
presents a glass-to-liquid transition followed by crystallization (Tc), a second cooling branch
down to 110K (black solid line) presents a liquid-to-glass transition of the
maximally-freeze-concentrated solution at Tg’, and a final heating ramp up to 290K (red solid line) presents the
glass-to-liquid transition of the maximally-freeze-concentrated solution at Tg’, followed by a
broad melting peak (onset of melting Tm’ and maximum Tm located at the liquidus).
2. DSC Thermograms, and Melting Enthalpy of
confined Glycerol-Water Solutions
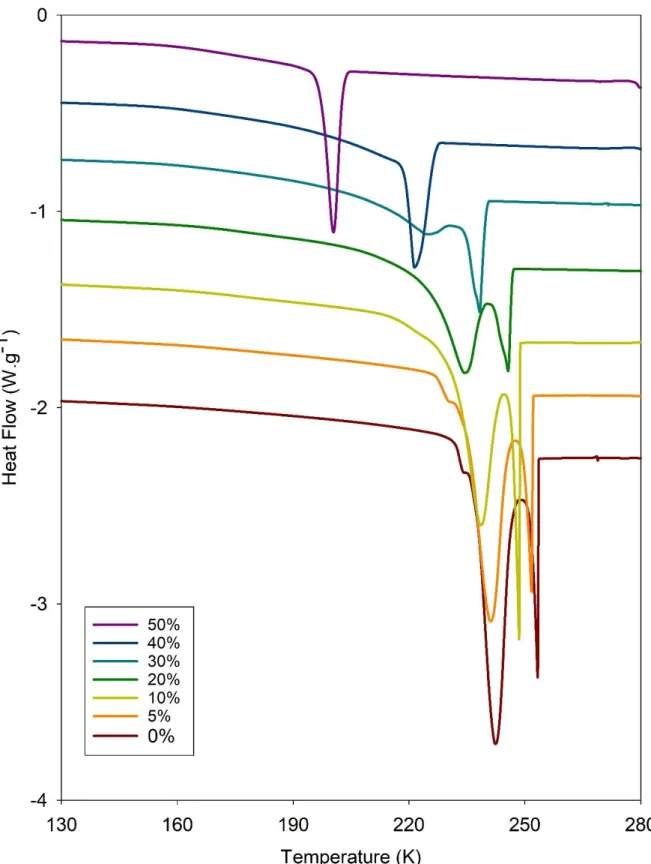
Figure S4 Thermograms of the glycerol solution confined in SBA-15 during cooling from 290 to 115K. For glycerol mass fractions ranging from 0 to 50% from bottom to top. Curves are vertically shifted by
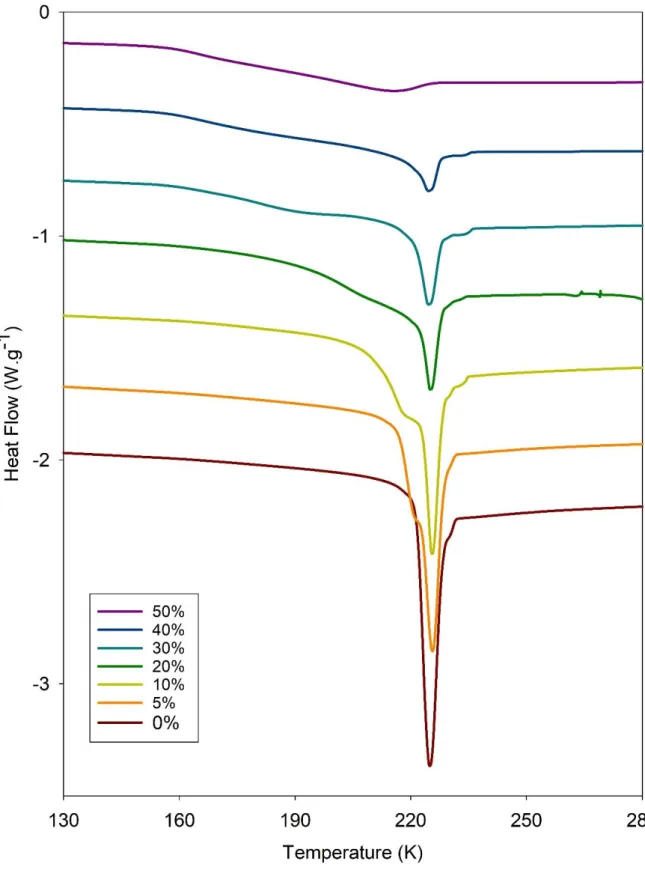
Figure S5 Thermograms of the glycerol solution confined in MCM-41 during cooling from 290 to 155K. For glycerol mass fractions ranging from 0 to 50% from bottom to top. Curves are vertically shifted by
Figure S6. Thermograms of the glycerol solution confined in SBA-15 during heating from 115 to 290K. Glycerol mass fractions ranging from 0 to 100% from top to bottom. Curves are vertically shifted by 0.1
Figure S7. Thermograms of the glycerol solution confined in MCM-41 during heating from 115 to 290K. Glycerol mass fractions ranging from 0 to 95% from top to bottom. Curves are vertically shifted
Figure S8. Thermogram of the glycerol solution confined in SBA-15 (WG = 60%) with application of a
specific thermal cycling. A first cooling ramp from 290K to 115K (black solid line) presents a liquid-to-glass transition at Tgconf, a subsequent first heating ramp up to 186K (blue solid line) presents a
glass-to-liquid transition followed by crystallization, a second cooling branch down to 115K (black dashed line) presents a liquid-to-glass transition of the maximally-freeze-concentrated solution at Tg’conf, and a
final heating ramp up to 290K (red dashed line) presents a broad melting peak.
Figure S9. Ice melting enthalpy of the glycerol solutions confined in SBA-15 (green squares) and MCM-41 (red circles) as a function of the glycerol mass fraction WG. The enthalpy was normalized with
3. Theoretical Models.
The Gibbs energy of a crystal of ice, composed of 𝑛𝑠 water molecules, occupying a cylindrical
volume with radius r and length L being contact with a solution of molar concentration x writes
as
𝐺𝑠(𝑇, 𝑛𝑠) = 𝑛𝑠𝜇𝑠(𝑇) + 2𝜋𝑟𝐿𝛾𝑠𝑙+ 2𝜋𝑟2𝛾𝑠𝑙 (S1)
where 𝜇𝑠(𝑇) is the chemical potential of water in ice and 𝛾𝑠𝑙 the ice-solution surface energy.
One notes that
𝑛𝑠 = 𝜋𝐿𝑟2
𝑣𝑠 (S2)
where 𝑣𝑠is the molar volume of water in ice.
From (S1) and (S2) one gets
𝐺𝑠(𝑇, 𝑛𝑠) = 𝑛𝑠𝜇𝑠(𝑇) + 2 𝑛𝑠𝑣𝑠
𝑟 𝛾𝑠𝑙+ 2𝜋𝑟 2𝛾
𝑠𝑙 (S3)
The melting temperature 𝑇𝑟𝑥 of the confined ice of radius r located in a solution of solute
molar fraction x is determined by the equilibrium condition between the solid and the liquid
phases, which implies that
(𝜕𝐺𝑠
𝜕𝑛𝑠) = (
𝜕𝐺𝑙
with 𝑛𝑙 and 𝐺𝑙 being respectively the number of water molecules and the total Gibbs energy of the solution that is in equilibrium with the ice crystal. If r is supposed constant, and by
definition of 𝜇𝑙(𝑇, 𝑥), the chemical potential of water in the liquid solution, one gets
𝜇𝑠(𝑇𝑟𝑥) + 2 𝑣𝑠 𝑟 𝛾𝑠𝑙 = 𝜇𝑙(𝑇𝑟 𝑥, 𝑥) (S5) 𝜇𝑠(𝑇𝑟𝑥) − 𝜇𝑙(𝑇𝑟𝑥, 𝑥) = − 2 𝑣𝑠𝛾𝑠𝑙 𝑟 (S6)
The activity of water in a glycerol liquid solution of molar fraction x confined in a pore of
radius r, at the temperature 𝑇𝑟𝑥 is defined by
𝜇𝑙(𝑇𝑟𝑥, 𝑥) = 𝜇𝑙(𝑇𝑟𝑥, 𝑥 = 0) + 𝑅𝑇𝑟𝑥 ln (𝑎(𝑟, 𝑇𝑟𝑥, 𝑥)) (S7)
where R is the gas constant.
Introducing (S7) in (S6) one gets
𝜇𝑠(𝑇𝑟𝑥) − 𝜇
𝑙(𝑇𝑟𝑥, 𝑥 = 0) − 𝑅𝑇𝑟𝑥 ln (𝑎(𝑟, 𝑇𝑟𝑥, 𝑥)) = − 2 𝑣𝑠𝛾𝑠𝑙
𝑟 (S8)
For the pure confined liquid, on gets
𝜇𝑠(𝑇𝑟0) − 𝜇𝑙(𝑇𝑟0, 𝑥 = 0) = − 2 𝑣𝑠𝛾𝑠𝑙
𝑟 = − 2 𝑣𝑠𝛾𝑠𝑙
𝑅p– 𝑒 (S9)
where 𝑇𝑟0 is the melting temperature of ice for pure water confined in a pore a radius Rp, and
e is the thickness of the unfrozen liquid layer, so that r = Rp – e.
For the bulk pure liquid, one gets
For the general case of a confined solution (i.e. eq. S8), it is needed to evaluate, 𝜇𝑠(𝑇𝑟𝑥) −
𝜇𝑙(𝑇𝑟𝑥, 𝑥 = 0) , which is the difference between the chemical potential of pure bulk water in the
solid and the liquid states. It could be evaluated by thermodynamical integration between 𝑇𝑏𝑢𝑙𝑘0 where it vanishes cf. (S10) and 𝑇𝑟𝑥, noting that for a pure system, the Gibbs-Helmholtz relation applies i.e. (𝜕( ∆𝜇 𝑇) 𝜕𝑇 ) = −∆ℎ
𝑇2 , with ∆𝜇 and ∆ℎ being the difference in the chemical potential and molar
enthalpy between ice and pure liquid water.
This integration requires a precise knowledge of the temperature variation of the heat capacity
of liquid water and ice on a broad temperature range. It has been measured experimentally by
DSC by Johari in a temperature range from 273,15 to 153K.5 The obtained results were later
parametrized by Koop at al.6, as follows:
∆𝜇0(𝑇) = 𝜇𝑠(𝑇) − 𝜇𝑙(𝑇, 𝑥 = 0) = 210368 + 131.438 𝑇 − 3.32373 . 106 𝑇−1−
41729.1 ln (𝑇) (S11).
Neglecting the temperature influence on the heat capacities, classical thermodynamics
integration can also be used to give an approximated estimate of ∆𝜇0(𝑇):
∆𝜇0(𝑇) = −∆𝐻𝑚(1 − 𝑇 𝑇𝑏𝑢𝑙𝑘0 ) − ∆𝐶𝑝(𝑇 − 𝑇𝑏𝑢𝑙𝑘 0 ) + ∆𝐶 𝑝𝑇𝑙𝑛 ( 𝑇 𝑇𝑏𝑢𝑙𝑘0 ) (S12)
with ∆𝐻𝑚 and ∆𝐶𝑝 being respectively the molar melting enthalpy and molar heat capacity difference between liquid and ice at the melting point of pure water 𝑇𝑏𝑢𝑙𝑘0 .
The later equation can be even more simplified, by considering only the first dominant term
as : ∆𝜇̂ (𝑇) = −∆𝐻0 𝑚(1 − 𝑇
𝑇𝑏𝑢𝑙𝑘0 ) (S13)
Then introducing (S11) in (S8) gives:
∆𝜇0(𝑇𝑟𝑥) − 𝑅𝑇𝑟𝑥 ln (𝑎(𝑟, 𝑇𝑟𝑥, 𝑥)) = − 2 𝑣𝑠𝛾𝑠𝑙
𝑟 (S14)
Which for the pure confined water is
∆𝜇0(𝑇𝑟0) = − 2 𝑣𝑠𝛾𝑠𝑙
𝑟 (S15)
Then assuming that 𝛾𝑠𝑙 does not vary with x and T, subtracting (S15) and (S14) gives
∆𝜇0(𝑇𝑟𝑥) − ∆𝜇0(𝑇𝑟0) − 𝑅𝑇𝑟𝑥 ln (𝑎(𝑟, 𝑇𝑟𝑥, 𝑥)) = 0 (S16)
If the limit case of ideal mixing approximation is assumed, i.e. 𝑎(𝑟, 𝑇𝑟𝑥, 𝑥) = (1 − 𝑥)
(S16) becomes
∆𝜇0(𝑇𝑟𝑥) − ∆𝜇0(𝑇𝑟0) − 𝑅𝑇𝑟𝑥 ln (1 − 𝑥) = 0 (S17)
which allows predicting the cryoscopic melting point depression in confined environment.
If ∆𝜇̂ (S13) instead of ∆𝜇0 0 (S11) is used to further approximate the chemical potential of pure bulk water, then (S14) writes as (S18), which leads to the extended Gibbs-Thomson
𝑇𝑟𝑥− 𝑇 𝑏𝑢𝑙𝑘0 = −2𝑣𝑠𝛾𝑠𝑙𝑇𝑏𝑢𝑙𝑘0 ∆𝐻𝑚𝑟 + 𝑅𝑇𝑟𝑥 𝑇𝑏𝑢𝑙𝑘0 ln (1−𝑥) ∆𝐻𝑚 (S19)
For the pure confined water (x = 0), the latter gives the classical Gibbs-Thomson equation:
𝑇𝑟0− 𝑇
𝑏𝑢𝑙𝑘0 =
−2𝑣𝑠𝛾𝑠𝑙𝑇𝑏𝑢𝑙𝑘0
∆𝐻𝑚𝑟 (S20)
and for the bulk solution, it gives the classical cryoscopic equation for ideal mixing
1 𝑇𝑏𝑢𝑙𝑘𝑥 − 1 𝑇𝑏𝑢𝑙𝑘0 = − 𝑅 ln (1−𝑥) ∆𝐻𝑚 (S21)
Combining the extended Thomson equation for the aqueous solution (S19), and
Gibbs-Thomson equation for the pure water (S20) and one can remove explicit reference to the pore
size and surface tension, and one gets
𝑇𝑟𝑥 = 𝑇𝑟0 +
𝑅𝑇𝑟𝑥 𝑇𝑏𝑢𝑙𝑘0 ln (1−𝑥)
∆𝐻𝑚 (S22)
and so the extended cryoscopic equation for ideal mixing
1 𝑇𝑟𝑥− 1 𝑇𝑟0 = − ( 𝑇𝑏𝑢𝑙𝑘0 𝑇𝑟0 ) 𝑅 ln (1−𝑥) ∆𝐻𝑚 (S23)
The predictions from this extended cryoscopic equation for ideal mixing are illustrated as
short dashed lines in Figure 4.
In order to quantify the extent of the deviation from the ideal mixing, one can calculate the
actual activity of water in the confined mixtures using the experimental values of the melting
temperatures by simple transformation of equation (S16), which gives
𝑎(𝑟, 𝑇𝑟𝑥, 𝑥) = 𝐸𝑥𝑝 {∆𝜇0(𝑇𝑟𝑥)−∆𝜇0(𝑇𝑟0)
𝑎(𝑟, 𝑇𝑏𝑢𝑙𝑘𝑥 , 𝑥) = 𝐸𝑥𝑝 {∆𝜇0(𝑇𝑏𝑢𝑙𝑘𝑥 )
𝑅𝑇𝑏𝑢𝑙𝑘𝑥 } (S25)
(S24) and (S25) allowed us to evaluate the water activity from the experimental melting
Table 1. Melting Point of Confined Pure Watera
Pore radius R (nm) Experimental melting point Tmconf (K) Theoretical melting point Tmconf (K)
4.15 260.4 258.5
1.8 230.2 229.9
aThe value of the Gibbs-Thomson constant 𝐶
𝐺𝑇 =
2𝛾𝑠𝑙𝑇𝑏𝑢𝑙𝑘0
∆𝐻𝑚𝜌𝑠 = 52.4 𝐾. 𝑛𝑚 and the thickness of the
unfreezable water layer e = 0.6 nm was used from Findennegg at al.7
Notations :
r : radius of the confined ice
Rp : pore radius
e : thickness of the interfacial liquid layer
𝑣𝑠 : molar volume of ice
𝛾𝑠𝑙 : ice-liquid surface energy
L : length of the confined ice
𝜇𝑠(𝑇) : chemical potential ice at temperature T
𝜇𝑙(𝑇, 𝑥) ∶ chemical potential of the solution of composition x at temperature T
∆𝜇0(𝑇) : difference of chemical potential between solid and liquid pure bulk water at temperature T.
4. Materials and Methods
4.1. Samples. Glycerol (>99%) were purchased from Sigma-Aldrich and used directly, without
further purification. A series of working aqueous solutions of glycerol (~5ml each) were
prepared by pipetting and addition of deionized water to glycerol. The appropriate value of the
composition (in glycerol weight fraction) was checked by measuring the mass at each stage of
the preparation. Aqueous solutions were mixed by mechanical agitation until a clear
homogeneous liquid phase was obtained and served as stock solutions for the confined systems.
The mesoporous materials MCM-41 silicates were prepared in our laboratory according to a
procedure similar to that described elsewhere8 and already used in previous works.9,10,11,12
Hexadecyl-ammonium bromide was used as template to get a mesostructured triangular array
of aligned channels with pore diameter D = 3.65 nm, and porous volume VP = 0.665 cm3 g-1.
The SBA-15 mesoporous silicates were prepared using a procedure described elsewhere,9, 13-16
with slight modifications of the thermal treatments to optimize the final structure of the
product.17 Nonionic triblock copolymer (Pluronic P
123): (EO)20(PO)70(EO)20 was used as a
template to obtain a mesostructured triangular array of aligned channels with a pore diameter
D = 8.3 nm, and porous volume VP = 1.0 cm3 g-1.
Pore size and porous volume were assessed by nitrogen adsorption, and the overall regular
porous structure of both matrices were confirmed by transmission electron microscopy and
neutron diffraction.
glycerol aqueous mixtures (typically 3-4mg) injected from a syringe to allow complete loading
of the porous volume (filling fraction 90-100%). They were then hermetically sealed in the
aluminum pans and their masses measured with a microbalance.
DSC experiments have concluded to the absence of bulk ice crystallization. They indicate that
no bulk excess liquid is present out of the matrix, and that the porosity is therefore completely
filled, in agreement with previous studies using the same filling method (cf. control of the filling
fraction).9,11,12
4.2. DSC Experiments. The differential scanning calorimetry (DSC) measurements were
performed with a Q-20 TA Instrument equipped with a liquid nitrogen cooling system. The
melting transition of an indium sample was used for calibration of temperature and heat flux.
The accuracy of the calibration was checked by measuring the melting of pure ice that gave
Tm=213.17K, Hm=310 J.g-1. The thermograms were recorded with a linear temperature ramp
on cooling and heating in the temperature range from 110 to 300K (scanning rate of 5 K.min
-1).
4.3. Control of the filling fraction
It is important to note that the control of the filling fraction with no reservoir of excess liquid
was confirmed by the absence of additional endothermic peak for all thermograms that would
have indicated the melting of a hypothetical excess of water. Moreover, we could demonstrate
with samples in which a small amount of excess solution was intentionally used that the excess
liquid was detected by an additional peak, precisely located at the bulk melting temperature (cf.
Figures S10a and S10b). In addition, we confirmed that in the presence of excess liquid, the
effect clearly indicates that the composition of the confined solution differs from the initial one
when a reservoir of excess liquid is used. This is consistent with the observed phenomena and
the experimental limitations encountered in the literature and discussed in the introductory part
of the Letter.
Figure S10. Thermogram during heating of the crystallized bulk solution (red solid line) and
confined in SBA-15 (blue dashed line) with an external reservoir of bulk excess liquid. Mass
fraction of glycerol (a) WG = 30% and (b) WG = 60%. The thermograms of the bulk solutions
Figure S11. Thermogram during heating of the crystallized solution confined in SBA-15
without (red dashed line) or with (blue solid line) an external reservoir of bulk excess liquid.
Mass fraction of glycerol (a) WG = 30% and (b) WG = 60%. The vertical solid lines indicate the
downward shift of the melting peak of the confined solution due to the presence of a reservoir
of excess liquid.
5. References
1. Lane, L., Freezing Points of Glycerol and its Aqueous Solutions. Industrial and
Engineering Chemistry 1925, 17, 924-924.
2. Murthy, S.; Singh, G., Examination of the Concentration Dependence of T-g of Binary
Aqueous Solutions. Thermochimica Acta 2008, 469 (1-2), 116-119.
3. Bachler, J.; Fuentes-Landete, V.; Jahn, D.; Wong, J.; Giovambattista, N.; Loerting,
T., Glass Polymorphism in Glycerol-Water Mixtures: II. Experimental Studies. Physical
Chemistry Chemical Physics 2016, 18 (16), 11058-11068.
4. Bachler, J.; Handle, P.; Giovambattista, N.; Loerting, T., Glass Polymorphism and
Liquid-Liquid Phase Transition in Aqueous Solutions: Experiments and Computer
Simulations. Physical Chemistry Chemical Physics 2019, 21 (42), 23238-23268.
5. Johari, G. P.; Fleissner, G.; Hallbrucker, A.; Mayer, E., Thermodynamic Continuity
between Glassy and Normal Water. Journal of Physical Chemistry 1994, 98 (17), 4719-4725.
7. Findenegg, G. H.; Jahnert, S.; Akcakayiran, D.; Schreiber, A., Freezing and Melting
of Water Confined in Silica Nanopores. Chemphyschem 2008, 9 (18), 2651-2659.
8. Grun, M.; Lauer, I.; Unger, K. K., The Synthesis of Micrometer- and
Submicrometer-Size Spheres of Ordered Mesoporous Oxide MCM-41. Advanced Materials 1997, 9 (3),
254-&.
9. Alba-Simionesco, C.; Dosseh, G.; Dumont, E.; Frick, B.; Geil, B.; Morineau, D.;
Teboul, V.; Xia, Y., Confinement of Molecular Liquids: Consequences on Thermodynamic,
Static and Dynamical Properties of Benzene and Toluene. European Physical Journal E 2003,
12 (1), 19-28.
10. Morineau, D.; Dosseh, G.; Alba-Simionesco, C.; Llewellyn, P., Glass Transition,
Freezing and Melting of Liquids Confined in the Mesoporous Silicate MCM-41.
Philosophical Magazine B 1999, 79 (11-12), 1847-1855.
11. Morineau, D.; Xia, Y. D.; Alba-Simionesco, C., Finite-Size and Surface Effects on
the Glass Transition of Liquid Toluene Confined in Cylindrical Mesopores. Journal of
Chemical Physics 2002, 117 (19), 8966-8972.
12. Morineau, D.; Guegan, R.; Xia, Y.; Alba-Simionesco, C., Structure of Liquid and
Glassy Methanol Confined in Cylindrical Pores. Journal of Chemical Physics 2004, 121 (3),
1466-1473.
13. Zhao, D.; Huo, Q.; Feng, J.; Chmelka, B.; Stucky, G., Nonionic Triblock and Star
Diblock Copolymer and Oligomeric Surfactant Syntheses of Highly Ordered, Hydrothermally
Stable, Mesoporous Silica Structures. Journal of the American Chemical Society 1998, 120
(24), 6024-6036.
14. Audonnet, F.; Brodie-Linder, N.; Morineau, D.; Frick, B.; Alba-Simionesco, C.,
15. Dosseh, G.; Brodie-Linder, N.; Frick, B.; Le Quellec, C.; Morineau, D.;
Alba-Simionesco, C., Dynamical Properties of Toluene and ortho-Terphenyl Confined in MCM-41
and SBA-15 Mesoporous Materials. Annales De Chimie-Science Des Materiaux 2005, 30 (4),
365-373.
16. Xia, Y. D.; Dosseh, G.; Morineau, D.; Alba-Simionesco, C., Phase Diagram and
Glass Transition of Confined Benzene. Journal of Physical Chemistry B 2006, 110 (39),
19735-19744.
17. Brodie-Linder, N.; Dosseh, G.; Alba-Simonesco, C.; Audonnet, F.; Imperor-Clerc,
M., SBA-15 synthesis: Are there Lasting Effects of Temperature Change within the First 10