MIT Global Scale Network
MIT SCALE RESEARCH REPORT
The MIT Global Supply Chain and Logistics Excellence (SCALE) Network is an international alliance of
leading-edge research and education centers, dedicated to the development and dissemination of global
innovation in supply chain and logistics.
The Global SCALE Network allows faculty, researchers, students, and affiliated companies from all six centers around the world to pool their expertise and collaborate on projects that will create supply chain and logistics innovations with global applications.
This reprint is intended to communicate research results of innovative supply chain research completed by faculty, researchers, and students of the Global SCALE Network, thereby contributing to the greater public knowledge about supply chains.
For more information, contact
MIT Global SCALE Network
Postal Address:
Massachusetts Institute of Technology 77
Massachusetts Avenue, Cambridge, MA 02139 (USA)
Location:
Building E40, Room 267 1 Amherst St. Access: Tel: +1 617-253-5320 Fax: +1 617-253-4560 Email: [email protected] Website: scale.mit.edu Research Report: ZLC-2016-9
Building a Segmented Cost-To-Serve Model
MIT Global Scale Network
For Full Thesis Version Please Contact:
Marta Romero
ZLOG Director
Zaragoza Logistics Center (ZLC)
Edificio
Náyade 5, C/Bari 55 – PLAZA 50197
Zaragoza, SPAIN
Email: [email protected]
Telephone: +34 976 077 605
KEY INSIGHTS
1. Documented a relevant case study to explain the concepts of cost-to-serve
2. Established a framework for data requirements and the execution of a cost-to-serve analysis 3. Identified cost drivers, relevant activities, and
thought-provoking data visualizations and metrics
4. Created alternate uses for CTS results, including the calculation of a customer’s lifetime value
Introduction
A CTS analysis is a process to quantify the costs of activities, engaged in by a company, in order to fulfill customer demand for a product through the end-to-end supply chain. This excludes costs that are absorbed into the cost of goods and instead looks at activities that do not add direct value to the product (i.e.. make up in-direct costs). The total costs of these activities must be allocated to specific products or families of products relative to their consumption. This allows for visibility into the costs which are specific to the given product or product family. This can be done in
terms of volume ratios, time ratios, or other measures of consumption.
Objectives
The primary research objective of this thesis is to develop a CTS model to identify how each activity, undertaken to get a product to its customer, contributes to the overall reduction in gross profit for that product. A good way to think of it is to consider creating an income statement for a single product. The cost detail included in an income statement, at the product level, is similar to the visibility that a CTS analysis attempts to provide.
The first step in creating a model is to build the framework, which includes determining cost allocation methods and identifying which costs should be considered in the analysis. Next, it is essential to design a data gathering strategy and that can be executed in the given timeline. Once the data has been gathered, it will need to be integrated into a central location and displayed using data visualization software. The visualizations will need to demonstrate an ability to create segmentations and identify unique insights.
To summarize, the thesis objectives are:
Building a Segmented
Cost-To-Serve Model
By Tyler Cheever Lewis Martin & Lucía Milián AriñoThesis Advisor: Alejandro Serrano, Ph.D. Supply Chain Management area
Summary: A cost-to-serve analysis was used to create visibility into supply chain costs of a major
manufacturer of medical sutures. An interactive data tool was built in Tableau to allow visualization of the data and provide calculators to perform scenario simulations.
M. Eng. Logistics & Supply Chain Management, MIT- Zaragoza International Logistics Program (2016) B.S. Industrial Design Engineering, UJI, Castellón, Spain (2007) M. Eng. Logistics &
Supply Chain Management, MIT- Zaragoza International Logistics Program (2016) Work Experience: NASA, Accenture B.S. Aerospace Engineering, Missouri University of Science & Technology,
Missouri, USA (2013)
1. Identify applicable cost drivers and the activities that make up the cost drivers 2. Create a methodology to allocate costs
by product family and quantify activity costs
3. Segment data to allow drill down into various demographics (i.e., customer, distribution channel, final warehouse destination, and so on)
4. Build interactive dashboard to provide data visualization and unique insights The expectation of these objectives is to reduce annual supply chain costs by $4M- $5.5M. This number was proposed by a major consulting firm after reviewing the balance sheet of the sponsor and comparing it to the savings of similar companies that have implemented supply chain visibility projects in the past.
A number of articles, including Supply Chain Brain (2015) and Braithwaite (1998), were consulted to understand the concept of a CTS analysis. Given that the concept is relatively new, there was less information to be found in published journals and textbooks. However, the resources that were available set the framework for turning the abstract vision into an actual model and tool.
Implementation
In order to begin the analysis, it is essential to identify which major costs are primary drivers behind the total cost of the supply chain. The cost drivers are not activities themselves, but instead they are aggregations of similar activities within the supply chain. For instance, if customer order changes are identified as a major cost, a potential cost driver may include change requests, emergency expediting, scrap and other activities related to customer order changes. Supply chain scope and product need to be defined. For this specific case, interviews were performed with leaders across the supply chain planning department to identify cost drivers and the results were approved by stakeholders to make sure there was agreement within the organization. The cost drivers that were identified for this model are: Work Orders, Sales Orders, Setup Costs, Quality Control, Inventory Management,
Distribution Packaging and Administration Costs.
The cost allocation method being used for this analysis is closely related to activity based costing (ABC), but designed from the ground up for the specific sponsor. ABC is a methodology used to calculate the cost of items by quantifying and allocating the activity specific costs of producing an item, rather than dividing the aggregated total cost by total production volume. This allows for the mapping of resource consumption to individual product.
The Tool: An Interactive Dashboard
Once the relevant cost driver data is gathered and the costs have been allocated appropriately, the results need to be displayed in a variety of ways to cater to both technical employees and executive level decision makers.
The solution was to offer an interactive dashboard with a suite of detailed tables and high-level visual metrics. Both the tables and visualizations should allow for drill-down and filtering by the user if applicable.
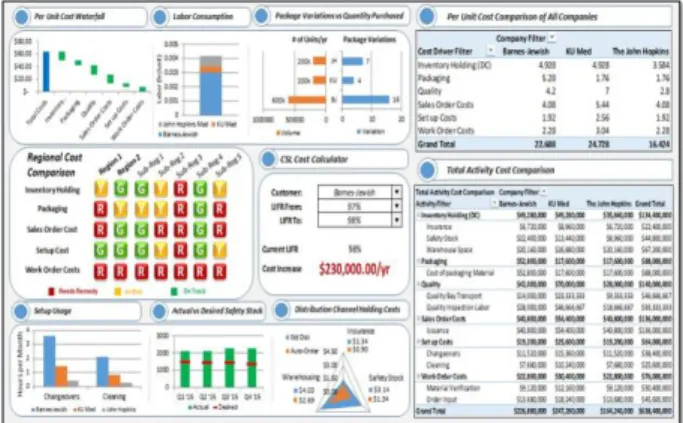
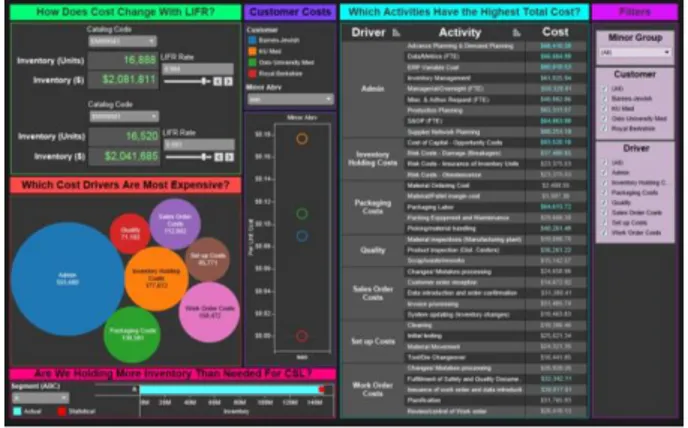
Once the initial Excel draft has been approved, a quick iteration process starts in order to identify the correct metrics. As these metrics solidify, the data and visuals will be migrated into the data visualization tool Tableau for a more seamless data visualization experience. The preliminary dashboards for both the Excel model and Tableau are shown below, while more detailed views can be found in the thesis.
Figure 2: Preliminary Tableau Dashboard
Key Performance Metrics
Identifying which metrics to display can often be challenging. There should be a limited number of key performance indicators (KPIs) that can quickly tell a story, provoke investigations and enable business decisions for the stakeholders. When proposing metrics, a logical categorization was used to make it easier to align the metrics to the strategic goals of the organization. In addition, a variety of metrics were offered in each category to help stakeholders home in on measurements that will be most useful for their organization.
Conclusions
With the framework established and the cost allocation methodology identified, the CTS model and tool were built up in a manner that goes beyond what can be found in most current text and articles. The contributions of this thesis include a relevant case study to explain the concepts of cost-to-serve, a strategy for data requirements, a framework for the execution of the analysis, identification of cost drivers and relevant activities, thought provoking data visualizations and metrics, and industry leading applications of the final results.
The contributions for the sponsor include a customized version of the industry contributions. This includes cost drivers and activities that are specific to the business of the sponsor, specific data requirements that will need to be gathered, built-to-order dashboard and metrics, and specific guidance on the next steps to completion.
Overall, the thesis has taken an abstract concept of creating supply chain visibility, and created a vision, designed a strategy to execute
the vision, and launched implementation towards completion of the strategy.
The newly acquired information obtained from the CTS model can also be used to further expand the understanding of the company’s customer base and provide input into unique analyses that were not possible before, such as Customer Lifetime Value (CLV) and Segmentations.
Developing a CLV from a lifetime CTS model will make it possible to identify which customers are more favorable for investments to encourage retention and which customers are not as favorable. It can also help to segment customers for preferential services to improve satisfaction of the more desirable ones.
This research set out to develop a CTS model that could help the sponsor company to identify how each activity, in the process of getting a product to its customer, contributes to the overall reduction in gross profit for that product and how this information can be of use for making strategic business decisions such as customer segmentation.
Cited sources
Braithwaite, A. Samakh, E.Alan
Braithwaite, Edouard Samakh, (1998)
The Cost‐to‐Serve Method, The
International Journal of Logistics Management, Vol. 9 Is. 1, pp. 69-84. SupplyChainBrain. (n.d.) How to build a
Cost-to-Serve model. Retrieved
December 5, 2015 from