READ THESE TERMS AND CONDITIONS CAREFULLY BEFORE USING THIS WEBSITE.
https://nrc-publications.canada.ca/eng/copyright
Vous avez des questions? Nous pouvons vous aider. Pour communiquer directement avec un auteur, consultez la première page de la revue dans laquelle son article a été publié afin de trouver ses coordonnées. Si vous n’arrivez pas à les repérer, communiquez avec nous à PublicationsArchive-ArchivesPublications@nrc-cnrc.gc.ca.
Questions? Contact the NRC Publications Archive team at
PublicationsArchive-ArchivesPublications@nrc-cnrc.gc.ca. If you wish to email the authors directly, please see the first page of the publication for their contact information.
Archives des publications du CNRC
This publication could be one of several versions: author’s original, accepted manuscript or the publisher’s version. / La version de cette publication peut être l’une des suivantes : la version prépublication de l’auteur, la version acceptée du manuscrit ou la version de l’éditeur.
Access and use of this website and the material on it are subject to the Terms and Conditions set forth at Energy-efficient lighting options: predicted savings and occupant impressions of lighting quality
Newsham, G. R.; Veitch, J. A.
https://publications-cnrc.canada.ca/fra/droits
L’accès à ce site Web et l’utilisation de son contenu sont assujettis aux conditions présentées dans le site LISEZ CES CONDITIONS ATTENTIVEMENT AVANT D’UTILISER CE SITE WEB.
NRC Publications Record / Notice d'Archives des publications de CNRC: https://nrc-publications.canada.ca/eng/view/object/?id=1df9e20e-9d60-4ce6-9a80-6ba2063d9016 https://publications-cnrc.canada.ca/fra/voir/objet/?id=1df9e20e-9d60-4ce6-9a80-6ba2063d9016
Guy R. Newsham, Ph.D. and Jennifer A. Veitch, Ph.D. Institute for Research in Construction (M-24)
National Research Council of Canada
Montreal Road, Ottawa, Ontario, CANADA, K1A 0R6 tel : (613) 993-9607; fax: (613) 954-3733
email: guy.newsham@nrc.ca
WWW: http://www.cisti.nrc.ca/irc/light/lq_project/lqp.html
Paper presented at CLIMA 2000 Conference, Brussels, Belgium, August 31-September 2, 1997.
Abstract
Detailed simulations of lighting and HVAC energy consumption were performed on a prototype office building in six North American climates. The goal of these simulations was to calculate the overall energy savings attributable to reductions in lighting power density (LPD) from 25.8 W/m2 (past practice) to 17.2 W/m2 (current code) to 8.6 W/m2
(low). Results showed that as LPD decreases, reductions in cooling energy, due to reductions in heat produced by lighting, could substantially increase cost savings over the cost savings attributable to lighting in isolation, particularly in warm climates. Further, nine different lighting designs were installed in a windowless, 83 m2 (880 ft2), mock-up
open-plan office space, containing six workstations. The nine lighting designs resulted from a combination of the three LPDs used in the simulations, created using three ambient lighting technologies (recessed troffers with prismatic lenses; recessed troffers with parabolic louvers; indirect or direct/indirect fixtures); in the low lighting power density options, the ambient lighting systems were supplemented with task lighting. At least thirty participants, in groups of three to six, worked for a full day under one design (292
participants in total). They performed a variety of computer-based and paper-based tasks designed to be representative of modern office work, and completed questionnaires to assess satisfaction and impressions of lighting quality. Ratings of environmental
satisfaction, lighting quality, task difficulty, and self-reported productivity indicated that participants preferred parabolic louver fixtures over prismatic lens fixtures, and preferred the low energy lighting designs.
Résumé
Des simulations détaillées de consommation d'énergie pour l'éclairage, le chauffage, la ventilation et le conditionnement de l’air ont été effectuées sur un prototype de bâtiment de bureaux dans six climats nord-américains. L'objectif de ces simulations était de calculer les économies d'énergie globales attribuables aux réductions de la densité de puissance lumineuse (DPL) de 25,8 W/m2 (antérieurement) à 17,2 W/m2 (code actuel) et à 8,6 W/m2 (faible). Les résultats ont indiqué que, au fur et à mesure que la DPL diminue, les
réductions d'énergie de refroidissement dues à une diminution de la chaleur produite par l'éclairage, pourraient augmenter sensiblement les économies par rapport à celles
attribuables à l'éclairage seul, particulièrement dans les climats chauds. En outre, neuf types d'éclairage différents ont été installés dans une maquette de bureau en espace fonctionnel sans fenêtre de 83 m2 (880 pi2) contenant six postes de travail. Les neuf types
d'éclairage résultaient d'une combinaison des trois DPL utilisées dans les simulations, créées à l’aide de trois technologies d'éclairage ambiant (chemins lumineux avec verres diffuseurs prismatiques, chemins lumineux encastrés avec paralumes paraboliques, appareils indirects ou directs et indirects). Dans les options de densité de puissance lumineuse faible, les systèmes d'éclairage ambiant ont été complétés par un éclairage direct. Au moins trente participants, par groupes de trois à six, ont travaillé une journée entière sous un modèle (292 participants en tout). Ils ont effectué une variété de travaux sur ordinateur et sur papier censés représenter les activités de bureau d'aujourd'hui et ils ont rempli des questionnaires pour évaluer leur degré de satisfaction et leurs impressions sur la qualité de l'éclairage. Les évaluations de satisfaction environnementale, de qualité de l'éclairage, de difficulté des tâches et de productivité déclarée par les intéressés ont indiqué que les participants préféraient les appareils à paralumes paraboliques aux appareils à verres diffuseurs prismatiques et les modèles d'éclairage à faible énergie.
1.0 Introduction
Jurisdictions in many countries have model energy codes that restrict building energy consumption for all uses, including lighting [ASHRAE/IES, 1989; Canadian Codes Centre, 1995]. Critics fear that as lighting power drops, the quality of the lit environment will decline [e.g., Benya & Webster, 1977; Begemann, 1983]. Poor lighting quality is commonly assumed to have a detrimental effect on the ability of people to perform their work; nevertheless, no widely accepted measure of lighting quality currently exists [Veitch & Newsham, in press].
Previous attempts to develop such a measure in an experimental setting have suffered from a number of shortcomings, including: a narrow definition of what constitutes quality lighting, short exposure time to lighting systems, small numbers of participants, participants that are unrepresentative of the general population, and tasks that are unrepresentative of modern office tasks [Veitch & Newsham, in press]. The National Research Council of Canada (NRC) is carrying out a series of experiments addressing lighting quality, experiments designed to avoid the shortcomings listed above.
NRC also conducted detailed energy simulations to assess the impact on office building energy consumption of various lighting power densities (LPDs). LPD differences do not affect the energy consumption of the lighting system alone. Lighting systems also produce heat: reducing LPD reduces the amount of heat produced by the lighting system, which increases the load on the building heating system during the heating season, and reduces the load on the building cooling system during the cooling season. When assessing the energy impact of LPD reductions, it is important to consider these interactions. In a hot
climate the overall savings may be substantially larger than those attributable to the lighting system in isolation, whereas in a cold climate the opposite may be true.
Any rational evaluation of an office lighting system should consider both the effect on the overall building energy consumption, and the effects on occupants’ satisfaction and performance. Our hypothesis was that the quality of the lighting design as judged by lighting practitioners (Designers’ Lighting Quality, or DLQ) directly relates to the performance, satisfaction, and mood of occupants, but that these outcomes are not
necessarily compromised by LPD reductions. If supported, this hypothesis would endorse the view that energy efficiency and lighting quality are not fundamentally opposed.
2.0 Materials and Methods 2.1 Energy simulations
We performed detailed building energy simulations using the DOE-2.1E package [Winkelmann, Birdsall, Buhl, Ellington, Erden, Hirsch & Gates, 1993].
2.1.1 Definition of Cities for Simulation
We chose six cities as representative of a variety of North American climates: Washington, DC; Edmonton, Alberta; Houston, Texas; Montréal, Québec; Phoenix, Arizona; and, Seattle, Washington.
2.1.2 Definition of Commercial Building Prototype
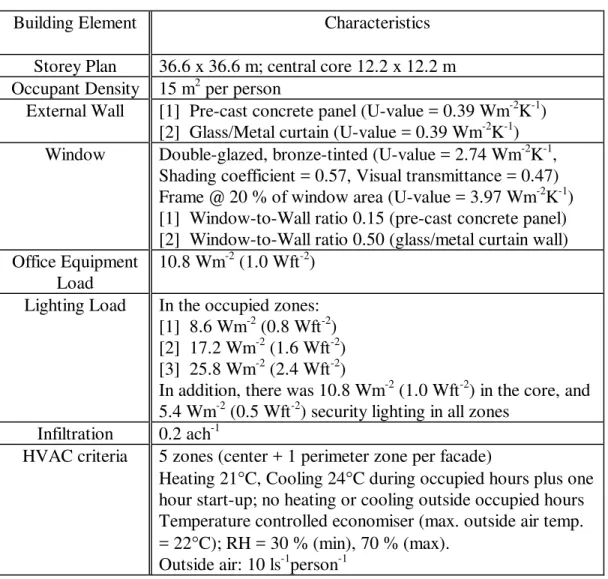
We chose to model a single storey of a typical office building. This single storey was considered to be sandwiched between two other identical storeys, and thus there was no thermal transfer to other storeys. Table 1 summarises the building parameters.
Table 1. Characteristics of the office building used in the energy simulations; parametric options are indicated by the numbers in square brackets.
Building Element Characteristics
Storey Plan 36.6 x 36.6 m; central core 12.2 x 12.2 m Occupant Density 15 m2 per person
External Wall [1] Pre-cast concrete panel (U-value = 0.39 Wm-2K-1) [2] Glass/Metal curtain (U-value = 0.39 Wm-2K-1)
Window Double-glazed, bronze-tinted (U-value = 2.74 Wm-2K-1,
Shading coefficient = 0.57, Visual transmittance = 0.47) Frame @ 20 % of window area (U-value = 3.97 Wm-2K-1) [1] Window-to-Wall ratio 0.15 (pre-cast concrete panel) [2] Window-to-Wall ratio 0.50 (glass/metal curtain wall) Office Equipment
Load
10.8 Wm-2 (1.0 Wft-2)
Lighting Load In the occupied zones: [1] 8.6 Wm-2 (0.8 Wft-2)
[2] 17.2 Wm-2 (1.6 Wft-2)
[3] 25.8 Wm-2 (2.4 Wft-2)
In addition, there was 10.8 Wm-2 (1.0 Wft-2) in the core, and
5.4 Wm-2 (0.5 Wft-2) security lighting in all zones
Infiltration 0.2 ach-1
HVAC criteria 5 zones (center + 1 perimeter zone per facade)
Heating 21°C, Cooling 24°C during occupied hours plus one hour start-up; no heating or cooling outside occupied hours Temperature controlled economiser (max. outside air temp. = 22°C); RH = 30 % (min), 70 % (max).
Outside air: 10 ls-1person-1
We based lighting use schedules on occupancy schedules predicted by a stochastic model of office occupancy [Newsham, Mahdavi & Beausoleil-Morrison, 1995]. Figure 1 (a) shows the lighting load profiles generated by the stochastic model. We derived use profiles for office equipment from field measured values for desktop personal computers and photocopiers [Newsham & Tiller, 1994; Szydlowski & Chvala, 1994]. Figure 1 (b) shows these office equipment load profiles.
2.2 Experiment in the mock-up office
2.2.1 Setting
NRC’s Indoor Environment Research Facility (IERF) is a 12.2 x 7.3 x 2.7 m (40 x 24 x 9 ft) chamber designed for acoustics, lighting, ventilation, and indoor air quality research [Shaw, Barakat, Newsham, Veitch, & Bradley, 1995]. The IERF was outfitted as a
standard mid-grade open-plan office containing six 6 m2 (64 ft2) workstations separated by
1.68 m (66 ″) high partitions. The workstations were of standard modular systems furniture and each featured a computer, storage space, a keyboard shelf, and an adjustable-height chair. For this experiment, the office was windowless. Ventilation, temperature, humidity, and noise were controlled over all experimental sessions within normal guidelines for office environments. Table 2 details the conditions prevailing over the period of data collection.
Table 2. The mean and standard deviations in various physical parameters over the study period. Ventilation rate was based on 25 spot measurements, other values were
based on measurements at 30 minute intervals throughout the study period.
Ventilation Rate (l/s) Temperature (°C) Relative Humidity (%) A-weighted Sound (dBA) 336 ± 15 * 23.2 ± 0.5 36 ± 14 48.3 ± 2.0 * 25 % outdoor air
2.2.2 Lighting designs (independent variable)
A panel of three experienced lighting practitioners developed nine lighting designs for the six-person open-plan office. The nine configurations are all possible combinations of three LPD levels (representative of: past practice (high), current energy codes (medium), and future energy-use targets (low); and close to the LPD levels used in the energy modelling), and three levels of DLQ (low, medium, and high). The configurations are described in Table 3. The validity of the DLQ levels for North American offices was subsequently determined by surveying international lighting designers [Veitch & Newsham, 1996]. All lighting designs meet at least the minimal criteria for visibility and task performance for office work [Rea, 1993]; indeed, all are designs that can exist in the field The lighting designs were installed on at least three separate two-day periods in a random sequence during the period of the study (January to September, 1996).
We made detailed measurements of relevant lighting parameters using both spot measurements and a video photometer system [Rea & Jeffrey, 1990]. Table 4 shows selected spot luminance and illuminance measurements for each of the designs.
2.2.3 Participants
There were at least 30 participants in each experimental condition, tested in groups of up to six at a time. The participants were assigned randomly to the lighting designs; each participant experienced only one of the lighting conditions. The participants were recruited from an office temporary agency, and hired at the standard rate for a day’s clerical work. The participants ranged in age from 18-61; there were 142 women and 150 men. Participants were required to have experience with Windows-based word
processing and spreadsheet software and to pass a minimum level on their agency’s Word Fluency test. They were not told initially that the study concerned lighting or
energy-efficiency because this knowledge might have biased their behaviour during the day, but they were given a complete verbal description of the experiment upon the completion of the day’s tasks.
Table 3. The lighting equipment used to create the nine lighting designs, and their measured LPD (including task lighting where applicable).
LPD
DLQ 1 (low) 2 (medium) 3 (high)
1 (low) electronic ballasts electronic ballasts magnetic ballasts
Recessed troffer with K12 prismatic lens 1’x 4’ fixture with 1-lamp T8 (x 20) + task lamps (x 12) 1' x 4' fixture with 2-lamp T8 (x 20) 1' x 4' fixture with 2-lamp T12 (x 20) 9.3 W/m2 (0.9 W/ft2) 12.9 W/m2 (1.2 W/ft2) 19.8 W/m2 (1.8 W/ft2)
2 (medium) electronic ballasts electronic ballasts magnetic ballasts
Recessed troffer with parabolic louver 8” x 4' fixture with 1-lamp T8 (x 20) + task lamps (x 12) 1’ x 4' fixture with 2-lamp T8 (x 20) 1' x 4’ fixture with 2-lamp T12 (x 25) 9.3 W/m2 (0.9 W/ft2) 13.3 W/m2 (1.2 W/ft2) 25.1 W/m2 (2.3 W/ft2)
3 (high) electronic ballasts electronic ballasts magnetic ballasts
Indirect or direct/indirect
4’-long fixture with 2-lamp T8 (x 8) + task lamps (x 12)
36'-long fixture with 32 4’ lamps T8 (x 2)
36'-long fixture with 32 4’ T8 lamps (x 2) furniture-mounted indirect suspended direct/indirect suspended indirect 8.0 W/m2 (0.7 W/ft2) 11.3 W/m2 (1.1 W/ft2) 20.9 W/m2 (1.9 W/ft2)
All task lamps: each workstation had one angle-arm fixture and one undershelf fixture. Lamp wattages: T8 lamps: 32 W; T12 lamps: 40 W; angle-arm task lamps: 13 W PL compact fluorescents; undershelf task lamps: 17 W T8 2’, all 3500 K colour temperature.
Table 4. Selected spot luminance and illuminance measurements. Lighting Design Desktop Illuminance (lux) Desktop Luminance (cd/m2) Partition Luminance(cd/m2)
DLQ LPD left right left right upper lower
1 1 745 365 93 50 29 22 1 2 430 395 57 64 46 34 1 3 525 490 77 72 62 42 2 1 748 400 110 57 21 22 2 2 510 465 65 60 30 27 2 3 540 450 70 61 33 27 3 1 540 320 74 46 33 24 3 2 655 560 98 88 47 43 3 3 705 618 100 90 72 54 2.2.4 Dependent measures
During the day, the participants worked on a variety of tasks selected to be representative of the common visual, motor, and cognitive elements of office work (e.g., typing, reading for comprehension, proofreading) and were also asked to respond to questionnaires concerning their mood, comfort, and aesthetic judgements of the room. In addition, demographic information, office furnishing preferences, and relevant personality variables were also measured. Only a subset of these will be discussed in this paper.
Most tasks and questionnaires were computer-based, and were presented using custom software [Newsham, Veitch & Scovil, 1995; Newsham & Tiller, 1995]. Using
computerised tasks greatly increased the efficiency of data collection, and allowed us to analyse a variety of dependent variables for sensitivity to changes in lighting conditions. For example, the computerised typing task allowed us to measure overall typing speed and accuracy, as well as changes in typing speed and accuracy minute-by-minute. Some tasks were presented on paper (e.g., reading comprehension), such that the overall mix of computer-based and paper-based tasks was not atypical of real office work.
Visual performance was assessed at both the beginning and end of the day using the Vision and Lighting Diagnostic Kit (VALiD) [Rea, 1988]. Participants were tested one at a time in a private booth outside the IERF. Using these data we were able to evaluate whether changes in visual performance over the day could be attributed to lighting design.
3.0 Results
3.1 Energy simulations
Tables 5 and 6 show the results of the energy simulations for window-to-wall ratios (WWR) of 0.50 (glass-curtain wall) and 0.15 (concrete panel wall), respectively. The
tables show annual delivered energy consumption for cooling, heating, lighting and office equipment, and fans, normalised by total occupied floor area. Delivered energy is the energy supplied to the space and does not account for system efficiencies.
Figure 2 plots the normalised, annual delivered energy consumption vs. LPD for
Edmonton and Houston, at a WWR of 0.50. We chose these cities because they represent the extremes of heating- and cooling-dominated climates in our sample of six cities.
Tables 5 & 6. Annual delivered energy consumption for cooling, heating, lighting and office equipment, and fans, normalised by total occupied floor area, WWR = 0.50, and
WWR = 0.15, respectively.
WWR = 0.50 WWR = 0.15
LPD,
W/m2 Annual Energy Consumption,kWh/m2 W/mLPD,2 Annual Energy Consumption,kWh/m2
Cooling Heating Light + Off Eqp
Fans Cooling Heating Light + Off Eqp Fans Washington, DC Washington, DC 8.6 92.5 55.6 68.7 33.0 8.6 71.6 44.0 68.7 18.5 17.2 103.3 49.9 90.4 36.7 17.2 81.8 38.1 90.4 22.3 25.8 114.5 46.0 112.1 40.5 25.8 92.7 34.7 112.1 26.3 Edmonton, AB Edmonton, AB 8.6 25.2 153.9 68.7 34.9 8.6 16.0 127.5 68.7 18.4 17.2 28.7 145.0 90.4 38.2 17.2 19.2 118.1 90.4 22.0 25.8 32.4 137.6 112.1 41.7 25.8 22.9 110.5 112.1 25.8 Houston, TX Houston, TX 8.6 162.2 15.4 68.7 34.1 8.6 128.6 11.8 68.7 19.3 17.2 179.5 13.4 90.4 38.0 17.2 145.1 9.7 90.4 23.4 25.8 197.4 12.4 112.1 42.1 25.8 162.7 8.9 112.1 27.7 Montréal, QC Montréal, QC 8.6 47.7 114.0 68.7 31.7 8.6 35.4 92.7 68.7 17.9 17.2 54.1 105.2 90.4 35.2 17.2 41.5 83.1 90.4 21.7 25.8 60.7 97.6 112.1 38.0 25.8 48.0 76.0 112.1 25.6 Phoenix, AZ Phoenix, AZ 8.6 171.9 25.4 68.7 41.2 8.6 120.5 19.5 68.7 21.7 17.2 187.4 25.5 90.4 44.6 17.2 135.5 19.2 90.4 25.5 25.8 203.7 26.6 112.1 48.3 25.8 151.5 20.6 112.1 29.6 Seattle, WA Seattle, WA 8.6 33.5 52.8 68.7 31.9 8.6 23.3 37.1 68.7 17.5 17.2 38.3 44.0 90.4 35.4 17.2 27.6 28.5 90.4 21.2 25.8 43.3 37.2 112.1 39.0 25.8 32.5 23.0 112.1 25.1
3.2 Responses from experiment participants
No statistically significant differences between groups were found on a variety of measured individual difference variables. This gives us confidence that any differences between groups in the outcomes related to lighting design were not biased by the characteristics of the individuals within the groups.
This paper presents the results of a two multivariate analyses of variance (MANOVA). We grouped together conceptually related subsets of the measured outcomes. One analysis considered the ratings of Environmental Satisfaction [Sundstrom, Town, Rice, Osborn, & Brill, 1994], Environmental Features [Stokols & Scharf, 1990], and Lighting Quality [Collins, Fisher, Gillette, & Marans, 1990]. The second analysis considered nine items from a Workday Experiences questionnaire. Both MANOVAs used the same model, testing eight planned comparisons, each with one degree of freedom, based on hypotheses derived from the experimental design (Table 7).
Table 7. The planned comparisons tested for the ratings data. Comments column expresses the comparisons in terms of the associated lighting technologies.
Comparison Levels Tested Comments
DLQA DLQ3 vs (DLQ1&2) direct/indirect vs recessed troffers DLQB DLQ1 vs DLQ2 prismatic lens vs parabolic louver LPDA LPD3 vs (LPD1&2) magnetic ballast vs electronic ballast LPDB LPD1 vs LPD2 task lighting vs no task lighting DLQA x LPDA
DLQA x LPDB Interactions of the above effects
DLQB x LPDA DLQB x LPDB
We conducted a data reduction process to convert the responses to individual questions into simpler and more interpretable constructs, or composite ratings (see Appendix). This process resulted in seven dependent variables related to quality or satisfaction judgements about the physical environment, which we used in the first MANOVA: overall ratings of environmental satisfaction (ES), and lighting quality (LQ), and five components derived from ratings of environmental features: noise and distraction (REF_NOIS), ventilation (REF_VENT), furniture (REF_FURN), washrooms(REF_WASH), and lighting (REF_LITE). Data reduction was not beneficial for the responses to the Workday Experiences questionnaire. We therefore treated the responses to the nine questions as separate dependent variables (WKQ1 to WKQ9) in the second MANOVA.
Tables 8 & 9 summarise the results of the statistical analyses of satisfaction judgements and work-related judgements, respectively. In keeping with common practice, we interpreted only those univariate tests that were associated with significant multivariate effects (p < 0.05); this procedure offers some protection against experimentwise Type I
statistical errors. Only the statistically significant outcomes are shown here. The table includes a measure of the effect size (R2) expressed as the percentage of explained
variance associated with the effect. For the multivariate tests, this is the average of the effect sizes for all the variables in the analysis (e.g., seven for the satisfaction judgements; nine for the work-related judgements).
Table 8. MANOVA summary table of significant multivariate effects, and their associated significant univariate effects, for the satisfaction judgements.
Multivariate Comparison Univariate Effect Wilks’ λ F df R2 DLQB x LPDA 0.942 2.40 7, 274 0.013 ES 6.17 1, 280 0.022 LQ 4.13 1, 280 0.015 REF_NOIS 4.04 1, 280 0.014 REF_LITE 5.37 1, 280 0.019 LPDB 0.949 2.10 7, 274 0.016 ES 4.98 1, 280 0.017 LQ 9.26 1, 280 0.032 REF_VENT 4.00 1, 280 0.014 REF_FURN 4.77 1, 280 0.018 REF_LITE 7.13 1, 280 0.025
Table 9. MANOVA summary table of significant multivariate effects, and their associated significant univariate effects, for the work-related judgements.
Multivariate Comparison Univariate Effect Wilks’ λ F df R2 DLQB 0.920 2.59 9, 269 0.009 WKQ8 4.36 1, 277 0.015 WKQ9 10.15 1, 277 0.035 LPDA 0.929 2.29 9, 269 0.004 WKQ7 7.21 1, 277 0.027
Figures 3-5 show the means of the significant univariate constructs related to the overall office environment (ES) and specifically to lighting (LQ; and REF_LITE), and to the work-related judgements (WKQ8, overall task difficulty; and, WKQ9, self-reported productivity). Tables 10 & 11 present the values and standard deviations for the data points shown in Figures 3-5. Discussion of the other significant univariate effects in Tables 8 & 9 is beyond the scope of this paper; these will be discussed elsewhere.
Table 10. Means and standard deviations of satisfaction judgements at the various LPD and DLQ levels for the significant effects.
Multivariate Comparison Univariate Effect DLQB x LPDA ES LPD DLQ 1&2 3 1 2.92 ± 0.81 2.46 ± 0.78 2 2.94 ± 0.69 3.05 ± 0.65 LQ LPD DLQ 1&2 3 1 -0.06 ± 0.92 -0.24 ± 0.85 2 0.16 ± 0.83 0.16 ± 0.76 REF_LITE LPD DLQ 1&2 3 1 5.04 ± 1.51 4.70 ± 1.48 2 5.07 ± 1.32 5.20 ± 1.18 LPDB LPD 1 2 ES 3.00 ± 0.67 2.76 ± 0.82 LQ 0.21 ± 0.76 -0.17 ± 0.92 REF_LITE 5.29 ± 1.24 4.74 ± 1.48
Table 11. Means and standard deviations of work-related judgements at the various LPD and DLQ levels for the significant effects.
Multivariate Comparison Univariate Effect DLQB DLQ 1 2 WKQ8 1.57 ± 0.78 1.33 ± 0.64 WKQ9 4.13 ± 1.81 4.96 ± 1.68 4.0 Discussion 4.1 Energy simulations
Figure 2 shows that, as expected, as LPD decreases the energy for heating increases and the energy for cooling and fans decreases. In Edmonton, energy for heating increases at a greater rate than energy for cooling and fans decreases -- therefore decreasing LPD incurs an overall HVAC energy penalty, and the total delivered energy saving is less than the energy saving attributed to lighting in isolation. In Houston the result is reversed:
decreasing LPD provides an overall HVAC energy benefit, and the total delivered energy saving is greater than the energy saving attributed to lighting in isolation.
To quantify the overall energy effect, consider the case of reducing LPD from 25.8 W/m2
to 17.2 W/m2, at WWR = 0.50. For Edmonton, the delivered energy for lighting and
office equipment drops by 21.7 kWh/m2, whereas the total delivered energy for heating,
cooling and fans increases by 0.2 kWh/m2. In this case, the HVAC penalty is marginal,
and the overall delivered energy savings are only 1 % less than the savings due to lighting in isolation. For Houston, again, the delivered energy for lighting and office equipment drops by 21.7 kWh/m2, whereas the total delivered energy for heating, cooling and fans
decreases by 21 kWh/m2. In this case, the HVAC benefit is substantial, and the overall delivered energy savings are 97 % greater than the savings due to lighting in isolation. The actual energy cost benefit of reducing LPD is not as straightforward to assess. The amount of fuel required to deliver the energy will depend on the efficiencies of the heating and cooling plants, and the fans; these efficiencies will vary from building to building. The cost of the fuel will depend on the billing rates of the local utility company. Therefore, we cannot present general results for the cost benefits of LPD reduction, we can, however, looking at relative costs. The overall cost saving compared to the cost savings due to lighting in isolation is:
{(EL1-EL2)/ηl}•RCl + {(EC1-EC2)/ηc}•RCc + {EH1-EH2)/ηh}•RCh + {(EF1-EF2)/ηf}•RCf
{(ELl-EL2)/ηl}•RCl
where,
EL1, EC1, EH1, EF1 = annual energy consumption for lighting, cooling, heating, fans at
the higher LPD level
EL2, EC2, EH2, EF2 = annual energy consumption for lighting, cooling, heating, fans at
the lower LPD level
ηl, ηc, ηh, ηf = efficiency of lighting, cooling, heating, fans equipment
RCl, RCc, RCh, RCf = relative cost of fuel for lighting, cooling, heating, fans
Typical equipment efficiencies are: boiler (gas): 0.75; chiller (electricity): 3.40; lighting, fans (plug electricity): 1.00. Typical average ratio of electricity-to-gas price: 4.
Applying these assumptions to the energy savings for Edmonton described above, we find that the overall cost savings are 10 % greater than the cost savings for lighting in isolation. In Houston, the overall cost savings are 42 % greater than the cost savings for lighting in isolation. Therefore, in both extremes of climate overall energy cost savings are greater than lighting cost savings in isolation, though this was not the case for delivered energy savings. This is due to the relatively high cost of electricity in our example, such that cost savings for cooling and fans dominate cost savings for heating in the numerator of the above equation. Also note, however, that in the cooling-dominated climate of Houston, the ratio of overall savings to lighting savings in isolation is not as great in cost terms as it was in delivered energy terms. This is because the assumed chiller efficiency is high and
thus reduces the overall effect of cooling savings. However, it bears repeating that these cost savings calculations are examples only, and are not intended to be representative.
4.2 Responses from experiment participants
Figures 3 (a-c) show the LPDA x DLQB interaction, for environmental satisfaction (ES), and for two separate ratings of lighting quality (LQ, and REF_LITE). The graphs show that the effects are consistent across all three outcomes. At DLQ2 (parabolic louver fixtures) there is little difference in ratings between LPD conditions, whereas at DLQ1 (prismatic lens fixtures) ratings are worse at LPD3 than at LPD1&2 (taken together). The lower ratings for prismatic lens fixtures at LPD3 may be caused by greater glare from these fixtures, particularly at this LPD level, with its higher illuminance (Table 4). Glare control is a principal feature of parabolic louvers, which may explain the stability of ratings across the two LPD conditions at DLQ2, and the generally better rating for the parabolic louvers on the two measures of lighting quality..
Another possible explanation involves flicker rate. The LPD3 condition used magnetic ballasts (which oscillate at 120 Hz) and T12 lamps, whereas the LPD1&2 conditions used electronic ballasts (which oscillate at 20-60 kHz) and T8 lamps. Electronic ballasts can reduced the incidence of headache and eyestrain [Wilkins, Nimmo-Smith, Slater, & Bedocs, 1989] and can improve visual performance [Veitch & McColl, 1995]. It is possible that this type of effect influenced the lighting quality ratings in this experiment, although only for the prismatic lens fixtures. Future papers will address these effects in the visual performance and physical sensations data in an attempt to provide a deeper explanation of this phenomenon. The fact that only the prismatic lens fixtures are rated more poorly at LPD3 indicates that ballast type is not the only explanation of these data. Interestingly, the “traditional” lighting design of relatively high power prismatic lens fixtures obtained the lowest ratings on all three satisfaction measures. Improving lighting quality, in terms of the satisfaction of occupants, could be achieved by replacing prismatic lenses with parabolic louvers, or by replacing T12 lamps and magnetic ballasts with T8 lamps and electronic ballasts: The latter solution has the added benefit of saving energy (see Tables 5 & 6). Future papers will address the stability of this finding across other behavioural indicators of lighting quality, including objective measures of task
performance, physical sensations (e.g. eye strain, headache), and aesthetic judgements of the space.
Figures 4 (a-c) show the LPDB comparison, for the ES, LQ, and REF_LITE constructs. LPD1 differs from LPD2 by having a lower ambient lighting level with supplementary task lighting, at a reduced overall power requirement. On all three constructs, LPD1 is rated more highly than LPD2 (for all levels of DLQ). Again, the more energy-efficient lighting option is preferred by the participants.
Figures 5 (a-b) show the DLQB comparison, for the workday experiences ratings. Tasks were rated as being more difficult under prismatic lens fixtures than under parabolic louver
fixtures (for all levels of LPD). Participants also rated their own productivity as being higher under parabolic louvers (the mean ratings correspond to a difference in self-reported productivity of 8 %). Again, the obvious explanation is the reduced glare due to parabolic lenses; parabolic lens fixtures are recommended by the Illuminating Engineering Society of North America [ANSI/IESNA, 1993] for VDT workplaces.
For all the significant effects reported in this paper, the percentage of variance in
dependent variables explained by lighting design (R2 in Tables 8 & 9) is small: 1.4 to 3.5
%. However, all of the lighting designs were designed by experts, and the laboratory itself was newly designed and furnished. These aspects of the situation, in combination with the relatively short one-day exposure, are likely to dampen differences between the
experimental groups. In fact, many participants remarked that the laboratory was more attractive and better equipped than their usual work settings, leading us to suspect that larger differences would be obtained in more typical settings.
Nevertheless, small effects, if translated into real world behavioural effects, can have a large impact. For example, parabolic louvers were rated significantly better than prismatic lenses in terms of self-reported productivity. The difference in the means translates into an estimate of 8 % higher productivity under the parabolic louver fixtures. Further
interpretation of this result awaits analysis of the objective task performance data.
However, if the difference in self-reported productivity translated into a difference in real-world white-collar productivity, then adoption of parabolic louvers could have a
substantial economic benefit. Others have also reported significant differences of this magnitude in self-reported productivity through changes in office lighting systems [e.g., Hedge, Sims & Becker, 1995]. Further analyses of the luminous conditions created by different lighting systems should permit comparisons between the various experimental and field results to refine lighting recommendations.
The findings in this paper are important because they support current recommended practice for offices with VDTs (in that participants preferred parabolic louvers over prismatic lenses), and because they contradict some of the critics of energy-efficiency building codes: energy-efficient lighting designs can be preferred by occupants. Our study addressed a limited number of lighting designs, and one should be wary of concluding that all parabolic louver systems are better than all prismatic lens systems. Nevertheless, our results do suggest that it is not necessary to sacrifice lighting quality for energy efficiency, in fact, one can even improve on quality while saving energy. Thus, it may be possible to use the ancillary benefit of improved lighting quality to promote lighting energy savings. Only a subset of the behavioural data is presented in this paper, and further data analyses will be required to confirm the above findings. Future papers will feature these analyses including: the effect of lighting design on task performance, visual acuity, and aesthetic judgements of the workspace, and multiple regression relating the dependent measures to specific physical measures of the lit environment (e.g., luminance distribution).
5.0 Conclusions
Results of the computer simulations showed that as LPD decreases:
• the penalty of increased heating energy requirement is small compared to the savings in lighting energy, in delivered energy terms, even in the cold climate of Edmonton; • the additional benefit of reduced cooling and fan energy is substantial compared to the
savings in lighting energy, in delivered energy terms, being over 90 % of the lighting energy savings in the warm climate of Houston;
• the relatively high cost of electricity (the principal fuel for cooling) compared to gas (the principal fuel for heating) means that even in Edmonton, the cooling cost savings can be greater than the additional heating costs.
Results of the experiments in the mock-up office space showed that:
• participants preferred parabolic louver fixtures over prismatic lens fixtures, (possibly because of the lower glare induced by parabolic louvers). Participants’ preferences concurred with the lighting designers who prepared the lighting designs for our experiment, who considered designs incorporating parabolic louvers to be of higher quality than designs incorporating prismatic lenses;
• participants preferred the low energy lighting designs, even designs with LPDs below current energy code levels.
Therefore, our results support:
• recommendations of parabolic louvers over prismatic lenses for quality lighting in VDT workplaces (assuming the installation is appropriate for the location of VDTs). • adoption of energy-efficiency building codes, by demonstrating that energy-efficient
Acknowledgements
The authors owe a great debt of gratitude to the following people who played important roles in the project: Jana Svec (Experimenter); Ralston Jaekel, Michael Ouellette, Roger Marchand, Robert Magee, Dale Tiller, Dahlia Barakat (Technical assistance); Pierre-Paul Landry (Software development); Carol Scovil (Software testing and lab set-up); Martyn Timmings, Peter Boyce, Jim Wise, Jacqueline Vischer, Jean Wineman, Terry McGowan, Stuart Kaye, Michael Perry, Anthony Slater, Arnold Wilkins (Advice); Philip Gabriel, Chuck Wood, Martin Conboy (Lighting Design); Francis Rubinstein, Greg Ward (Renderings); Karen Shaver, Cathy Brown, Steffan Jones (Data management); Ardeshir Mahdavi, Paul Mathew, Steve Cornick, Rohini Brahme (Energy simulation).
The project was co-sponsored by: Canadian Electrical Association, Natural Resources Canada, Panel on Energy Research and Development, CANLYTE Inc., General Electric Co., Ledalite Architectural Products Inc., Litecontrol Corp., Luxo Lamp Ltd., Osram-Sylvania Inc., Peerless Lighting Ltd., and Philips Lighting.
References
ANSI/IESNA. (1993). American national standard practice for office lighting, RP-1-93. Illuminating Engineering Society of North America. New York, USA.
ASHRAE/IES (1989). Energy efficient design of new buildings except low-rise residential buildings, Standard 90.1. American Society of Heating, Refrigeration and Air
Conditioning Engineers. Atlanta, USA.
Benya, J. R., & Webster, J. C. (1977). Energy conservation and lighting - the facts and the follies. Lighting Design + Application, 7(9), pp. 21-27.
Begemann, S. H. A. (1983). Energy conservation and lighting trends. Proceedings of the Commission Internationale de l’Éclairage 20th Session, pp. B6/1-B6/6. Bureau
Centrale de la CIE, Paris, France..
Canadian Codes Centre (1995). National energy code for buildings (Public Review 1.0). National Research Council Canada. Ottawa, Canada.
Collins, B. L., Fisher, W. S., Gillette, G. L., & Marans, R. W. (1990). Second level post-occupancy evaluation analysis. Journal of the Illuminating Engineering Society, 19, pp. 21-44.
Ghiselli, E. E., Campbell, J. P., & Zedeck, S. (1981). Measurement theory for the behavioural sciences. San Francisco, USA: W. H. Freeman & Co.
Hedge, A., Sims Jr., W. R., & Becker, F. D. (1995). Effects of lensed-indirect and parabolic lighting on the satisfaction, visual health, and productivity of office workers. Ergonomics, 38 (2), pp. 260-280.
Kerlinger, F. N. (1986). Foundations of behavioral research (3rd ed.). New York: Holt, Rinehart, & Winston.
Newsham, G., Mahdavi, A., & Beausoleil-Morrison, I. (1995). Lightswitch: a stochastic model for predicting office lighting energy consumption. Proceedings of the Third European Conference of Energy-Efficient Lighting (Right Light Three), pp. 59-66, Newcastle upon Tyne, UK.
Newsham, G.R., & Tiller D.K. (1995). A field study of office thermal comfort using questionnaire software. IRC Internal Report No. 708. National Research Council, Ottawa, Canada.
Newsham, G. R., & Tiller, D. K. (1994). The energy consumption of desktop computers: measurement and savings potential. IEEE Transactions on Industry Applications, 30 (4), pp. 1065-1072.
Newsham, G.R., Veitch, J. A., & Scovil, C.Y. (1995). IRC Internal Report No. 700, 701, 702, 703. National Research Council, Ottawa, Canada.
Rea, M. S. (1988). Population data on near field visual acuity for use with the Vision and Lighting Diagnostic (VALiD) Kit. Report No. CR5544.3. National Research
Council, Ottawa, Canada
Rea, M. S. (Ed.). (1993). Lighting Handbook (8th edition): Illuminating Engineering Society of North America, New York, USA.
Rea, M. S., & Jeffrey, I. G. (1990). A new luminance and image analysis system for lighting and vision. Journal of the Illuminating Engineering Society , 19 (1), pp. 64-72.
Shaw, C.-Y., Barakat, S., Newsham, G., Veitch, J. A., & Bradley, J. (1995). NRC Indoor Environment Research Facility. Proceedings of the 16th Annual AIVC Annual Conference on Implementing the Results of Ventilation Research, Palm Springs, USA, Vol. 1, pp. 210-219. Air Infiltration and Ventilation Centre, Coventry, UK:
Stokols, D., & Scharf, F. (1990). Developing standardised tools for assessing employees' ratings of facility performance. In G. Davis & F. T. Ventre (Eds.), Performance of buildings and serviceability of facilities (STP 1019), pp. 55-79. American Society for Testing and Materials Philadelphia, USA.
Sundstrom, E., Town, J. P., Rice, R. W., Osborn, D. P., & Brill, M. (1994). Office noise, satisfaction, and performance. Environment and Behavior, 26, pp. 195-222.
Szydlowski, R. F., & Chvala, W. D. (1994). Energy consumption of personal computer workstations. PNL-9061: Pacific Northwest Laboratory, Richland, USA.
Tabachnick, B. G., & Fidell, L. S. (1983). Using multivariate statistics. Harper and Row, New York.
Veitch, J. A., & McColl, S. L. (1995). On the modulation of fluorescent light: flicker rate and spectral distribution effects on visual performance and visual comfort. Lighting Research and Technology, 27, pp. 243-256.
Veitch, J. A., & Newsham, G. R. (1996). Experts’ quantitative and qualitative
assessments of lighting quality. Conference of the Illuminating Engineering Society of North America, Cleveland, USA.
Veitch, J. A., & Newsham, G. R. (in press). Determinants of lighting quality I: State of the science. Journal of the Illuminating Engineering Society, in press.
Wilkins, A. J., Nimmo-Smith, I., Slater, A., & Bedocs, L. (1989). Fluorescent lighting, headaches and eye-strain. Lighting Research and Technology, 21, pp. 11-18.
Winkelmann, F. C., Birdsall, B. E., Buhl, W. F., Ellington, K., Erden, A. E., Hirsch, J. J., & Gates, S. (1993). DOE-2 Supplement Version 1.1E. Lawrence Berkeley
Appendix
Here we further describe the data reduction process whereby we created simpler and more interpretable constructs (or composite ratings), which we used as the dependent variables in our statistical analyses. These procedures are described in such texts as Kerlinger [1986] and Tabachnick and Fidell [1983]. We evaluated the internal consistency of these constructs using Cronbach’s alpha [Ghiselli, Campbell, & Zedeck, 1981].
The Environmental Satisfaction questionnaire contained four items [Sundstrom et al., 1994]. Our overall rating of environmental satisfaction (ES) was the mean of the four environmental satisfaction ratings for each participant (Cronbach’s alpha = 0.83).
Similarly, our overall rating of lighting quality (LQ) was the mean of all four items on the Lighting Quality questionnaire [Collins et al., 1990], with the additional step that the ratings were standardised prior to averaging because some were made on five point scales and others on four point scales (Cronbach’s alpha = 0.89).
The Environmental Features questionnaire comprised 23 ratings of various environmental features [Stokols & Scharf, 1990]. We conducted a principal components analysis (PCA) followed by a varimax rotation, which reduced the original 23 rating scales into five interpretable components. The criterion for judging which ratings loaded on each
component was a factor loading of 0.5. The five components were: Noise and distraction (REF_NOIS, Cronbach’s Alpha = 0.83); Ventilation (REF_VENT, Cronbach’s Alpha = 0.87); Furniture (REF_FURN, Cronbach’s Alpha = 0.76); Washroom (REF_WASH, Cronbach’s Alpha = 0.59); Lighting (REF_LITE, Cronbach’s Alpha = 0.90).
All of the above constructs were considered good to very good in their internal
consistency (Cronbach’s alpha > 0.7 or 0.8), except for one (ratings of the washrooms), which did not involved the laboratory space itself.
The Workday Experiences questionnaire comprised eight ratings of the difficulty of the day’s tasks, and one question in which the participant estimated the percentage effect the environment had on his or her productivity. PCA for the 8 ratings of task difficulty did not result in interpretable components. We therefore treated the ratings, along with the productivity effect estimate, as nine separate dependent variables (WKQ1 to WKQ9).
Figures 0.00 0.10 0.20 0.30 0.40 0.50 0.60 0.70 0.80 0.90 1.00 4 8 1 2 1 6 2 0 2 4 Time, hours U s e Fr a c ti on weekday weekend 0.00 0.10 0.20 0.30 0.40 0.50 0.60 0.70 0.80 0.90 1.00 4 8 1 2 1 6 2 0 Time, hours U s e Fr a c ti on weekday weekend
Figure 1. Use profiles for lighting (a) and office equipment (b) used in the energy simulations.
Edmonton, AB
0 20 40 60 80 100 120 140 160 180 200 8.6 17.2 25.8 LPD, W/sq.m A nnua l E ne rgy , k W h/ s q. m cooling light & off eqpheating fans
Houston, TX
0 20 40 60 80 100 120 140 160 180 200 8.6 17.2 25.8 LPD, W/sq.m A nnua l E ne rgy , k W h/ s q. m cooling heating light & off eqpfans
Figure 2. Delivered energy consumption, by end use, vs. lighting power density, for
0 1 2 3 4 1&2 3 LPD E S 1 2 DLQ -1 0 1 1&2 3 LPD LQ 1 2 DLQ 1 2 3 4 5 6 7 1&2 3 LPD R E F_ LI T E 1 2 DLQ
Figure 3. LPDA x DLQB interaction: significant univariate effects for constructs of environmental satisfaction (a) and lighting quality (b) & (c).
0 1 2 3 4 1 2 LPD E S -1 0 1 1 2 LPD LQ 1 2 3 4 5 6 7 1 2 LPD R E F_ LI T E
Figure 4. LPDB comparison: significant univariate effects for constructs of environmental satisfaction(a) and lighting quality (b) & (c).
(a) (b) (c)
0 1 2 3 4 1 2 DLQ W K Q 8 ( ov e ra ll t a s k di ff ic ul ty ) 0 1 2 3 4 5 6 7 8 1 2 DLQ W K Q 9 ( s e lf -r e por t pr oduc ti v it y )
Figure 5. DLQB comparison: significant univariate effects for ratings of overall task difficulty (a), and self reported productivity (b).