BUS SUPERVISION DEPLOYMENT STRATEGIES FOR
IMPROVED BUS SERVICE RELIABILITY
by
Christopher Allan Pangilinan Bachelor of Science in Civil Engineering
Portland State University, 2004
Submitted to the Department of Civil and Environmental Engineering in partial fulfillment of the requirements for the degree of
MASTER OF SCIENCE IN TRANSPORTATION at the
Massachusetts Institute of Technology September, 2006
Copyright C Massachusetts Institute of Technology 2006. All rights reserved.
Signature of Author
6epartment of Civil and Environmental Engineering June 9, 2006 Certified by Accepted by MASSACHUSETTS INSTIITUTE OF TECHNOLO•.
DEC
0
5 2006
LIBRARIES
r
Professor Nigel H. M. Wilson Professor of Civil and nvironmental Engineering1A00 fl7esisShpervisor
- ,-. v 'Andrev J. Whittle Chairman, Departmental Conmnittee on Graduate Students
ARCHIVES
L _ · I
· __ __
Bus Supervision Deployment Strategies for Improved Bus
Service Reliability
by
Christopher Allan Pangilinan
Submitted to the Department of Civil and Environmental Engineering on August 11, 2006 in partial fulfillment of the requirements for the degree of
Master of Science in Transportation
ABSTRACT
Bus service reliability has always been a top concern for transit agencies and their customers. Unfortunately, there are several factors detrimental to reliable bus service. Outside influences such as weather, traffic, and road construction can wreak havoc on even the best laid plans. Internally, poor planning, insufficient maintenance, and differing operator abilities can work to undermine bus service reliability.
To help counteract these problems, transit agencies typically deploy a team of supervisors who are responsible for monitoring, maintaining, and restoring reliable service. To do their job effectively, supervisors require high levels of operational information and a reliable communications system. These resources, however, can vary in their availability and may not be at ideal levels. This research proposes a framework to aid in the planning of bus supervision deployment given different levels of information, communications, and personnel.
The primary focus of the framework is the deployment of post, mobile, and control center supervisors given an agency's current level of information and communication resources. The application of the framework begins with a service reliability and supervision
resource assessment. Based on these assessments, a system level personnel deployment strategy is developed and then evaluated.
Two case studies - the Chicago Transit Authority (CTA) Route 20 and the Massachusetts Bay Transportation Authority (MBTA) Silver Line - are presented as applications of the proposed framework. Findings suggest that personnel deployment at both agencies is suboptimal: both agencies deploy too many post supervisors given current resource levels, and for the CTA, too few mobile supervisors. Findings also suggest that putting increased information and communication resources in place should lead agencies to have post supervisors only at the busiest most critical locations, mobile supervisors for incident response and reallocate many field-based supervisors to the control center for headway and schedule management.
Thesis Supervisor: Nigel H.M. Wilson, Ph.D.
Acknowledgments
To my advisors Nigel Wilson and John Attanucci. Thank you for your unwavering confidence in my writing and my research abilities, and for pushing me to surpass my own expectations time and time again. You helped to create an MIT experience that was exceptionally rewarding and equally challenging - an unforgettable experience (in a good way!) that I will take with me throughout my career.
To Fred Salvucci, Mikel Murga, and Ken Kruckemeyer who could always be counted on to provide great conversation and advice on any transportation topic.
To Ginny Siggia, thank you for all of your help in staying organized, and for all those goodies that mysteriously appeared in 1-235.
To the Chicago Transit Authority for sponsoring my graduate studies and providing the basis for this research. To Angela Moore for allowing me to have an incredible
experience as a summer intern at the CTA. Getting up at 4 in the morning to meet the great Eugene Thurmond (to whom I also owe gratitude for teaching me the finer points of bus supervision) and witness a morning pull-out is an experience that cannot be
duplicated anywhere else. To Angela, Jason Lee, and Wai-Sinn Chan for letting me control Route 20 for one whole week. Incredible opportunity. To CTA President Frank Kruesi, and Vice Presidents Michael Schiffer and William Mooney for supporting my work on bus service reliability and believing that we can make bus service better. The
City of Chicago is in good hands.
To David Barker and David Carney at the Massachusetts Bay Transportation Authority for providing data and working with me on the Washington Street Silver Line. Thank you as well for allowing me to shadow the supervisors and dispatchers.
To my professor at Portland State University, Robert Bertini. Your encouragement and push to reach for the sky is one of the main reasons I was able to go to MIT. Thank you
for all of your support, and for your dedication to your students.
To my friends who made the past two years one of the most memorable times in my life. Lou Malnati's and the Occidental with Drew and Mike. Madison Square Garden and the Rose Garden with Owen. Super Mario Kart with Tara. Maverick Airlines with Edgar. Anna's runs with Hanowski. Concerts, and coffee with Mary. Pizza and "green stuff' with Elaine. And of course, countless adventures with Jeff and Danielle.
Last and certainly not least, thank you to my friends and family back home in Portland. To my family - Mom, Dad, and Vanessa - who always told me I could over come any obstacle and achieve my dreams. To my Dad, who has been driving buses for TriMet for 17 years and counting, for offering practical and sound advice from the operator view on all of this research.
Table of Contents
ABSTRACT 3 ACKNOWLEDGMENTS 5 TABLE OF CONTENTS 6 LIST OF TABLES 9 LIST OF FIGURES 10 1 INTRODUCTION 11 1.1 Motivation 111.1.1 Prior Research Knowledge 12 1.1.2 The Supervision Challenge 12
1.1.3 Role of Technology 13
1.2 Objectives of the Research 13
1.3 Methodology and Approach 14
1.4 Thesis Organization 15
2 BACKGROUND 17
2.1 Literature Review 17
2.1.1 Transit Service Reliability 17 2.1.2 Analysis of Transit Service Reliability 20
2.1.3 Operations Control 22
2.1.4 Bus Supervision 24
2.1.5 Communications and Information for Bus Supervision 28 2.1.6 Pre-planning for Service Disruptions 28 2.1.7 Simulation for the Evaluation of Control Strategies 29 2.1.8 Operations Control and Bus Supervision: Tri-Met Case Study 30 2.1.9 Summary of Literature Review 31
2.2 Bus Service Reliability 32
2.2.1 Planning for Service Reliability 34 2.2.2 Service Reliability at the Garage Level 37 2.2.3 Service reliability on the street 39
2.3 Bus Service Management 42
2.3.1 Operations Control Toolbox 43 2.3.2 Resource Needs and Availability 50
3 FRAMEWORK FOR ANALYZING BUS SUPERVISION 57
3.1 Framework Introduction 57
3.2 Assessment 58
3.2.1 Supervision Resource Assessment 58 3.2.2 Service Reliability Assessment 59
3.3 Development of Strategies 63
3.3.1 Distribution of Responsibilities 64 3.3.2 Distribution of Personnel 67
3.4 Evaluation of Strategies 70
3.4.1 System Evaluation 71
3.4.2 Route Level Service Reliability Metrics 72
3.4.3 Modeling 73
3.4.4 Experimentation 74
4 CHICAGO TRANSIT AUTHORITY CASE STUDY 75
4.1 Resource Assessment 75
4.1.1 General Overview 75
4.1.2 Control Center Operations 77
4.1.3 Mobile Supervisors 78
4.1.4 Post Supervisors 79
4.1.5 Information Resources 81
4.1.6 Communication Resource 82
4.2 Strategy Development - Current Resource Level 83
4.2.1 Control Center 83
4.2.2 Mobile Supervisors 84
4.2.3 Post Supervisors 86
4.3 Strategy Development - Future Resource Level 88
4.3.1 Control Center 88
4.3.2 Field Supervisors 90
4.3.3 Application and Evaluation of Future Resource Level 91 4.4 Route Level Reliability Assessment 92 4.4.1 Description of Route 20 Madison 92 4.4.2 Route 20 Reliability Analysis 95 4.5 Development of a Supervision Strategy 105 4.5.1 Goals of the Supervision Strategy 105 4.5.2 Responsibilities of the Control Center Dispatcher 107 4.5.3 Austin Supervisor Responsibilities 107 4.5.4 Pulaski Supervisor Responsibilities 109 4.5.5 Kedzie Supervisor Responsibilities 110 4.5.6 Ashland Supervisor Responsibilities 111 4.5.7 Summary and Expectations of Proposed Supervision Strategy 111 4.6 Evaluation - Model Results 112
4.6.2 Model Results 114
4.6.3 Modeling Summary 117
4.7 Evaluation - Experiment Results 117
4.8 Case Study Summary 121
4.8.1 Experiment Summary 122
4.8.2 Supervision Deployment 123
5 MBTA CASE STUDY 125
5.1 Reliability Assessment 125
5.1.1 Description of the Silver Line 125
5.1.2 Data Analysis 127
5.1.3 Running Time Analysis 128
5.1.4 Headway Adherence 129
5.2 Resource Assessment 130
5.3 Development of the Supervision Strategy 131 5.3.1 Proposed Supervision Strategy 131 5.4 Evaluation - Model Results 133
5.4.1 Data 133
5.4.2 Results 134
5.5 Summary of Case Study 136
6 CONCLUSIONS AND KEY FINDINGS 137
6.1 Framework Assessment 137
6.2 Key Findings 138
6.2.1 Resource State and Personnel Deployment 139
6.2.2 CTA Recommendations 140
6.2.3 Terminal Departures 141
6.2.4 Headway Degradation 142
6.2.5 Power of Technology 142
6.2.6 Move towards Automation 143
6.3 Future Research 143
List of Tables
Table 2-1 MBTA Service Standards for Minimum Frequency...35
Table 2-2 MBTA Service Standards for Service Reliability ... ... 35
Table 2-3 CTA Service Standards for Frequency ... 36
Table 2-4 Causes of service unreliability ... ... 40
Table 2-5 Example of moving up a terminal ... 46
Table 2-6 Service restoration resource needs ... 49
Table 3-1 Suggested Resource Levels ... ... 58
Table 3-2 Example of system-wide unreliability trends and solutions ... 61
Table 3-3 Effects of resource changes on incident detection and response ... ...65
Table 4-1 Breakdown of duties for one mobile supervisor PM peak shift - July 2005 ... 79
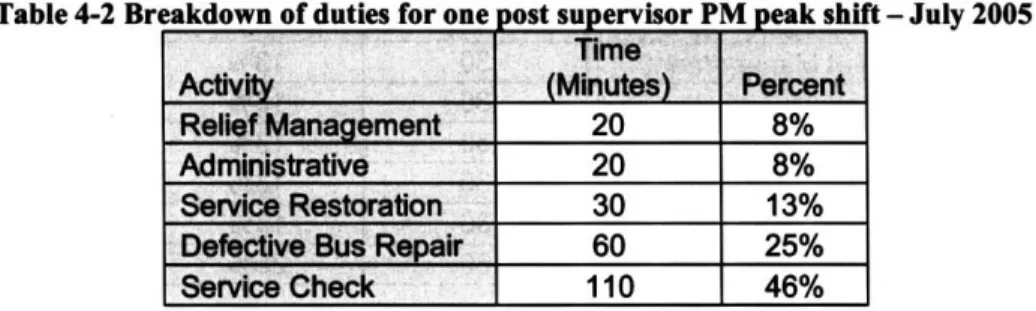
Table 4-2 Breakdown of duties for one post supervisor PM peak shift - July 2005 ... 80
Table 4-3 K ey tim epoint inform ation ... ... 93
Table 4-4 Route 20 trips included in analysis ... 95
Table 4-5 Transit level of service by headway regularity ... ... 96
Table 4-6 Route 20 Supervision resource availability...106
Table 4-7 Excess wait time as a percentage of scheduled wait time ... 115
Table 4-8 Effect of reliability on resource assignment... 116
Table 4-9 Excess wait time as a percentage of scheduled wait time ... 119
Table 5-1 Silver Line Schedule ... ... 127
Table 5-2 Inbound Running Time Summary... ... 128
Table 5-3 Outbound Running Time Summary...128
Table 5-4 Temple PM peak departure AVL data for 12/01/05 ... ... 134
'Table 5-5 Forecast headway ratio with proposed supervision strategy ... ...135
List of Figures
Figure 2-1 Ideal service reliability hierarchy and feedback loop... ... 34
Figure 2-2 Use of historical inform ation ... 51
Figure 4-1 CTA service management regions and supervision locations ... 76
Figure 4-2 Mobile supervisor incident response and service restoration ... .... 85
Figure 4-3 Real-tim e A V L display ... ... 89
Figure 4-4 Route 20 m ap (Schwarcz, 2004)... ... 93
Figure 4-5 Route 20 dem and profile ... ... 94
Figure 4-6 Austin schedule adherence ... ... 98
Figure 4-7 Headway variation at Austin, , Pulaski, Ashland, and Halsted ... .... 99
Figure 4-8 Coefficient of variation of headways and level of service at each timepoint ... 100
Figure 4-9 Excess passenger waiting times at each timepoint ... ... ... 101
Figure 4-10 Headway ratio probability at Pulaski by initial headway ratio at Austin... 102
Figure 4-11 Headway ratio probability at Ashland by initial headway ratio at Austin ... 103
Figure 4-12 Mean observed timepoint travel times and standard deviation ... 104
Figure 4-13 Decision flow chart for Austin... 109
Figure 4-14 Location of Chicago Avenue Garage and Pulaski Supervisor...10
Figure 4-15 Forecast headway variation with the proposed supervision strategy ... 1...14
Figure 4-16 Forecast excess passenger wait time for the proposed supervision strategy ... 1...15
Figure 4-17 Headway variation before and during the experiment ... 18
Figure 4-18 Excess passenger wait time before and during the experiment ... 119
Figure 4-19 Distribution of headways departing Austin ... ... 120
Figure 4-20 Distribution of headways at Pulaski (3" timepoint from Austin)... 121
Figure 4-21 Distribution of headways at Kedzie (4th timepoint from Austin) ... 121
Figure 5-1 The W ashington Street Silver Line ... ... 126
Figure 5-2 Silver Line Passenger Demand Distribution ... 127
1
Introduction
This research reviews current bus service supervision practices and develops a framework for transit agencies to aid in bus supervision deployment planning. The framework suggests how transit agencies should deploy their bus supervisors in order to maximize bus service reliability. Taken into account are the number of supervisors available, the communications structure in place, and the amount of information available to the supervisors.
1.1
Motivation
For transit agencies that try and provide quality customer service, bus service reliability is one of their top priorities. Not only do customers want safe, fast, and affordable transit, they also want to be able to count on it time and time again. Wait times should be predictable, and travel times should be consistent. Any deviations and customers will
expect to be informed.
Unfortunately, there are several factors detrimental to reliable bus service. Outside influences such as weather, traffic, and road construction can wreak havoc on even the best laid plans. Internally, poor planning, insufficient maintenance, and differing
operator abilities can work to undermine bus service reliability.
To counteract these factors, transit agencies typically deploy field supervisors in conjunction with establishing a control center as part of a bus service management program. The supervisors and the control center are then empowered to make real-time operating decisions regarding the buses on the street. Field supervisors can assist operators with defective equipment for example, or provide them instruction in order to restore "normal" bus service.
1.1.1
Prior Research Knowledge
The topic of bus supervision and bus service reliability has been studied extensively prior to this thesis. Much of this research has been conducted in the areas of transit service reliability, operations control, and bus supervision. This research has shown that there are many causes of unreliability, both external and internal to the transit agency, and that service unreliability plays a large part in the transit user's experience. Several operations control methods such as holding, and expressing vehicles have been explored, and their theoretical benefits to reliability are well documented. Regarding bus supervision, studies have been completed suggesting the benefits of centralized control and technology in improving the effectiveness of supervision on service reliability.
Until now, most of the prior research has been theoretical both in approach and in findings. Operations control strategies have been modeled to show that selectively holding buses to either schedule or headway can produce net benefits for passengers by lowering their expected waiting times. Bus supervision findings have claimed that centralized operations control combined with advanced information and communications technologies will improve bus service reliability. This thesis will attempt to go a step further by applying these operations control and supervision strategies to two bus routes at the Chicago Transit Authority (CTA) and the Massachusetts Bay Transportation
Authority (MBTA) in order to find out how effective they can be, and to uncover both the potential and the limitations of bus supervision.
1.1.2 The Supervision Challenge
In the past, a lack of technology has hampered the efforts of bus supervisors in
maintaining reliable bus service. Supervisors in the field and in the control center have typically not had access to real-time information on their bus network. Information such as bus locations, passenger loads, and incident locations would have to be ascertained manually, and this would lead to slow and ineffective responses to service reliability
problems. Communication constraints further inhibited supervisory effectiveness by slowing the information sharing process and restricting available responses.
In addition to a lack of technology, supervisors are often given a myriad of tasks to complete. While these tasks, such as conducting onsite repairs, managing crew changes (reliefs), or providing customer service do contribute to restoring service reliability, they detract from the supervisor's ability to maintain reliability through schedule adjustments and utilizing other operations control strategies.
1.1.3
Role of Technology
Recently, emerging technologies have been at the forefront of transit research. Automatic data collection in the form of vehicle location information (AVL) and passenger counting information (APC) has given researchers the ability to examine vehicle movement behavior and passenger travel behavior. In addition, new real-time
AVL information systems and digital communications are giving bus supervisors the resources necessary to detect service reliability problems earlier and tackle them more effectively.
In this thesis, the emerging technologies serve dual roles in the evaluation of bus supervision. Information and communications technologies are used to maximize the potential of bus supervisors while automatically collected vehicle location and passenger information is used to evaluate the benefits of bus supervision on service reliability.
1.2 Objectives of the Research
Utilizing the emerging transit technologies, and building from the prior research, this research will propose a framework to aid in the planning of bus supervision for improved
bus service reliability. The framework will then be applied to the CTA Route 20 and the MBTA Silver Line.
By applying the framework, this thesis will examine the role of field supervisors and the control center with regard to service reliability. The tasks assigned to each party, the decision making process, and the personnel assignments will be explored. In addition, the question of personnel requirements will be addressed given a certain level of information and communications technology.
1.3 Methodology and Approach
In order to carefully examine bus service supervision, the researcher must have first hand knowledge and experience of practice. Towards this end, field observations and
discussions with key personnel at the CTA, the MBTA, and TriMet (Portland, OR) were conducted. This led to a working knowledge of the daily operations of bus service supervision at each of these agencies.
The state of the practice at the CTA and MBTA is analyzed to find out how bus
supervisors are deployed and why. The drawbacks and potential benefits of each strategy are outlined and lessons are drawn from each one. From these lessons, a framework is developed in order to improve deployment strategies and ultimately, bus service reliability.
This framework is then applied to two case studies involving the CTA's Route 20 and to the MBTA's Silver Line. These routes were chosen due to their technological
innovations and research potential. At the CTA, a project is currently being piloted that will provide real-time AVL information at the control center, in effect giving a dispatcher real-time knowledge of bus locations and schedule adherence status for Route 20. At the MBTA, the Washington Street Silver Line bus route is already equipped with this
20 and the Silver Line, the framework application will be able to evaluate the full potential of bus supervision given these optimal operating conditions.
Applying the framework is a five step process. First, field observations and automated data are collected on each route to learn about ridership characteristics, current levels of service reliability, and available resources. This information is then used to develop a supervision deployment strategy for the route in question. Once the strategy has been formulated, a model is used to predict the potential benefits and costs of the strategy to the agency and its customers. Finally, if the net benefits are positive, the supervision
strategy is deployed to verify the model results or for the long run. Data is collected and analyzed once again to measure the actual benefits and costs. As part of this thesis research a one-week experiment of a different supervision strategy was conducted on
CTA Route 20).
From the extensive field work and case study applications, conclusions will be drawn regarding the effectiveness of the proposed bus supervision strategies. General
conclusions will also be drawn with regard to how differing resource levels govern the way a transit agency deploys its bus service supervision team in order to best improve bus service reliability.
1.4 Thesis Organization
The next chapter will set the stage for the rest of the thesis by introducing the general concepts underlying bus service reliability. This includes defining bus service
management, supervision, operations, and planning as they relate to service reliability. The concept of service reliability itself will also be laid out so the reader can better understand the goals of this research. A literature review is presented to put this thesis's research in the context of prior findings. This includes research into transit service reliability, operations control, bus supervision, and a documented case study in supervision at TriMet.
The proposed bus supervision evaluation framework is presented in chapter 3. The purpose of the framework is explained, and the steps in applying the framework are reviewed in detail. In addition, the expected outcomes of the framework application are described at the end of the chapter.
The fourth chapter presents the CTA case study. An overview of the current supervision situation is presented first. Following that, a description of Route 20 will be given, and then a summary of the field work and data analysis as part of the problem identification process. The proposed supervision strategy to counteract the identified problems will then be presented along with the simulation results. Finally, a field experiment involving the CTA's own Real-Time Computer Aided Dispatch and Automatic Vehicle Location pilot project will be described. This pilot will operate as the CTA's first foray into real time AVL control for its bus system and allows the research to test the capabilities of the pilot in aiding bus supervisors during the experiment.
The fifth chapter presents the MBTA case study and how the research approach has been applied to the Washington Street Silver Line. A quick overview of the Silver Line will first be presented, followed by a summary of the field work and data analysis as part of the problem identification process. The proposed supervision strategy to counteract the identified problems will then be presented along with the simulation results.
Key findings and conclusions from the case studies and state of the practice reviews will be summarized in the sixth chapter. This leads to recommendations for the CTA
regarding their supervision strategies, and deployment in the immediate as well as the not too distant future. Finally, a summary of conclusions will be presented. Newly raised questions and those left unanswered will be posed pointing the way to future research in this area.
2 Background
This chapter will first provide a literature review of the prior research concerning
operations control and bus supervision. This will serve to put this research in the context of what has already been examined and how the prior research sets up the research presented here.
This chapter will then define the concept of bus service reliability as it pertains to the research. Issues affecting reliability will be discussed and explored to give the reader a sense of the current situation facing bus operations. Bus service management, the operations division that deals specifically with maintaining and improving service reliability, will then be described in detail.
2.1 Literature Review
Many studies have been conducted in the field of transit service reliability, operations control strategies, and bus supervision. Presented in this literature review will be the key findings of the prior research and how this research will build upon them.
2.1.1
Transit Service Reliability
Abkowitz et al. (1978) conducted a comprehensive study of transit service reliability, focused on the impacts of reliability on transit agencies and their customers. It identified possible causes of unreliability, methods to measure reliability, and strategies that could be employed to improve reliability.
Impacts of Transit Reliability
In reviewing prior studies concerning the relationship between travel behavior and transit service reliability, the authors note how improvements in reliability can have positive effects on the utility of transit relative to other transportation modes. Reducing travel time and especially wait time variability through reliability improvements can increase the frequency of transit use and can also attract new riders.
From the transit agency perspective, Abkowitz et al. (1978) discusses how reliability improvements can reduce capital and operating costs. This is achieved by reducing travel time variability which in turn can reduce the need for excess resources assigned to a route. Revenue increases are also possible as a result of reliability improvements leading to increases in ridership.
Causes of Unreliability
According to the study, unreliability factors can be classified as either environmental or inherent. Later in this chapter Table 2-4 in section 2.2.3 summarizes most of these factors and then goes on to describe them in detail. In general, traffic and demand variability are noted to be significant causes of unreliability. Traffic signals and traffic flow patterns contribute to travel time variability while variations in demand can cause variable dwell times as well as total travel times.
The study goes on to state that initial deviations from the timetable, either at the terminal or mid-route will propagate downstream. These propagations tend to create unbalanced passenger loads and contribute to further unreliability downstream.
Measuring Unreliability
Abkowitz et al. (1978) reviewed prior research into measuring transit service unreliability and described several weaknesses with these measures. The authors found that many of
the measures did not capture unreliability from the perspective of the passenger. Measures were tied to schedule adherence so ineffective schedules could cause biased measures. Finally, data collection methods failed to account for time-of-day and seasonal variations in demand and in the operating environment.
After reviewing prior studies, the authors developed a set of measures that would address these weaknesses. These measures could help identify reliability problems and assist in selecting strategies that could improve reliability.
The measures suggested by the authors involve finding the mean, and coefficient of variation of the following service attributes:
* Travel time distribution * Schedule adherence * Headway distribution
Seasonality and time of day variations should be controlled for when making comparisons.
Improving reliability
Several methods are outlined in the study for improving service reliability. The methods were classified as priority, control, or operational strategies.
Priority strategies generally involve infrastructure changes such as a dedicated travel lane or signal priority. The authors cite prior studies that indicate that priority strategies can reduce mean travel times by mitigating the environmental influences on reliability.
Control strategies are employed in real-time to improve reliability. These strategies, which will be described in detail in section 2.3.1, typically involve holding or expressing buses in one fashion or another in order to restore service reliability. One of the major
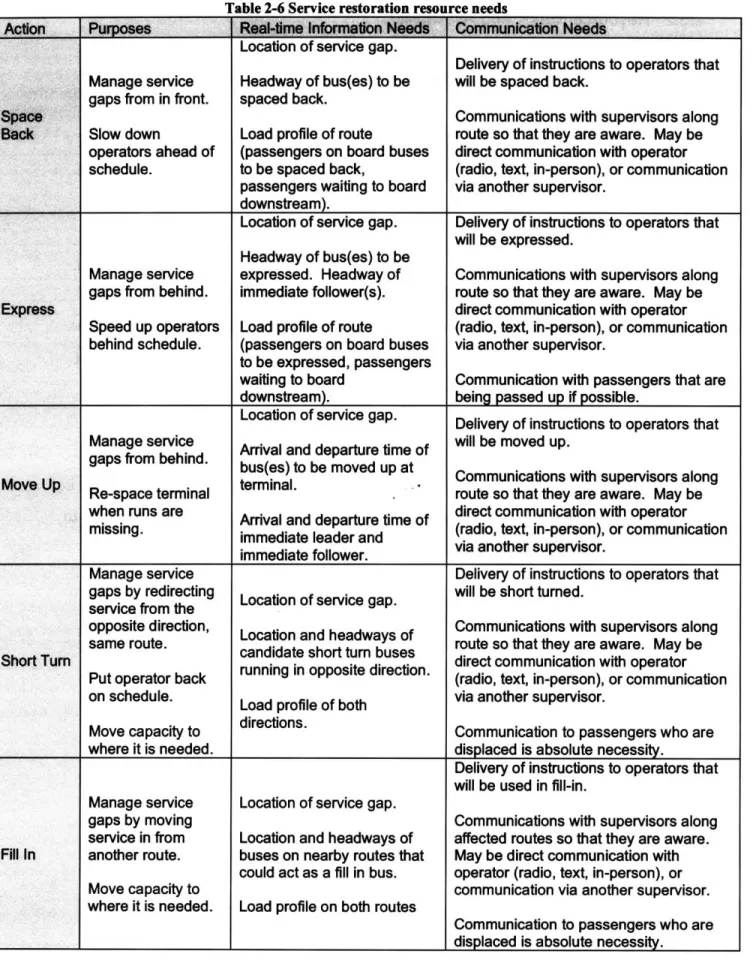
components in utilizing control strategies is the need to monitor service. Service monitoring, including information, communication, and personnel requirements, is described in section 2.3.2
In addition to corrective control strategies, the study describes how operational strategies can improve reliability through prevention. Schedule improvements can reduce the risk of service unreliability by giving operators sufficient time to complete trips and begin their following trips on time. Likewise, improvements in fleet and labor management can reduce the risk of unreliability by lessening the chance of a run being held-in or a bus breaking down mid-trip.
Future research suggestions
The study by Abkowitz et al. (1978) suggests many points for future research. Relevant to this thesis are studies testing the suggested control strategies and evaluating their effects. This thesis will cover both of these areas in detail.
2.1.2 Analysis of Transit Service Reliability
With the advent of automatic data collection, the methods to analyze transit service reliability have become much more powerful. Large databases that archive automatic vehicle location (AVL) and automatic passenger counter (APC) data now allow research to tap into a wealth of data in analyzing transit service reliability. However, even with
large amounts of data available, a process to utilize this data must be clearly defined to be able to conduct a meaningful analysis.
Cham (2006) developed a framework detailing the application of automatic data collection to the analysis of service reliability. This framework first outlines relevant metrics to measure the state of unreliability. Second, the framework uses these metrics to identify the causes of unreliability, and then finally, proposes possible corrections to improve service reliability. Cham applies this framework to the MBTA's Silver Line.
Cham, after citing Abkowitz et al. (1978), identified three major measurements that can be used to capture service reliability conditions:
* Schedule adherence
* Headway adherence (regularity) * Running time distribution
Due to the automatic data collection available on the MBTA Silver Line, Cham was able to apply these measures over a 3 week period in September, 2004. The main finding was that the Silver Line suffered large headway variations leading to bus bunching and headway gaps in turn leading to excess waiting time for passengers. Variable running times throughout the day, especially along portions of the route where buses did not have preferential lanes, were shown to be partially responsible for uneven headways. The main cause of unreliability however was found to be at the terminals where departure headways were quite irregular. Cham's analysis demonstrated a clear correlation between terminal departures and downstream performance. Those trips that left the
terminal with the scheduled headway had a much greater chance of keeping that headway downstream than trips that left either bunched or gapped.
With her analysis showing irregular terminal departures and running time variability as the main causes of unreliability, Cham concludes that a combination of improved
terminal supervision, conditional signal priority, and a higher level of priority on the right of way would help to improve service reliability on the Silver Line.
By using the large amount of automatically collected data available, Cham was able to develop a framework that measured service unreliability, identified probable causes of unreliability, and suggested changes that could improve reliability. This thesis will build on Cham's work by extending this framework and applying it to the CTA's Route 20, and then examining the effectiveness of supervision in improving reliability for both Route 20 and the Silver Line.
2.1.3 Operations Control
Much research has been conducted on the topic of operations control strategies. As described in the previous section, operations control strategies are a set of corrective actions that are utilized in real time in order to restore and maintain service reliability.
Holding
Turnquist (1981) examines vehicle holding strategies that can improve transit service reliability. In this study, schedule-based holding for low frequency routes and headway-based holding for high frequency routes are treated as two different cases. Turnquist notes that on low frequency routes, schedule adherence is very important because most passengers attempt to arrive at their bus stops shortly before the scheduled arrival of the bus. On high frequency routes, passengers generally arrive randomly without regard to the schedule and therefore headway regularity is most important.
With regard to headway-based holding, Turnquist cites Welding (1957) for the following widely used average waiting time equation:
E(W) = h [I + cov2(h) (2.1)
2
where E(W) is the expected wait time, h is the expected headway, and cov(h) is the coefficient of variation of headway. By regulating headways through holding, the variability of headways can be reduced leading to lower average waiting times.
Two types of headway-based holding are identified by Turnquist (1981): Single-headway holding and "Prefol" holding. The single-headway strategy requires only the knowledge
of the headway of the vehicle to be held. If the headway is short, the vehicle is held to a minimum headway at the control point. Turnquist notes that this strategy is most
effective when headways are strongly correlated. In other words, single-headway holding works best when bus bunching exists with short headways followed by large headways. By holding the second bus, the bunch will be broken up and the following long headway will be reduced, thus reducing headway variability more than if the bus bunch consisted of three (or more) buses.
The Prefol strategy is thus named because it holds buses to split headway differences between the preceding headway and the following headway for each vehicle. Note that this strategy requires information on the following headway of a bus, information that traditionally has not been readily available. Turnquist (1981) notes that the Prefol strategy is more effective in regulating headways than the single-headway strategy but loses its advantage as headways become more strongly correlated.
Control Point Location
In another study, Turnquist and Blume (1980) discuss the importance of the control point location for headway-based holding. They also discuss the implications of holding when headways are perfectly correlated and when they are statistically independent of each other.
Turnquist and Blume state that "it is wise to control a route at a point where relatively few people are on the vehicle and relatively many are waiting to board at subsequent
stops" in order to maximize total benefits. This means that for most routes, the control point should be as close to the departure terminal as possible. Headway variation will be
lowest just past the control point but will tend to increase further downstream.
With regard to headway correlation, Turnquist and Blume show that holding to a minimum headway is more beneficial if short headways are always followed by long
headways, than if headways are independent of each other. When headways are
independent, this single-headway holding strategy becomes less effective because a short headway does not necessarily imply a large following headway. This conclusion has
strong implications for this research. Now that transit agencies such as the CTA are starting to have real-time vehicle location information, selective holding strategies can be employed where only those vehicles with long following headways are held. Real-time vehicle location information allows the Prefol strategy described earlier to be utilized. The case studies in chapters 4 and 5 of this thesis will describe the use and benefits of this strategy in detail.
2.1.4 Bus Supervision
Levinson (1991) completed a comprehensive synthesis of bus supervision practices at 20 U.S. and Canadian transit systems. This synthesis surveyed existing supervisory
practices, identified impediments to transit service reliability and bus supervision, and suggests ways to overcome these impediments. Key factors that contribute to reliable bus service are identified. Levinson also goes on to describe the role of technology in bus supervision and control.
Key Factors for Reliable Bus Service
Levinson (1991) identifies four main factors that contribute to reliable bus service:
* Realistic routes and schedules * Adequate maintenance
* Sound personnel policy * Effective supervision
Schedules must be realistic if operators are to be able to adhere to them. Schedules that are too fast or too slow will result in poor adherence and possibly bus bunching and uneven passenger loads. Route structures must also be realistic for operators to adhere to the schedule. Routes that are too long or heavily congested will compromise schedule adherence.
Maintenance of vehicles and other equipment is important in order to maximize the mean distance between failures. It is also important to be able to maximize the number of buses that can be deployed on any given day. As will be discussed in section 2.2, poor
maintenance can lead to runs being held-in and buses breaking down on the street causing severe service reliability problems.
As Levinson notes, sound personnel policies are important to keep absenteeism down and morale high among operators, supervisors, and other transit personnel. By encouraging team building efforts and promoting a "people serving people" concept, transit agencies will be in a better position to provide reliable bus service.
Once realistic schedules and routes are in place, maintenance is taken care of, and personnel policies are fine tuned, supervision will have a greater chance of being effective in keeping bus service reliable. Levinson finds that for supervisors to be most effective, "prompt and informed decisions must be made when emergencies or service problems occur. A fast exchange of information is essential to reduce response times. Communication and information technology provide the means for this rapid
communication" (Levinson, 1991).
Impediments to Supervision
In the survey of transit systems, Levinson (1991) identified several impediments to supervision as reported by the transit agencies. Most often cited as a problem was the lack of financial resources. More specifically, the lack of resources led to maintenance problems, and absenteeism, complicating the task for supervisors in the field. Some transit systems reported that too many of their routes were either too long or poorly scheduled, leading to reliability problems and the inability to supervise these routes effectively.
Poor equipment maintenance was reported to take an extra toll on reliability. Not only did equipment such as fare boxes, mirrors, or the vehicle itself break down, but
supervisors had to take care of these problems in the field, diverting them from their primary task of maintaining service reliability.
Financial resource constraints affected the supervision staff as well. Inadequate
communications was cited as inhibiting supervisors from responding in a timely manner and taking appropriate actions. The inability to have information on the entire route or network in real-time also hampered supervision efforts. Finally, several transit agencies cited a lack of personnel as an impediment to service reliability.
Technology and Management as Methods to Improve Supervision
The Southern California Rapid Transit District (SCRTD) (now known as LAMTA) as surveyed by Levinson (1991) cites several methods that could improve supervision:
* Schedule fast travel times and give operators more recovery time.
* Break long lines (routes) into segments to avoid accumulating headway problems. * Minimize diversion of supervisors to other activities. Supervisors should focus on
establishing detours, adjusting schedules, and replacing breakdowns.
* Improve management and "team building" to reduce absenteeism and excessive overtime due to "no shows".
These suggestions address the main factors influencing reliability by reducing
maintenance efforts by supervisors, improving personnel policies, and creating realistic schedules and routes.
In addition to improving on current practices, transit agencies are also looking to technology to help improve bus service reliability. Levinson (1991) cites automatic vehicle location (AVL) and automatic passenger counting (APC) systems that can be of
The Ottawa-Carleton Regional Transit Commission (OC Transpo) experience with APC is documented by Levinson. After being installed in 1975, OC Transpo was able to utilize the new APC system to log and archive vehicle and passenger movements. This then gave OC Transpo the ability to produce reports on all of its APC equipped vehicles and analyze its routes looking for reliability, or other operational problems. Levinson states that APC systems are useful to support planning and for monitoring system
performance. Recurring reliability problems can be identified and corrective actions can be taken to alleviate them.
With regard to AVL systems, Levinson examined the Toronto Transit Commission and their use of real-time AVL. Vehicles network wide communicated with inspectors at one of ten divisional control centers. The radio communications system allowed vehicles to be polled on their location about every 10 seconds. With this kind of monitoring,
inspectors were able to correct scheduling and vehicle location problems by
communicating directly with the operators via radio. The inspectors were also able to communicate with passengers to resolve fare disputes for example, or listen in on the vehicle to resolve emergencies. (This system however has since been retired due to its lack of effectiveness).
Summary
Levinson's (1991) synthesis provided a comprehensive look at the practice of bus supervision, impediments facing supervisors and service reliability, and methods and technologies that can address these impediments. This thesis will build on Levinson's work by examining how technology and management methods can improve service reliability at the CTA and MBTA but will also examine how deployment strategies of supervisory staff contribute to effective service management and improved reliability.
2.1.5
Communications and Information for Bus Supervision
Barker (2002) studied the Chicago Transit Authority's communication and information sharing infrastructure. Barker focused on evaluating how communications constraints affect the availability of information to service managers and eventually bus service reliability.
Barker's main findings demonstrated how the CTA's current radio system lacks the capacity and structure to be able to effectively manage small delays before they become big ones. He notes that "a delay cannot be addressed until it becomes a significant problem" due to the fact that small delays are never reported over the air. Only when delays exceed 10 minutes do they become candidates for being broadcast but his study shows that this can take up to another 15 minutes to report over the air, rendering the information almost useless to supervisors. Barker goes on to note that the lack of radio capacity inhibits field supervisors from sharing their own knowledge of delays on the route with central control or their peers on the street, further limiting the amount of information supervisors have. The conclusion Barker draws is that often the best option that supervisors end up having is to do nothing when faced with a service gap. This lack of action has the benefit of having "the least appealing worst-case scenario", which is the situation remaining as-is. Supervisors acting on a service gap with no information on what actions other supervisors may be taking or where other buses are, risk making the situation much worse. For example, if a supervisor expresses a bus expecting a follower close behind but the follower was short turned by a supervisor upstream, then collectively the situation is now far worse than either supervisor could have predicted (Barker, 2002).
2.1.6
Pre-planning for Service Disruptions
Moore (2002) conducted a study to develop a process to improve transit service management during disruptions. The study focused on the pre-planning necessary for service management to be able to respond effectively to disruptions.
Moore finds that pre-planning for disruptions gives transit agencies access to the ideal responses. Static information, such as the load profile or operations plan allows service managers the ability to pick out the best disruption response given a set of pre-defined options. Dynamic information such as the current loading conditions and bus locations further enhances the decision making process.
Communications and information gaps are shown in the study to be factors limiting service disruption response. Communication constraints were found to slow down the
information sharing process, leading to slow responses to disruptions. This resulted in fewer service restoration options being available due to the delayed response, and greater negative passenger impacts.
2.1.7
Simulation for the Evaluation of Control Strategies
Much of the prior research has evaluated operation control strategies through the use of theoretical models, or experiments that have utilized manually collected data. Moses (2005) attempted to evaluate these strategies through the development and application of a simulation model. Inputs included automatic vehicle location (AVL) data and
automatic passenger counter (APC) data. This simulation model, created in MATLAB, was designed to recreate observed operating conditions from the input data, and then predict the effects of various operations control strategies.
Unfortunately, Moses was unable to validate the model against real operating conditions. Simulated headway variances and travel time variances were statistically significantly different than the observed conditions at multiple timepoints. This was attributed to complex interactions between vehicle travel times, dwell times, and human behavior that have not yet been modeled successfully. The Ashland route characteristics - a long, high frequency route - were also cited as creating a "worst case" in terms of the difficulty of the simulator replicating actual conditions.
This thesis will attempt to use the simulation approach Moses described to evaluate the effectiveness of supervision and operations control. The simulator will focus on only one hour, and one direction of the route however in order to minimize the complexity Moses found to be difficult to model.
2.1.8
Operations Control and Bus Supervision: Tri-Met Case Study
Tri-Met, the transit provider in the Portland, Oregon metropolitan area has recently implemented an automated Bus Dispatching System (BDS). This system incorporates AVL and APC technology combined with real-time schedule adherence information that is communicated to the operator and dispatchers.
Strathman et al. (2001) conducted a study utilizing the BDS system in an attempt to improve reliability on a number of routes leaving downtown Portland during the PM peak hour. This study involved one dispatcher monitoring these routes during their inbound trip for schedule adherence. If the dispatcher anticipated that a run would be late on its outbound trip, a field supervisor was notified so that Turnquist's (1982) "Prefol" holding strategy could be implemented. Other available operations control strategies included short turning and "switching" where the dispatcher would substitute a tripper run for a regular service bus, or vice versa, in order to maintain headway regularity.
The results of the study showed that headway variances declined 3.8% overall and 15.8% at the control point. Neither decline however was found to be statistically significant at the 0.05 level. Headway variance was found to be lowest at the control point and increased at every timepoint downstream. Most striking was that the effects of headway control at the terminal were concentrated at the first three timepoints.
Although the study's effects on headways were mixed, passenger load variance was shown to decrease by 16%. The authors attribute this to the more regular departure headways and conclude that their analysis "indicates that small improvements in service
regularity can potentially generate more substantial improvements in passenger load maintenance."
2.1.9 Summary of Literature Review
This literature review has shown that there has been a great a deal of research into the topics of transit service reliability, operations control strategies, and bus supervision.
Abkowitz et al. (1978) documented several of the environmental and inherent causes of unreliability, methods to measure unreliability, and the impacts of reliability on traveler behavior.
Turnquist (1981) presented an analysis indicating the benefits of headway-based holding for high frequency routes on service reliability. An important conclusion that ties into this thesis relates to the "Prefol" strategy of holding buses to even out headways. This strategy requires information on the following headway - information that usually requires a real-time AVL system. The strategy however can be more effective than a single-headway holding strategy which only requires information on the preceding headway.
Turnquist and Blume (1980) demonstrated the effects of the control point location on the benefits of headway-based holding. The authors found that it is important to locate the control point as early as possible on the route. This way, many passengers who are waiting to board downstream will benefit while few passengers will be on board the held bus and inconvenienced.
Levinson (1991) surveyed several North American transit agencies about their supervision practices. The author finds that there are four main inherent factors that contribute to service reliability: realistic routes and schedules, adequate maintenance, sound personnel policies, and effective supervision. For supervisors to be effective, Levinson notes that they need an efficient communications system that allows a fast
exchange of information for timely and appropriate responses to service disruptions. Technologies such as real-time AVL and APC systems are cited as possible solutions.
This thesis will build from this prior research by attempting to define more effective bus supervision deployment strategies for the CTA given their evolving real-time AVL system and existing personnel and communications capabilities. The operations control strategies described by Turnquist and Blume will be applied in chapters 4 and 5 to examine their effectiveness on service reliability. Their supervisory resource requirements in terms of communications, information, and personnel will also be examined.
The next section will describe the key aspects of bus service reliability from planning to operations. The following section will then review the role of bus service management, the operations control toolbox, and the resources necessary for supervisors to be most effective.
2.2 Bus Service Reliability
At the core of bus service reliability is the notion of how customers and transit agencies perceive service delivery. Customers want to be able to count on transit service time and time again. They want predictable wait times as well as travel times that are consistent from day to day. Transit agencies also want the same thing for their customers. More reliable service means customers are being offered higher service quality, and agency resources are being utilized more effectively.
As long as service delivery perceptions fall in line with expectations, transit agencies and their customers can agree that bus service is reliable. If service expectations are not being met, then service could be classified as being unreliable. Headways may be uneven
trying to maximize the benefits of public transportation, it is clear that making service reliability an underlying goal is in the best interest of transit agencies and their customers.
To help identify shortcomings in service reliability, transit agencies need to define their own internal metrics that will reflect service conditions. These metrics can then be used to highlight the most pressing improvements needed, such as correcting late terminal departures or decreasing operator absenteeism, as well as the methods that can be used to address them.
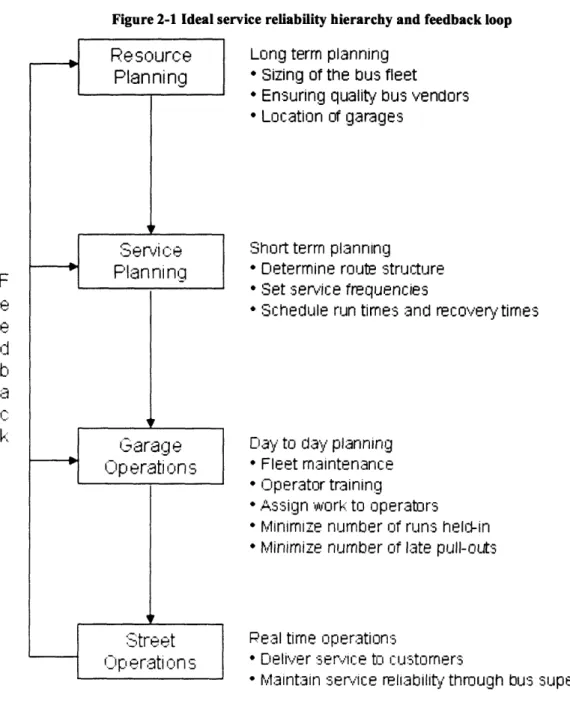
In order to achieve reliable bus service, transit agencies must first begin planning for it well in advance of their buses actually operating on the streets. This process, as shown in Figure 2-1, requires a coordinated effort from many departments within a transit agency.
Service planners and schedulers need to develop operating plans with realistic frequencies and running times that meet their customer's expectations. Resource planners, service planners, and garages will have to communicate effectively so that enough buses are in the fleet to meet service demands. At the garage level, fleet
maintenance is essential to keeping the fleet operable and street ready. Garages have the added responsibility of making sure that there are enough operators to fill the service demands prescribed by the planners. Should all of these requirements be met, bus service will be in an ideal position to achieve maximum reliability on the street. Bus supervisors
can then focus on real-time issues such as traffic, weather, and accidents to maintain service reliability.
Unfortunately, bus operations departments in the real world do not have the luxury of being perfectly set up to run reliable service. Budget realities limit the resources
available to planners and garage managers meaning that they must prioritize resource allocation to gain the maximum service reliability benefits. In the following subsections, the planning process as it pertains to operations, as well as the activities that take place at the bus garages will be described to paint a clearer picture of these limitations and how they affect bus service reliability.
Figure 2-1 Ideal service reliability hierarchy and feedback loop
Resource Long term planning
Planning * Sizing of the bus fleet
lanServ i Planning Garage Op erati on s Street O p erati on s * Ensurin
g quality bus vendors * Location
of garages
Short term planning
* Determine route structure * Set service frequencies
* Schedule run times and recovery times
Day to day planning * Fleet maintenance * Operator training
* Assign work to operators * Minimize number of runs held-in * Minimize number of late pull-outs
Peal time operations
* Deliver service to customers
* Maintain service reliability through bus supervision
2.2.1 Planning for Service Reliability
To lay the groundwork for reliable service delivery, transit agencies can set their service standards (expectations) to reflect what their customers expect. These standards then serve as goals and objectives during the operations planning process.
iP
I
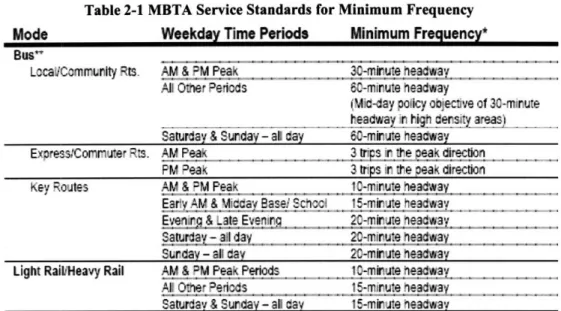
VFor example, the MBTA 2004 Service Delivery Policy outlines a minimum frequency standard for all of its bus routes as shown in Table 2-1.
Table 2-1 MBTA Service Standards for Minimum Frequency
Mode Weekday Time Periods Minimum Frequency* Bus"
Local/Community Rts. AM & PM Peak 30-minute headway
All Other Periods 60-minute headway
(Mid-day policy objective of 30-minute
.... ___headway in high density areas) .____
Saturday & Sunday - all day 60-minute headway
Express/Commuter Rts. AM Peak 3 trips in the peak direction
PM Peak 3 trips in the peak direction
Key Routes AM & PM Peak I0-minute headway
Early AM & Midday Basel Schoci 15-minute headway
Evenirg & Late Evening 20-minute headway
Saturday - all day 20-minute headway
Sunday - all day 20-minute headway
Light Rail/Heavy Rail AM & PM Peak Periods 10-minute headway
All Other Periods 15-minute headway
Saturday & Sunday - all day 15-minute headway
The MBTA then goes further and establishes service standards for reliability as shown in Table 2-2.
Table 2-2 MBTA Service Standards for Service Reliability Trip Test Beginning ofRoute Mid-Route TimePoint(sl' End ofRoute
Scheduled Departure Trips Star 0 ninutes early Depart 0 morutes early Ar-ve 3 :rutes early
'Head ways •10 minutes: to 3 iinftes .ate to 7 rinutes late to 5 minutes ate
Walk-up Trips Start within 25% cf Leave within 50% of Runn g tirre wihin
2C% cf scheduled
(Headways <10 mrutes): scheduled headway scheduled headway rurnin ti-e
rurn
if lime
For any given bus route to be in compliance with a the Schedule Route Test Adherence Standard, 75% of all trips on must adhere to the abovemeasures over the entire service day.
*F:r Scneale Asherence, mi'cute "me points will be used only for roites on whic• ~e cIname performance data has
been cclie~ed iing CA-IAVL equi*snent
The CTA has also established its own service standards for recommended frequency for all of its bus routes as shown in Table 2-3. These standards are set to provide enough capacity to serve the current demand. Although the CTA has no official service standard for reliability, policies and programs exist to discourage bus operators from running early and to help them recover from running late.
<30
30-60
60-90 90-125 125-16$ 165-240 240-300 300-360 > 360 -wiWuWw ol U~WIUJ 30 20 15 12 10 7 5 6 5 <5 <30 20-40 30-45 35-50 40-55 40-60 45-60 50-60 60(Minutes) (Average for period)
220-320 75 55-80
320-425 6 65-85
430-560 5 70-93
>560 < 5 93
(Minutes) Bus (Average)
Midday (9:00 a.m.- 3 ' 40 30 < 20 p.m.), Saturday, and 40-60 13-20 Sunday 60-100 15 15-25 100-150 12 20-30 150-210 10 25-35 >210 < 10 30-40 Evening (Everyday 1 40 30 < 20 between 7 p.m. and 40-60 20 13-20 midnight) 60-100 15 15-25 100-125 12 20-25 >125 <110 21-30 Owl (Everyday < 30 30 < 15
between midnight and 30-60 20 10-20
5 a.m.) > 60 15 15-·25
Once the service standards have been set, it is up to the planning and scheduling
department to craft an operations plan that effectively utilizes agency resources to meet the goals and objectives within the service standards. Route characteristics such as expected running time, running time variability, and ridership are folded into the planning process to produce an operations plan for each route. From this, the actual cycle time,
including recovery time, is calculated and an appropriate number of buses and operators are assigned to the route in order to meet the service standards.
It is during the planning process that the transit agency is able to take its first shot at establishing reliable service. The operations plan that results must be robust enough to allow service to run reliably given real world operating conditions. Physical features of the road network (i.e. width and number of lanes), traffic conditions (i.e. variability, traffic lights), ridership patterns, and other factors must be properly taken into account when formulating the operations plan.
Some of the tools available to the planning department that can help improve service reliability include schedule adjustments (running times and recovery times), and adding extra service (spare buses and operators). Placing idle buses and operators on a route to serve as "gap buses" in the event of a service disruption is rarer and not only is it very expensive, but it may be impossible if the equipment spare ratios are too low. If operators are constantly running late and unable to make their time points, scheduled running times may be increased, or more recovery time added in order to increase service reliability. This too can be expensive if more buses and operators are necessary to maintain the minimum frequency requirements.
2.2.2 Service Reliability at the Garage Level
Once the operations plan has been approved, it will be up to the bus operations division to see the plan through.
Each bus route plan consists of several pieces of work that are assigned to bus garages. The schedule, number of hours, and amount of work all depend of the specific operations plan for the route. Operators at each garage then bid on the work in what is usually a quarterly, seniority-based "pick" cycle. These cycles allow operators to decide which
route(s) they want to work, the hours they are on duty, and their days off. The pick is designed to ensure that all pieces of work get covered by an operator. The higher the
operator's seniority, the better chance they have of getting their preferred routes and work days. In general, full-time operators will have 40 (or more) hours of work, and part-time workers less.
Since each piece of work is covered by only one operator, the reliability of the operations plan is vulnerable to absenteeism. An operator calling in sick or unexpectedly missing work for any reason leaves this work open while they are absent. The garage will attempt to cover the missing operator's work by assigning it to an extra-board operator or by calling up another operator to work their regular day off. This is an example of another line of defense in maintaining service reliability on the street. If the work cannot be filled, other already assigned operators may be reassigned to cover it if it is deemed important, leaving "less important" work to be dropped. At the CTA, this is referred to as a "10-52, personnel shortage - run held in". Every run that is held in represents a missing bus to customers along the entire route and it will be up to the last line of defense
- bus supervisors - to manage this problem in real-time and keep service as reliable as possible.
Operating reliable bus service depends not only on operator availability, but also on bus availability. A transit agency's maintenance effort must keep enough buses in operable condition to meet peak pull-out requirements every day. Critical items such as
headlights, brakes, windshield wipers, doors, and wheelchair lifts must be in working order before buses are allowed to hit the streets. If any critical item fails, the bus is sidelined even before pulling out and must be replaced by a spare, if available, to be able to make its scheduled trips for the day. With budget limitations straining transit agency resources, maintenance continues to be hard pressed to check and repair the entire fleet every night. Problems may go unnoticed right up until the morning pull-out check forcing buses into the repair bay at the last minute.
It is clear that even if there are enough operators and buses to cover the day's work, service reliability problems can still arise before they begin their runs. A last minute wheelchair lift or door problem will force the operator to find a new bus, a move that will
potentially put him well behind schedule. If there are no more buses available due to maintenance deficiencies, then the run may even be held-in. Garages with only one or two pull out lanes are especially vulnerable to maintenance delays. Operators at the CTA are required to cycle their wheelchair lifts and perform other checks before leaving the garage. With literally hundreds of buses pulling out of the garage within a short amount of time in the peak periods, one defective bus can lead to long delays for the buses behind it. Other issues such as operators arriving late to work, or taking too much time to pull out will also be detrimental to service reliability.
Once the buses begin their scheduled operations on the street, the internal policies and processes described here interact with external factors to influence the reliability of on street bus service. The planning and scheduling department has done its part to set up the operations department with the frequencies, run times, and recovery times it thinks necessary to give the best possible chance of running reliable bus service (to the extent
that the budget will allow). The garages have done their part to fill as much of the work as possible with the available resources. Now, service reliability will be at the mercy of the lingering effects of internal factors, external factors, and the effectiveness of the bus
service management (BSM) staff.
2.2.3 Service reliability on the street
Several factors exist that can cause service to become unreliable. While many of these factors are external and beyond the transit agency's control, BSM must still deal with them to provide the most reliable service possible. Internal causes of unreliability also exist and add to the work load of BSM. Table 2-4 lists some of the common causes of service unreliability.