Characterizing Tensile Loading Responses of 3D Printed Samples
by
Christopher M. Haid
Submitted to the
Department of Mechanical Engineering
In Partial Fulfillment of the Requirements for the Degree of
Bachelor of Science in Mechanical EngineeringAt the
Massachusetts Institute of Technology June 2014
MASI CHUSETTS INSTITUTE
OF TECI-VOLOGY
JUL 3 0 2014
LIBRARIES
Signature of Author:
@2014 Christopher M. Haid. All rights reserved The author hereby grants to MIT permission to reproduce
and to distribute publicly paper and electronic copies of this thesis document in whole or in part
in any medium now known or hereafter created.
Signature redacted
-~
Deportment of Mp6anal EngineeringMay 9,2014
Signature redacted
Certified by:Fred Fort Flowers '41 & Daniel Fort
Sanjay E. Sarma, PhD Flowers '41 Professor of Mechanical Engineering Thesis Supervisor
Signature redacted
Accepted by:
Annette Hosoi Associate Professor of Mechanical Engineering Undergraduate Officer
(This page intentionally left blank)
Characterizing Tensile Loading Responses of 3D Printed Samples
by
Christopher Michael Haid
Submitted to the Department of Mechanical Engineering on May 9, 2014 in Partial Fulfillment of the
Requirements for the Degree of Bachelor of Science in Mechanical Engineering
ABSTRACT
An experimental study was performed to characterize the loading response of samples manufactured through 3D printing. Tensile testing was performed on a number of 3D printed samples created through Fused Filament Fabrication (FFF). Printed samples were made from ABS or PLA plastic.
A range of infill densities from 25% to 100% were tested for each material. Additionally, samples were
printed with layers at several angles relative to the tensile loading of the sample.
Failure modes were characterized as either delamination in the elastic region, delamination in the plastic region, brittle fracture, or ductile fracture. Loading response curves were analyzed to find the peak load, structural stiffness, load at plastic yield, and effective strain at failure. Samples loaded along the printed layers with 100% infill density displayed the most favorable mechanical properties. Samples loaded perpendicular or at an angle to the printed layers failed at smaller loads and displacements. Additionally, samples printed at less than 100% infill also tended to fail sooner.
Thesis Supervisor: Sanjay E. Sarma, PhD
Table of Contents
Abstract 3
Acknowledgements 4
Table of Contents 5
List of Figures 7
1. Characterization of 3D Printed Parts 8
1.1 Additive and Subtractive Manufacturing 8
1.2 Additive Manufacturing Techniques 10
1.3 Fused Filament Fabrication 10
1.4 Part Characteristics 11
2. Production of 3D Printed Parts 12
2.1 Printing Apparatus 12
2.2 Part Generation 13
2.3 Printing Parameters 16
2.4 Failed and Flawed Parts 16
3. Tensile Loading of 3D Printed Parts 17
3.1 Testing Setup 17
3.2 Testing Protocol 17
3.3 Sources of Error 18
3.4 Limits of Testing 20
4. Analysis of Loaded Samples 21
4.1 Angular Dependency of Response 21
4.2 Effective Stress and Effective Strain 22
4.3 Characterizing Failure Modes 22
5. Conclusions 32
6. Appendices 33
Appendix A: KISSlicer Parameters 33
Appendix B: Fracture Surfaces 35
List of Figures Figure 1-1: Octahedral Infill Cross Section
Figure 1-2: Toolpaths for Various Infill Types Figure 1-3: Varying Infill Scales
Figure 2-1: Solidoodle 2 Pro
Figure 2-2: Standard Printing Process Figure 2-3: Rendered Images of Samples Figure 2-4: Rendering of Plated Samples Figure 2-5: Printing of Plated Samples Figure 2-6: Final Printed Samples
Figure 3-1: ABS Sample Fixtured on the Instron Figure 3-2: Resting Length of Testing Samples Figure 3-3: Angular Misalignment of Sample Loading Figure 3-4: Failure Occurring Outside of the Test Zone Figure 4-1: Fracture Planes of ABS Samples
Figure 4-2: Fracture Planes of PLA Samples
Figure 4-3: Loading Curve and Fracture Surfaces Exhibiting Delamination in the Elastic Region Figure 4-4: Loading Curve and Fracture Surfaces Exhibiting Delamination in the Plastic Region Figure 4-5: Loading Curve and Fracture Surfaces Exhibiting Brittle Fracture
Figure 4-6: Loading Curve and Fracture Surfaces Exhibiting Ductile Fracture Figure 4-7: Categorization of Parts
Figure 4-8: Infill Density vs. Peak Loading of PLA and ABS Samples Figure 4-9: Infill Density vs. Stiffness of ABS and PLA Samples Figure 4-1: Infill Density vs. Load at Yield of ABS and PLA Samples
Figure 4-1: Infill Density vs. Effective Strain at Failure of ABS and PLA Samples Figure B-1: Fracture Surfaces of Loaded PLA samples at 100% Infill
Figure B-2: Fracture Surfaces of Loaded PLA samples at 50% Infill Figure B-3: Fracture Surfaces of Loaded PLA samples at 25% Infill Figure B-4: Fracture Surfaces of Loaded ABS samples at 100% Infill Figure B-5: Fracture Surfaces of Loaded ABS samples at 50% Infill Figure B-6: Fracture Surfaces of Loaded ABS samples at 25% Infill
8 9 9 12 13 13 14 14 15 17 18 19 19 21 21 23 24 25 26 27 28 29 30 31 35 35 36 36 37 37
Chapter 1
Characterization of 3D Printed Parts
Additive and Subtractive Manufacturing
Additive manufacturing is a relatively new manufacturing technique which contrasts subtractive manufacturing. Subtractive manufacturing techniques begin with a block of material. The final form of the part is determined by the material removed from the original block. Additive manufacturing approaches the manufacturing problem from the opposite direction: an empty build volume is the starting point and material is added to determine the final form of the part. Typically, additive manufacturing is performed by laying down material in flat layers to build up the final desired part. Therefore, the issue of process optimization is reversed: in subtractive manufacturing the process is optimized by minimizing material removed whereas in additive manufacturing the process is optimized
by minimizing the material added. Optimizing for additive manufacturing is to minimize material waste
and minimize overall print time. The capabilities of 3D printers allow users to produce internal geometries in components, unlike subtractive techniques where the user can only define the surface geometry of the final part.
Figure 1-1. Octohedral Infill Cross Section. This image shows a
octahedral infill pattern at 10% density. The octahedral pattern the amount of material added.
cross section of a part printed with an provides some strength while reducing
Due to the importance of optimizing tool paths of 3D print jobs, parts produced via additive manufacturing often have an internal infill pattern designed to provide strength. Figure 1-1 contains a cross sectional view of an octahedral infill pattern: one of several common infill patterns. Other common infill patterns include rectilinear, honeycomb, and concentric patterns. More complex infill
patterns such as the Hilbert curve are available for experimental use. Various infill patterns offer different part characteristics including strength and flexibility.
In addition to variation in infill pattern itself, the scale of the pattern can also be altered to achieve an arbitrary final part density. Patterns which are scaled up will result in a lower density and vice versa. This variation is illustrated in Figure 1-2. The density resulting from the scale of the pattern also affects final part characteristics.
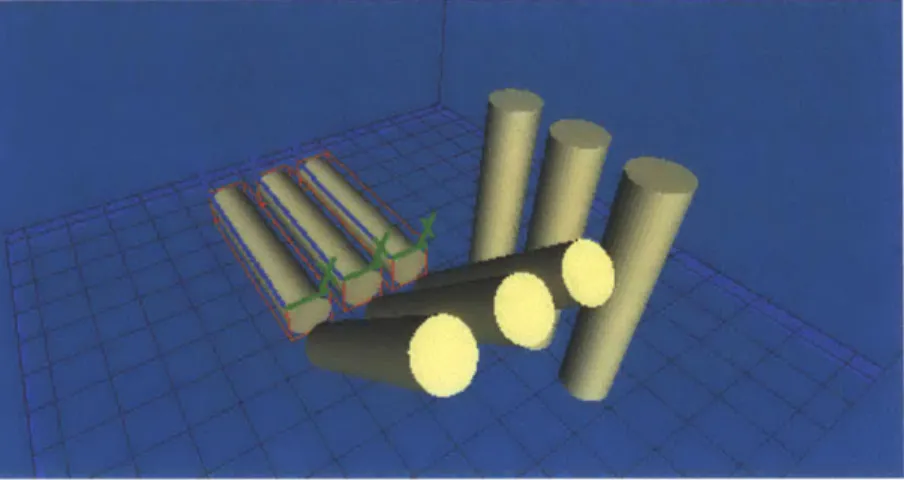
Figure 1-2. Toolpaths for Various Infill Types. These are the toolpaths generated by KISSlicer for
cylindrical samples used in this research. Note that each toolpath consists of two perimeter paths to create the part surface. Additionally, each toolpath contains an infill pattern to form the bulk of the part. At far left is the toolpath for a layer filled at 100% infill density. The center image shows the toolpaths for a layer set to 50% infill density. At right is the toolpath for a layer filled at 25% infill density.
Figure 1-3. Varying Infill Scales. Above are cross-sectional views of printed components. From left to
right respectively are samples printed at 100%, 50%, and 25% infill density. These samples are printed from uncolored ABS.
Finally, it should be noted that 3D printed components are printed layer by layer. The final part will contain a material grain, most often visible to the naked eye, whose orientation also affects the parts response to loading.
Additive Manufacturing Techniques
There are currently three main approaches to additive manufacturing. Firstly, there is Selective Laser Sintering (SLS). The SLS process uses a mechanical arm to distribute a flat layer of very fine powder. A laser is then manipulated to locally sinter the powder in the desired pattern, forming a solid layer. Next, another layer of powder is distributed and the process is repeated until the final part is formed. Parts can be produced from powderized polymers like nylon and powderized metals like titanium. SLS printers require a vacuum or inert cover gas in addition to an evenly heated build volume. These requirements cause contemporary SLS printers to be prohibitively expensive and typically
reserved for industrial use. (Hart)
The second common approach to 3D printing is through the technique of Stereolithography
(SLA) printing. SLA printers manipulate a beam of UV light across a layer of photo-curable, liquid resin.
The UV light causes the resin to harden locally. Once the resin has been hardened in the pattern of a single layer the SLA printer moves on to the next layer, curing the resin layer-by-layer until the final part is formed. Inexpensive SLA printers exist for desktop use. One drawback SLA produced parts is the post-treatment process required to make the parts safe for human handling. (Hart)
The third common approach to 3D printing is through jet-based extrusion. Jet-based extrusion techniques include sand-binding, Polyjet, and Fused Filament Fabrication (FFF) among others. Material ejected through a nozzle is the common features of jet-based extruders. Fused Filament Fabrication 3D printers employ an extruder which forces filament through a hot nozzle, ejecting a thin stream of melted material. A layer is formed as the printer ejects material while tracing the pattern of the layer. Once a layer has been completed and has adequately cooled the printer will move on to print the next layer. This process is continued until the part has been completed. Printable plastics include a growing number of thermoplastics and composite materials. Inexpensive FFF 3D printers are currently available for desktop use and require minimal to no post-processing. (Hart)
Several other unique types of printers exist that do not fit under the main three categories. Printers that employ paper binding, metal welding, and a number of other techniques fit fringe use cases.
Fused Filament Fabrication
For this research, printed parts were produced through Fused Filament Fabrication. The Fused Filament Fabrication process is currently developing at a quick pace as these machines become less expensive with time. Due to the recent commercial success of desktop FFF printers, there is interest in characterizing the mechanical properties parts produced through this particular technique.
Characterization of parts allows for greater optimization of print jobs which is important in the development of additive manufacturing technologies.
FFF 3D printers are capable of printing a wide variety of polymers including but not limited to
ABS, PLA, and nylon. Additionally, composite materials such as carbon fiber embedded in a polymer
have produced successful parts. For a material to be printable, it must be a thermoplastic or contain a high content of thermoplastic.
Part Characteristics
To characterize the 3D printed parts, it must first be recognized that the result will not come as material properties but as structural properties. This is due to the fact that the printed parts are not homogenous materials. For parts with densities less than 100%, the printed parts have an internal pattern and are therefore not homogeneous such as the patterns shown in Figure 1-1 and Figure 1-3. Additionally, parts that are printed at 100% infill density will have small, internal pockets of air due to inaccuracies inherent to the printing process. One cause of air pockets is the fact that the part is formed from a stream of liquid material. Even with precise positioning of the nozzle, the extruded polymer will occasionally flow out of its intended position before cooling and hardening. By printing at a temperature very close to the melting point of the material this inaccuracy is minimized. However, this problem cannot be completely eliminated. Therefore all printed parts must be analyzed for structural properties rather than material properties.
The goal of this research is to test printed samples to find the stiffness, load required to cause plastic yield, peak loading, and an effective strain at fracture for each sample. The samples vary in the orientation of layers, infill density, and material type.
Chapter 2
Production of 3D Printed Parts
Printing Apparatus
The samples developed for this research were printed on a Solidoodle 2 Pro 3D printer, shown in Figure 2-1. This printer was chosen due to its ability to produce the desired parts at a reasonable accuracy and precision. The printer is run using stepper motors driven by a Printrboard (REV-E). The gantry design and rigidity of the Solidoodle 2 Pro allows for a printing resolution of ~100 microns. This limit is largely affected by the size of the hot end nozzle which is approximately 350 microns in diameter. The Solidoodle 2 Pro also has a heated print bed, which makes possible the production of ABS parts without a heated chamber.
Figure 2-1. Solidoodle 2 Pro. The Solidoodle 2 Pro is the machine used to 3D print testing samples with
varying orientation, density, and material. This printer was chosen due to its ability to produce the desired parts and its availability.
In the 3D printing industry, a large variety of thermoplastics and composites are available for use. The most commonly used plastics are ABS, PLA, and nylon. For this research ABS and PLA were used to print. Nylon was not used as it requires a printing temperature of ~2600C which is higher than the
rated temperature of the Solidoodle 2 of 2200C. ABS and PLA have a lower melting temperature within
the specifications of the Solidoodle 2.
The ABS and PLA that is available for 3D printing also varies between suppliers. Inconsistencies can be caused by impurities in the plastic, additives such as dyes that are added to the plastic, or other
factors in the manufacturer's production process. Filament produced by Sainsmart was used for all samples in this research. This supplier was chosen due to the consistency in filament quality as determined by use prior to this research. ABS procured from Sainsmart was printed at 2150C and PLA
was printed at 1800
C. Printing temperatures were not varied because this would cause failed prints. Part Generation
To generate the desired parts for testing, the standard printing process was performed from part design to final printing. This process is illustrated in Figure 2-2.
CAD File
G
Code
Printed Part
Slicing
Printing
Figure 2-2. Standard Printing Process. The flow diagram above shows the standard 3D printing process.
First, a model is generated in CAD software such as Solidworks. The model is exported as the universal
.STL file type and submitted to a slicer program such as KISSlicer. Machine parameters and part
parameters are entered into this software in addition to the .STL file. When executed, the slicer program outputs machine commands in the form of a .GCODE file. This file is then uploaded to the 3D printer for
printing.
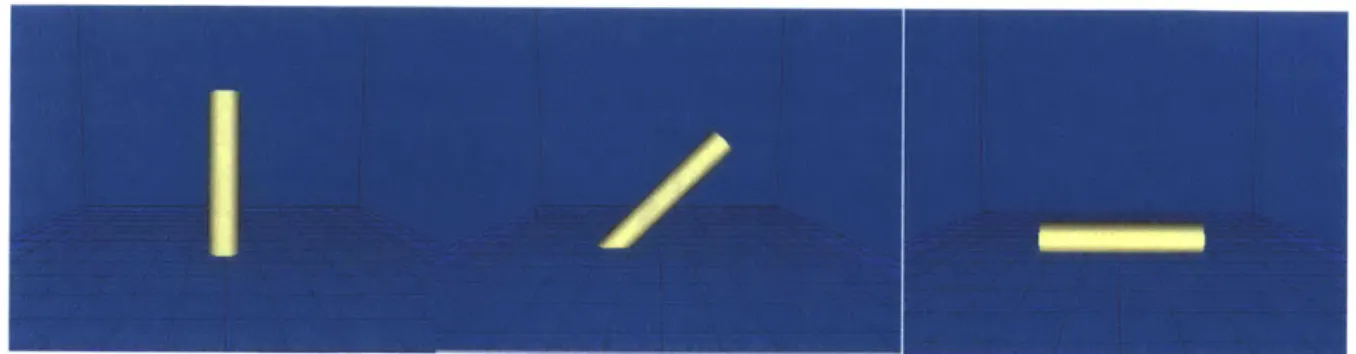
The sample for testing was designed in Solidworks. The part was designed to fit between two clamps in an Instron. Samples consisted of a simple cylinder of diameter 10mm and length of 50mm. Figure 2-3 shows a rendering of this file in several orientations.
The relationships of loading responses to infill, orientation, and material are desired. To find these relationships, models created in several orientations were created in Solidworks. Variation in infill and material type are handled in the next steps of the part generation process.
Figure 2-3. Rendered Images of Samples. The samples were designed in three orientations to observe
loading response when loading is applied in different angles with respect to the layers of the part. The model at far left results in a part where the load is applied perpendicular to the printer layers. The
model in the center image results in part where the load is applied at 450 to the printed layers. The bottom of the part was extended to the base plane for sufficient adhesion during printing. The model at far right results in a sample where the load is applied along the printed of the part. These images were
rendered in KISSlicer Pro.
Figure 2-4. Rendering of Plated Samples. Samples were plated together to cut down on overall process
time. For small batches, plating the samples cuts down on overall time by eliminating the time required to remove the previous print job and start a new one. Samples printed together have the same infill density and material type, but can vary in orientation.
Once the three models were developed in Solidworks, they were exported as an STL (Standard Tessellation Language) file that defines the model as a set of points in three dimensional coordinates. The STL file was uploaded to a slicer program. A slicer program is a program which takes an STL file and a set of parameters as inputs to generate machine commands for a 3D printer resulting in the desired part. The machine commands are exported in the form of a .GCODE file.
Figure 2-5. Printing of Plated Samples. GCODE generated by KISSlicer was sent to the Solidoodle 2
printer, a Fused Filament Fabrication (FFF) printer. Parts were then printed in either PLA (photographed above) or ABS plastic.
The slicer software used for this research was KISSlicer Pro v1.1.0.14. It is important to note the slicing software used because there are variations in slicer programs which could potentially cause variations in final part outcome. Other popular slicer programs include Slic3r, Cura, and Skeinforge. KISSlicer was chosen due to several customization options that allow for a higher consistency of successful print jobs.
Finally, once the .GCODE file has been generated, the file is submitted to the printer and the job begins. Since several print jobs could fit on a plate at the same time, samples were printed in batches where possible. The typical configuration used for printing a plate of samples is shown in Figure 2-4 and Figure 2-5.
Figure 2-6. Final Printed Samples. Samples were printed with PLA (blue) and Abs (white) plastic. Depicted above are samples printed with axial loading at 450 to the printed layers. Samples were also developed for axial loading perpendicular and parallel to the layers of the sample.
The samples were developed with three variations. First, the direction of the printed layers with respect to the loading direction is varied. Parts were printed in different orientations so that the 3D printing process would result in layers of varying orientation for different samples. The printed layers are always parallel to the printing surface with virtually all current printing processes including FFF.
The presence of layers can be eliminated by implementing a slicer program that generates 3D tool-paths. Unfortunately, slicer software that generates 3D tool-paths is not widely available or used. Therefore, this research was performed with tool-paths forming the samples in two dimensional layers. Parts were produced in three orientations: with loading perpendicular to the layers, with loading parallel to the layers, and with loading slanted at 450 to the layers.
Secondly, samples were printed at several infill densities. Samples were tested at 25%, 50%, and
100% infill. The lower limit of 25% was determined during initial testing. It was found that clamping
samples with a density of less than 25% resulted in the Instron clamps crushing the part, making low-density parts very difficult to fixture given the experimental setup.
Finally, material type was varied. The two most widely used plastics by FFF printers are ABS and PLA. These plastics were used for testing due to popularity and availability.
Printing Parameters
Part parameters were set in KISSlicer prior to GCODE generation. Layers were generated with three perimeter paths making up the part's surface followed by an infill pattern to make up the part's bulk. Support material was used on samples printed horizontally and at a slant to minimize artifacts present due to gravity. ABS was printed at a temperature of 2150C and PLA was printed at 1800C.
Temperatures were not varied as it was found that printing at an incorrect temperature would cause failed parts. A full set of printing parameters are available in Appendix A.
Failed and Flawed Parts
Several issues occurred during the printing process that resulted in failed parts. These issues included non-adhesion of parts to the print plate, gantry sticking due to skipped steps of the stepper motors, and jams formed within the extruder. Issues that cause failed parts resulted in an increase in overall process time. To solve the issue of non-adhesion to the plate, solutions of suspended plastics were prepared. For PLA non-adhesion, a solution of PLA dissolved in dichloromethane (DCM) was produced and applied in a thin layer to the print surface with a paintbrush. Once applied, the volatile
DCM evaporated to leave a thin layer of PLA plastic bound to the print surface to drastically increase
adhesion. Similarly, in response to ABS not-adhesion, a more common issue, a solution of ABS dissolved in acetone was produced. Similar to the PLA-DCM solution, the ABS-acetone solution was applied to the print surface with a paintbrush causing the acetone to evaporate and leave behind a layer of ABS bound to the surface. The issue of gantry sticking was solved by lubricating the bearings and pulleys of the printer. Jams were fixed by removing the jammed plastic and re-printing the part.
An ideal 3D printed part will have the same outside geometry as the .STL file generated in the
CAD software. However, several sources of error occur in every part. Dimensional errors are created as a
result of the printing process. One artifact generated in the printing process is drooping. Drooping often occurs when overhangs are printed. Melted plastic does not have a chance to solidify and is pulled downwards by gravity. This issue is minimized by printing as close as possible to the melting temperature of the input material and by printing with support material.
The issue of warping arises from thermal gradients present in the part during the print jobs. A layer contracts locally as it cools, creating internal stresses in the part. These internal stresses can create part warping with visible displacements.
Chapter 3
Tensile Loading of 3D Printed Parts
Testing Setup
Samples were loaded in tension on an Instron. The software used to test on the Instron was MTestW Version M 9.0.7e. A 20 kN load cell was used for measurements.
A testing routine was generated in MTestW. Threshold level was set to 1N, as plastic will displace at much smaller loads. The Instron was set to load the part at a rate of 4.0 mm/minute. Samples were taken at a rate of 5 Hz. The testing routine was run until a displacement of 20.0 mm was reached.
All samples failed far before the 20.0 mm limit. Testing Protocol
Samples were fixtured with two-jaw clamps on the Instron as shown in Figure 3-1. The clamps contained toothed recesses designed to fit cylindrical samples.
Figure 3-1. ABS Sample Fixtured on the Instron. At left is a view of the toothed clamp used to fixture
the samples. The clamp contains a toothed recess designed to fit cylindrical samples. At right is an ABS sample fixtured in the Instron.
Data was taken directly from the Instron's force and displacement sensors. Samples were fixtured to the movable top clamp and then fixtured to the stationary bottom clamp. Performing the procedure in this order prevented the sample from deforming or breaking. This is especially important
as these plastic samples are prone to failure during fixturing if the process is reversed. Clamps were tightened to a point where the parts were not crushed by the clamps but also would no slip during loading.
Once successfully fixtured in place, the Instron force and displacement were zeroed. The force is known to be close to 0 N because the sample was lowered into the lower jaws and then clamped into place with only the horizontal force of the clamps. Therefore, the vertical force contribution (in the direction of the loading) sees little to no change during the clamping process. Once clamped in place, the length between the ends of the clamp was chosen as the initial length, L, of the sample to be tested. This distance is shown in Figure 3-2.
Figure 3-2. Resting Length of Testing Samples. The photo on the left shows where the measurement for resting length of the sample was taken. This value is used for effective strain calculations. On the right, a caliper is used to take the initial length. Once the initial length was taken the Instron was zeroed for length and force.
Once the Instron was zeroed for initial displacement and initial force, the loading procedure was applied. Each test was allowed to run until final failure.
Sources of Error
Several sources of error arise from the Instron configuration. One issue is angular misalignment between the two loading clamps of the Instron. If these clamps are not aligned correctly, parts will fail under a smaller vertical load because of the horizontal components arising from this misalignment. The extra forces that arise are not accounted for by the Instron which can only measure loads aligned with its vertical axis. This issue is pictured in Figure 3-3.
A second source of error is when the part does no fail within the testing zone. This occurs
typically when the teeth of the clamps cause a crack to propagate across the part causing failure within the clamped length of the sample. An example of this failure is shown in Figure 3-4. Samples that failed in this manner were re-printed and tested again.
F
/
//
I/F
-
Clamp
Sample
Clamp
Figure 3-3. Angular Misalignment of Sample Loading. This diagram illustrates the extra force arising
from angular misalignment of the Instron's loading clamps. In addition to the desired vertical components of force, misalignment adds a horizontal component to the force. The horizontal load is not sensed by the Instron's force sensor. Since only one component of force is measured, this misalignment will cause failure to appear to occur at a lower force.
Figure 3-4. Failure Occurring Outside of the Test Zone. In several cases, failure was observed within the
clamps of the Instron. It is believed that these failures were caused by the teeth of the clamps propagating cracks in the parts, causing local failure. A small fracture is present as indicated in the photograph above.
A final source of inaccuracy arises when a sample slides through the clamp. If a part is not
adequately fixtured, a skip-and-catch pattern of loading is observed. This occurs if the part is not adequately clamped into the Instron. Due to the toothed cavity in the clamps, slipping was not a major issue. A similar slipping issue may arise also from local plastic deformation. If the loading force is greater than the force required to cause local plastic deformation along the clamping surface, then the surface with shear away from the part and useful data is not obtained. This issue was counteracted by ensuring a significant length of the sample was fixtured in the clamps.
Limits of Testing
One limit to testing that arose was due to low infill density. Parts with less than 25% infill were determined to be too weak in the radial direction to be clamped securely into the Instron. Attempting to clamp these parts resulted in crushed components that could no longer be loaded in the axial direction. There was no upper limit on infill density lower than 100%. No such limits were reached regarding orientation or material type.
In the KISSlicer software, infill density can be set from 0% (hollow) to 100% (fully solid). However, this density can only be set to several predetermined densities. For this reason only data for
Chapter 4
Analysis of Loaded Samples
Angular Dependency of Response
The tensile samples followed the typical loading response with failure occurring in different regions. First, a linear elastic region was observed. As loading continued to increase, samples entered the plastic deformation region. Several samples continued past the point of ultimate tensile strength and deformed via necking until failure. Samples were characterized by the region in which failure occurred. Figure 4-1 and Figure 4-2 show the fracture planes for typical samples.
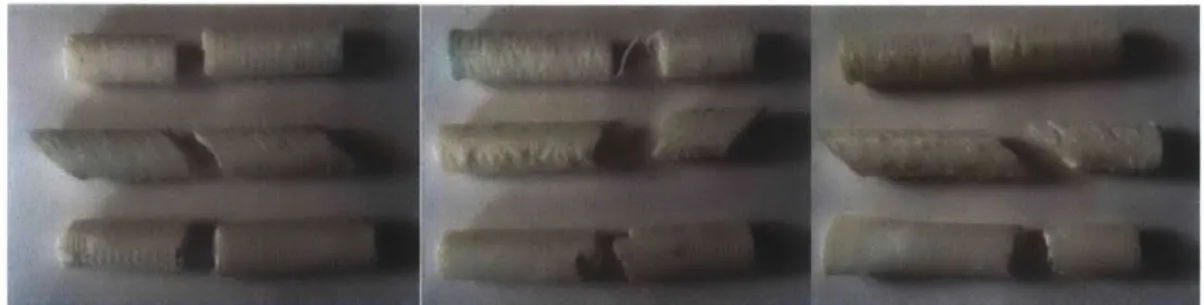
Figure 4-1. Fracture Planes of ABS Samples. ABS samples loaded in tension exhibited the above failure
modes. From left to right the infill densities are 100%, 50%, 25%. Samples printed with layers perpendicular to the loading (top-most sample in each photo) failed through delamination of printed layers. Delamination almost always occurred in the elastic region of the samples. Samples printed at an angle of 450 to the loading (center sample in each photo) failed through a combination of delamination and ductile fracture. Samples printed with loading parallel to the direction of the layers (bottom sample in each photo) failed through ductile failure.
Figure 4-2. Fracture Planes of PLA Samples. PLA samples loaded in tension showed the above failure modes. From left to right the infill densities are 100%, 50%, and 25%. Samples printed with layers perpendicular to the loading (top-most sample in each photo) failed through delamination of printed layers. Delamination occurred in the elastic and plastic regions when loading these samples. Samples printed at an angle of 450 to the loading (center sample in each photo) failed through a combination of delamination and brittle fracture. Samples printed with loading parallel to the direction of the layers
The loading response of the part was found to be dependent on the angle of printing. Samples loaded with the layers perpendicular to the loading most often failed through delamination, as the force of the Instron overcame the cohesive force between layers. Samples loaded at 450 failed through a combination of delamination and ductile or brittle fracture. Samples loaded with the force along the layers failed through either brittle or ductile fracture. Samples made from ABS failed through ductile fracture while PLA samples failed through brittle fracture.
Effective Strain and Effective Stress
Although the samples are not homogeneous materials, it is useful to model the response of these parts with effective strains and effective stresses. The effective strain of the part is equal to the true strain as determined by the initial length and displacement of the sample under loading. The effective stress is given as the force divided by the total cross-sectional area.
Characterizing Failure Modes
Failure occurred in four characteristic modes. First, ductile fracture in which necking occurs was observed for some samples. Necking occurs when parts fracture after ultimate tensile strength is reached. Secondly, brittle fracture occurred for some samples, as observed by failure occurring at the ultimate tensile strength of the part. Failure through delamination occurred. Failure through delamination occurs when the tensile force overcomes the cohesive force between layers. Delamination occurred in both the elastic region and the plastic region while loading, depending on the sample.
Failure through delamination in the elastic region occurred for parts printed with the layers perpendicular or slanted at 450 to the loading force. These parts are characterized by deviation from the expected loading curve in the elastic loading region. For these parts, one or several layers will partially delaminate. However, it will remain partially attached in some areas. This is why there is irregular data in the loading curve of Figure 4-3 after initial failure at -0.4 mm. The force that remains is a result of the layers that are partially attached before complete failure.
On the delaminated surfaces in Figure 4-3 there is little to no localized discoloration due to plastic deformation. The cohesive forces between layers for these parts are less than the load required to plastically yield the sample.
Failure through delamination in the plastic region occurred only for PLA samples printed at
100% infill density. These parts are characterized by failure occurring after plastic yield, but before the
ultimate tensile strength. For these parts, the cohesive force between layers is greater than the loading required to cause the part to yield but less than the ultimate tensile strength of the part.
The delaminated surfaces in Figure 4-4 show some localized discoloration indicating plastic yield of the part. A layer has sheared apart on the failure surface of each of the samples in this category.
Failure through brittle fracture was the next observed failure mode. Parts failing through brittle fracture included PLA samples loaded along the direction of the layers. These parts were loaded until
they failed at their ultimate tensile strength without necking. An effective strain and effective stress were used instead of true strain and true stress because the printed parts are not homogeneous materials. Figure 4-5 contains the loading curve and fracture surfaces for brittle failure.
Failure Through Delamination (Elastic)
450 -400 -350 -300 -,250 -200 -0 150 -100 -50
-Si
0.2 0.4 0.6 0.8 Displac 1 1.2 1.4 1.6 ement (mm)Figure 4-3. Loading Curve and Fracture Surfaces Exhibiting Delamination in the Elastic Region. Samples printed with the loading perpendicular to the layers made from PLA of 50% infill density failed through delamination in the elastic region. From 0 mm to 0.2 mm of displacement, the Instron is removing its backlash. Samples characterized by delamination in the elastic region are recognizable by sudden failure rather than a smooth transition into the plastic region.
0
(U 0. In a, 4.. a, 4.. U a, LU 25000 20000 15000 10000 5000 0
Failure Through Delamination (Plastic)
4
0 0.01 0.02 0.03 0.04
Effective Strain (mm/mm)
0.05
Figure 4-4. Loading Curve and Fracture Surfaces Exhibiting Delamination in the Plastic Region. Delamination occurred in the plastic region for PLA samples with 100% infill density for samples where loading was perpendicular to the layers. These parts failed after plastic yield (determined by 0.2% offset) but before reaching the ultimate tensile strength of the plastic. The line in the plot above represents the 0.2% offset used to find the yield strength of these samples. Failure occurred at the end of the blue curve.
The fracture surfaces on the PLA samples in Figure 4-5 have discoloration indicating definite plastic deformation of the part. Most of this discoloration appears to be concentrated on the shell of the part. By pulling along the printed strands, the material properties become more significant than the effects of delamination.
Brittle Fracture
18 -16 2 14 -CL 12 - 10- 8-4 -U 2-0 0 0.05 0.1 0.15 0.2 0.25 0.3 Effective Strain (mm/mm)Figure 4-5. Loading Curve and Fracture Surfaces Exhibiting Brittle Fracture. Samples printed from PLA at 50% infill density failed through brittle fracture. These parts failed at the ultimate tensile strength without necking beforehand. The horizontal line at "16 MPa shows the effective ultimate tensile
Failure through ductile fracture was the final observed failure mode. Using an effective strain and effective stress, samples were observed to reach the effective ultimate tensile strength and then continue to deform through necking. ABS samples loaded with layers aligned along the loading force failed through ductile fracture. These samples were also found to have the greatest effective strains at failure. The fracture surfaces in Figure 4-6 show definite discoloration across its entirety.
Ductile Fracture
40 35 30 25 - 20S15 -10 5-0
4l
0
0.05 0.1 0.15 0.2 0.25 0.3 0.35 0.4 Effective Strain (mm/mm)Figure 4-6. Loading Curve and Fracture Surfaces Exhibiting Ductile Fracture. Samples printed from ABS with 100% infill density and loading aligned with the layers failed through ductile fracture. These samples failed beyond the ultimate tensile strength of the part and experienced necking before failure. The line at -35 MPa in the plot above shows the effective ultimate tensile strength. The sample is observed to reach the effective UTS and then decrease in stress as necking occurs.
Structural Response Metrics
Several response metrics of the printed samples are desired. The peak load, stiffness, yield load, and effective strain at failure were determined from the Instron data collected as applicable.
Figure 4-7. Categorization of Parts. The above diagram shows the naming scheme for parts printed and
tested in this research. "Along" type samples are loaded along the direction of the layers. "Slant" type samples are loaded at a 450 angle to the layers. "Across" type samples are loaded perpendicular to the layers. Blue lines represent the direction of the printed layers in the part. The red arrows represent the load applied by the Instron during tensile testing.
Peak load was found to increase with increasing infill density. Additionally, parts loaded along the direction of the layers had the highest peak load while parts loaded perpendicular to the direction of the layers consistently had the lowest peak loading. Parts printed at a slant had a peak between the across and along samples. The peak loads of ABS samples increased linearly with infill density whereas the peak loads of PLA samples increased exponentially with infill density. These results are shown in Figure 4-8.
Stiffness was also found to increase with infill density. The relationship between stiffness and infill density was found to linear in all cases. Samples loaded along the layers had slightly greater stiffness than those loaded perpendicularly or 450 to the layers. For ABS this trend is true for all infill densities. For PLA samples this trend is true until 100% infill density at which point the stiffnesses converge. These results are shown in Figure 4-9.
3500 3000 2500 2000 0 1500 1000 -500 -0 0 4500 4000 3500 3000 2500 2000 1500 1000 500 0 0
Infill Density vs. Peak Load of ABS Samples
A A 20 40 60 Infill Density (%) 80 100 Across Along Slant 120
Infill Density vs. Peak Load of PLA Samples
A 20 40 60 80 100 Infill Density (%) Across Along Slant 120
Figure 4-8. Infill Density vs. Peak Loading of PLA and ABS Samples. Peak loading of samples was
observed to follow a linear trend for ABS samples and an exponential trend with PLA samples when infill was increased. Parts printed with the printing angle along the loading direction had the highest peak loading followed by samples with a printing angle slanted at 450 to the loading and finally samples with loading applied perpendicularly to the printing angle.
z
Yield load was determined as applicable. The yield load is the loading at which plastic deformation of the sample occurred. This was determined by determining 0.2% offset yield from effective stress and effective strain data. Parts that delaminated in the elastic region did not have a yield load. Most of the across samples and slant samples failed before the yield load, especially for infill densities less than 100%.
4500 -
Infill Density vs. Stiffness of AB!Samples
4000 -3500 -E 3000 -E Z 2500 -*Across 5 2000 EAlong - 1500 A Slant 1000 500-o 20 40 60 80 100 120 Infill Density
5000
Infill Density vs. Stiffness of PLA Samples
4500 -4000 -3500 -3000 -2500 - *Across 2000 - E Along / 1500 ~ A Slant 1000 500 -0 20 40 60 80 100 120 Infill Density (%)
Figure 4-9. Infill Density vs. Stiffness of ABS and PLA Samples. The loading curves of each sample were
analyzed for stiffness. Parts printed with the loading aligned along the layers are typically, but not always, stiffer than the other samples. The stiffnesses of PLA samples converge as infill approaches
Yield load follows a linear relationship with infill density for ABS along samples. A trend resembling a sine curve was observed for PLA along samples, but without higher resolution for infill density this trend cannot be determined conclusively. The only across and slant samples that yielded were printed at 100% infill density. These results are shown in Figure 4-10.
2500
]
Infill Density vs. Yield Load of ABS Samples
2000 -1500 -'a 0 0 1000 500 -
h
* Across U Along A Slant 40 60 Infill Density (%) 80 100Infill Density vs. Load at Yield of PLA Samples
I
I
U
U 60 Infill Density (%) 80 100 120Figure 4-10. Infill Density vs. Load at Yield of ABS and PLA Samples. Loading curves for each sample were analyzed for the load at plastic yield as determined by 0.2% offset. ABS samples loaded along the direction of the layers showed a linear trend of yield load increasing with infill density. The PLA samples exhibited a more erratic set of data. Yield loads were not determined for parts that failed through delamination of layers in the elastic region. Parts printed in the slant or across configuration typically delaminated before yielding.
0 0 20 120 "1a (U *0 1600 -1400 1200 -1000 800 -600 -400 -200 0-0
U
20 * Across U Along A Slant 40Finally, effective strain at failure was determined for each sample. The relationship of effective strain at failure to infill density is best characterized by second order polynomial curves for both ABS and
PLA. For the strain to infill relationship, the trend for ABS along samples and all PLA samples followed a
U-shaped curve. Along samples printed at 25% infill density elongated the most for ABS while along samples printed at 100% infill density elongated the most for PLA. These results are shown below in Figure 4-11.
1.2
Infill Density vs. Effective Failure Strain of
E 1
"
ABS Samples
E E 0.8 --U U0.6
- * Across 2 Along '00.4 -A Slant 0.201
0 20 40 60 80 100 120 Infill Density (%) 0.6-:
iInfill
Density
vs.
Effective Strain at Failure of
0.s
PLA Samples
T 0.4 -L 0.3 - *Across C Along 0.2 -Ln A Slant 0.1 0 20 40 60 80 100 120 Infill Density(%Figure 4-11. Infill Density vs. Effective Strain at Failure of ABS and PLA Samples. Effective strain was found by normalizing displacements to the initial length of the loading zone of each sample. Very large strains were observed for PLA and ABS samples printed at 25% and 100% infill. Parts printed at 50% infill
saw the smallest effective strains at fracture. Parts printed with the loading along the layers displaced the most before failure, failing through ductile fracture for ABS and brittle fracture for PLA.
Conclusions
Parts generated through Fused Filament Fabrication were found to exhibit a variety of behaviors depending on variables including material type, infill density, and the angle of the layers relative to the loading. Printed samples were made from ABS or PLA plastic. Infill densities were varied from 25% to
100%. The angle of the layers relative to loading was tested at 00, 450, and 900.
Loading response curves were analyzed to find the peak load, stiffness, load at plastic yield, and effective strain at failure. Samples printed from PLA plastic were found to have greater stiffness and a greater yield load than ABS parts. Samples printed from ABS experienced greater elongation before failure. Effective strain at failure was generally greater for ABS samples. The greatest elongation at failure occurred at 25% infill for ABS sample and at 100% infill for PLA samples. Samples printed at 50% infill density had the lowest elongation at failure.
Failure modes were characterized as delamination in the elastic region, delamination in the plastic region, brittle fracture, and ductile fracture. Samples printed from PLA failed through a combination of delamination of layers and brittle fracture. Samples printed from ABS failed through a combination of delamination of layers and ductile fracture. Parts printed in the across configuration failed most often through delamination whereas parts printed in the along configuration failed through brittle or ductile fracture depending on material type. Samples printed in the slant configuration failed via delamination and brittle or ductile fracture.
Samples loaded along the printed layers with 100% infill density displayed the most favorable mechanical properties including peak load and stiffness. Samples loaded perpendicular or at an angle to the printed layers typically failed at a smaller load and displacement. Samples printed at less than 100% infill also tended to fail sooner.
Many more variable exist to be researched that may affect the mechanical properties of printed samples. Future work may include testing the effects of dyes, post-process treatments, varying layer height and width, new materials, varying skin thickness, different infill patterns, varying printing speed, and different printers in addition to many more factors in the printing process. Additionally, investigating other structural metrics such as compressive loading response, shear response, and torsional response can be the subject of future work.
Appendix A
KISSlicer Parameters
ABS Settings temperatureC=215 keep warmC=150 firstlayerC=215 bedC=90 secperC_perC=O flow_minmm3_per s=o.o1 flowmax_mm3_per s=1o destringsuck=4 destringprime=4 destringminmm=1 destringtrigger mm=5 destringspeedmmper s=15 Z_lift_mm=0.5 minlayer time s=10 wipe mm=10 flowratetweak=1 fiberdiamm=1.76 PLA Settings temperatureC=180 keep warmC=150 firstlayerC=180 bedC=60 secperC_perC=O flow_min_mm3_per s=0.01 flowmaxmm3_per s=10 destringsuck=4 destringprime=4 destringminmm=1 destringtrigger mm=5 destringspeed mmper s=15 Z_lift_mm=0.5 minlayer time s=10 wipe mm=10 flowratetweak=1 fiberdiamm=1.76 Printer Settings z_speedmmpers=3.5 z_settle_mm=0.25 bedsize x mm=150bedsize_y_mm=150 bedsize_z_mm=150 bedoffset_x_mm=75 bedoffset_y_mm=75 bedoffset_z_mm=O bedroughness_mm=0.25 travelspeedmmper s=120 firstlayer speedmmpers=50 dmax per layer mmper_s=30 xyaccelmm_per_s_per-s=1500 lo speedperimmmpers=20 lo-speed_solidmmper s=40 lo speedsparsemmper_s=35 hi speedperimmmpers=70 hi speed_solidmmper s=80 hi speedsparsemmpers=75 solidloopoverlap_fraction=0.5 Style Settings layerthicknessmm=0.25 extrusionwidthmm=0.3 numloops=3 skin_thicknessmm=0.72 infillextrusionwidth=0.3 infil density denominator=2 stackedlayers=1 usedestring=1 usewipe=1 loops_insideout=1 infillstoct_rnd=1 insetsurface_xymm=0.15 seam_jitter-degrees=360 seamdepth scaler=0.6
Appendix B
Fracture Surfaces
Figure B-1. Fracture Surfaces of Loaded PLA samples at 100% Infill. From top to bottom, the picture at
left contains an across sample, a slant sample, and an along sample. On the right hand side are fracture surfaces of across samples, slant samples, and along samples from left to right respectively.
Figure B-2. Fracture Surfaces of Loaded PLA samples at 50% Infill. From top to bottom, the picture at left contains an across sample, a slant sample, and an along sample. On the right hand side are fracture surfaces of across samples, slant samples, and along samples from left to right respectively.
Figure B-3. Fracture Surfaces of Loaded PLA samples at 25% Infill. From top to bottom, the picture at
left contains an across sample, a slant sample, and an along sample. On the right hand side are fracture surfaces of across samples, slant samples, and along samples from left to right respectively.
Figure B-4. Fracture Surfaces of Loaded ABS samples at 100% Infill. From top to bottom, the picture at
left contains an across sample, a slant sample, and an along sample. On the right hand side are fracture surfaces of across samples, slant samples, and along samples from left to right respectively.
Figure B-5. Fracture Surfaces of Loaded ABS samples at 50% Infill. From top to bottom, the picture at
left contains an across sample, a slant sample, and an along sample. On the right hand side are fracture surfaces of across samples, slant samples, and along samples from left to right respectively.
Figure B-6. Fracture Surfaces of Loaded ABS samples at 25% Infill. From top to bottom, the picture at
left contains an across sample, a slant sample, and an along sample. On the right hand side are fracture surfaces of across samples, slant samples, and along samples from left to right respectively.
Bibliography
Hart, John. "FDM/Extrusion 1." 2.S998 Additive Manufacturing. MIT 3-270. 11 February 2014. Lecture Hart, John. "Optical/SLA 1." 2.5998 Additive Manufacturing. MIT 3-270. 25 February 2014. Lecture Hart, John. "Powder/SLS 1." 2.S998 Additive Manufacturing. MIT 3-270. 11 March 2014. Lecture