Publisher’s version / Version de l'éditeur:
Vous avez des questions? Nous pouvons vous aider. Pour communiquer directement avec un auteur, consultez la première page de la revue dans laquelle son article a été publié afin de trouver ses coordonnées. Si vous n’arrivez Questions? Contact the NRC Publications Archive team at
[email protected]. If you wish to email the authors directly, please see the first page of the publication for their contact information.
https://publications-cnrc.canada.ca/fra/droits
L’accès à ce site Web et l’utilisation de son contenu sont assujettis aux conditions présentées dans le site LISEZ CES CONDITIONS ATTENTIVEMENT AVANT D’UTILISER CE SITE WEB.
NPL Workshop on Recent Advances in Calorimetric Absrobed Dose Standards.
NPL Report CIRM 42, pp. 90-102, 2000-12-01
READ THESE TERMS AND CONDITIONS CAREFULLY BEFORE USING THIS WEBSITE.
https://nrc-publications.canada.ca/eng/copyright
NRC Publications Archive Record / Notice des Archives des publications du CNRC :
https://nrc-publications.canada.ca/eng/view/object/?id=3e2723d4-adcc-43e5-a78a-fe7d5c334469
https://publications-cnrc.canada.ca/fra/voir/objet/?id=3e2723d4-adcc-43e5-a78a-fe7d5c334469
Archives des publications du CNRC
This publication could be one of several versions: author’s original, accepted manuscript or the publisher’s version. / La version de cette publication peut être l’une des suivantes : la version prépublication de l’auteur, la version acceptée du manuscrit ou la version de l’éditeur.
Access and use of this website and the material on it are subject to the Terms and Conditions set forth at
The NRC sealed water calorimeter: correction factors and performance
The NRC Sealed Water Calorimeter: Correction Factors and Performance
C.K. Ross, J.P. Seuntjens
*, N.V. Klassen and K.R. Shortt
Ionizing Radiation Standards, Institute for National Measurement Standards, National Research Council Ottawa, Ontario K1A 0R6 Canada
Abstract
1The NRC sealed water calorimeter is based on a design first proposed by Domen at the National Institute of Standards and Technology. Thermistor probes are used to measure the temperature increase at a point in a large water phantom due to energy absorbed from the radiation field. A sealed glass vessel is used to control the water quality near the measuring point. To eliminate convective heat transfer, the calorimeter is operated at 4o
C. Apart from correction factors, the absorbed dose to water is obtained from the measured temperature change multiplied by the known specific heat of water. However, there are a number of corrections and perturbations which must be considered. Most of these factors are small and can be estimated accurately. The largest uncertainty (0.3%) is contributed by the heat defect, partly because it depends on knowledge of the radiation chemistry of water, and partly because of the difficulty of preparing high purity aqueous systems. The NRC calorimeter has been used to establish the absorbed dose in a 60
Co beam and several high energy x-ray beams with an estimated standard uncertainty of about 0.5%. The performance of the calorimeter, as well as some of the implications of the results obtained, will be reviewed.
I. I
NTRODUCTIONThe absorbed dose to water under reference conditions is the starting point for calculating the absorbed dose to the patient during radiation therapy. Usually, the absorbed dose to water is established using an ion chamber for which an absorbed dose calibration factor has been established. One way of establishing the chamber calibration factor is via cavity theory combined with a 60
Co air kerma calibration factor [1], [2]. A more direct approach is to calibrate the chamber against an absolute standard for the absorbed dose to water [3].
The most common way of establishing a standard for absorbed dose is via calorimetry, and several graphite calorimeters have been built for this purpose [4], [5], [6]. Although the graphite calorimeter is itself an excellent device, it gives the absorbed dose to graphite, not to water. Thus, a conversion procedure is necessary in order to obtain the dose to water. In an effort to circumvent this problem, Domen [7]
showed that it was possible to directly measure the radiation-induced temperature rise in a large vessel of stagnant water. Unfortunately, the absorbed dose measured in this way was 3 to 4% higher than expected, and later work showed that the most likely reason for the discrepancy was an unexpected heat defect due to impurities in the water (for a review of the literature, see [8]). More recent work indicates that about 1% of the discrepancy may have been due to convective heat transfer (see the paper by Seuntjens et al in these Proceedings).
Domen [9] then modified the design of his calorimeter by introducing a small sealed glass vessel which contained high purity water. Extensive measurements with this arrangement using 60Co γ-rays gave results which were in good agreement
with the absorbed dose obtained using graphite calorimetry. Seuntjens et al [10], [11] further modified the design to permit the calorimeter to be operated at 4o
C, thus suppressing the effects of convection. Apart from modest refinements, the NRC sealed water calorimeter follows the design developed by Seuntjens et al.
Early work on water calorimetry at NRC was based on a stirred water calorimeter [12]. This design was well suited for measuring the relative heat defect of various aqueous solutions and, with further refinements, the calorimeter was used to measure εG for the Fricke dosimeter [13]. However, an
accurate determination of the effect of the heat transferred from material close to, and in contact with, the water proved difficult and contributed significantly to the overall uncertainty. We concluded that a sealed water calorimeter would lead to a smaller uncertainty on the absorbed dose to water, would be more convenient for establishing the dose at different beam qualities and would be better suited for measurements in electron beams.
This report describes the main characteristics of the NRC sealed water calorimeter and provides details of the various correction factors required for its use. The calorimeter has been used to establish the dose for 60Co γ-rays and high energy
x-ray beams, and some of the implications of these measurements will be discussed.
II. T
HENRC
S
EALEDW
ATERC
ALORIMETERA. Overview
The main elements of the calorimeter are shown schematically in Figure 1. Note that it is intended for use in radiation beams that are directed horizontally. The water is
*
Present address:
Medical Physics Unit, McGill University, Montreal General Hospital, Montreal, Quebec, Canada, H3G 1A4.
Figure 1: Side view of the sealed water calorimeter. The drawing is not to scale, but the sides of the outer box are approximately 85 cm long. The principal elements of the calorimeter are labelled on the drawing. Note that fluid is only allowed to flow through the heat exchanger in the water when a significant change in operating temperature is required.
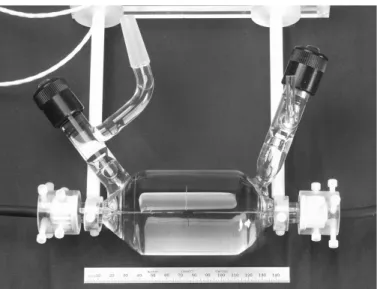
Figure 2 : Glass detection vessel No. 3, with the thermistor probes aligned in the centre. The thick white line in the upper left of the photograph is part of the thermistor signal cable after it has emerged from the waterproof tubing.
Figure 3: Variation of the vessel wall thickness along the length of the cylindrical portion. The measurements were done using a liquid displacement technique, and thus represent the average wall thickness at that position. Vessel #1 was formed using glass blowing techniques, while the cylindrical portion of vessel #3 was formed by grinding glass tubing to the required dimensions. held in a Lucite tank, 30 cm on each side. The exterior walls of
the tank are insulated with 5 cm thick Styrofoam. A magnetic stirrer for agitating the water is built into the bottom of the tank. The lid on the tank contains several holes through which calibrated platinum resistor probes are inserted to measure the water temperature. The lid also ensures a motion-free air space above the water surface. The window of the tank through which the radiation field enters is machined down to 3 mm over an area of 12 cm by 12 cm. The window is thermally isolated with a removable, 5 cm thick Styrofoam plate. The calorimeter phantom is enclosed in an insulated wooden box, 85 cm on each side, in which the temperature is stabilized using fans and a heat exchanger. The cooling fluid can also be made to pass through a heat exchanger in the water tank so as to accelerate the process of changing the operating temperature of the water in the calorimeter. The calorimeter is designed for operation at any temperature from 0oC to 25oC. It typically
takes 3 to 4 hours to bring the temperature to 4o
C when starting from room temperature. The bath controlling the temperature of the liquid in the heat exchangers is stable to ± 0.1o
C. An additional calibrated platinum resistor probe monitors the temperature of the air circulating around the calorimeter. There are temperature variations of up to 1o
C in the air space around the calorimeter, but the temperature at a given location is stable to a few millidegrees.
B. Glass Detection Vessel
The temperature increase due to irradiation is measured in the centre of a cylindrical glass vessel which is designed to isolate a small volume of high purity water from the water in the rest of the phantom. A typical detection vessel is shown in Figure 2. It consists of a central cylindrical portion, about 75 mm long, which is attached to conical end pieces. The overall length of the assembly is about 14 cm. Threaded fittings on the end pieces hold the thermistor probes in place.
The vessel is mounted in the water tank on an adjustable slide so that its position along the beam axis can be varied.
The cylindrical portion of the first vessel we used was formed using glass blowing techniques. This approach led to considerable variation in the wall thickness (see figure 3), and the vessel was not perfectly round. Variation in the wall thickness leads to uncertainties in the wall correction factors, and lack of roundness makes it difficult to establish the probe position within the vessel. This vessel is referred to as #1, and it has an outside diameter of approximately 67 mm.
Later vessels have been formed by first grinding glass tubing to a wall thickness of 1 mm. Because precision grinding
Figure 4: Drawing showing the details of the thermistor probes. techniques are used, similar to those used for making lenses,
the wall thickness is uniform and the vessels closely circular. The conical end pieces are attached to the central cylindrical section using glass blowing techniques. The first vessel constructed in this way was labelled #3, and it has an outside diameter of 61.53 mm. Its wall thickness as a function of position is shown in Figure 3.
Before the ends were attached to the cylindrical section, an indexing machine was used to mark the circumference at 90o
intervals. Ceramic decal lines were placed on each mark and fixed in place by annealing the cylinders at 560o
C. These lines have a width of 0.4 mm and are used for aligning the probes within the vessel, and the vessel within the phantom. Originally, the appropriate positioning of the probe ends with respect to lines on the outside of the vessel was done using a telescope. However, we have found that probe alignment with respect to the decals can be done adequately by eye, certainly within ± 0.2 mm.
A glass valve is attached to either end of the vessel to allow it to be filled, drained and bubbled with various gases. Upon sealing off the vessel, care is taken to be sure a small gas bubble is left behind. This bubble allows the water to expand and contract between 4o
C and 22o
C without breaking the vessel.
When preparing for measurements, the vessel is first filled with high purity water, and then bubbled for one to two hours with H2, H2 and O2, N2 or Ar gases, depending on the aqueous
system to be used. Then the probe position is adjusted and the vessel is suspended in the water phantom. Calorimetric measurements can be started typically three hours later if the water in the tank is at operating temperature and the bubbling is done at room temperature.
C. Thermistor Probes
The glass envelope for each thermistor temperature probe is constructed from Pyrex tubing having a diameter of 8 mm and a wall thickness of 1 mm. The tubing is heated and pulled down to an outside diameter of 0.5 to 0.6 mm over a length of 4 cm. The inside diameter is checked using 0.3 mm diameter wire. Probes of acceptable dimensions are then flame-sealed on the small end and tested for leaks using a helium leak detector. We estimate the thickness of the glass wall at the thermistor bead to be 0.06 mm to 0.11 mm. The 0.03 mm diameter wires of the Thermometrics thermistors (0.25 mm in diameter) are soldered to 0.1 mm diameter copper extension wires, and one wire of the pair is inserted into 0.2 mm diameter microtubing to avoid electrical shorts. The bead and lead assembly is then slid into the glass envelope. Using a piece of microtubing, UV-curable adhesive is injected into the end of the probe to glue the thermistor bead to the glass. A Delrin rod is fitted into the large end of the glass probe to act as a strain relief for the screened cable to which the 0.1 mm copper extension wires are soldered. Waterproofing is achieved by passing the signal cable through a latex rubber
tube which is stretched over the end of the glass tubing to form a water-tight seal. The latex tube is sufficiently long that the open end is outside the water phantom. The details of the probe construction are shown in Figure 4.
Before use, the thermistor probes must be calibrated. Our probes are calibrated against platinum resistance probes (RTDs) which in turn are calibrated against NRC temperature standards. Details of the calibration procedure, along with typical calibration data, are described in a separate paper by Medin et al in these Proceedings.
D. Electronics
The circuit to measure the change in thermistor resistance is based on a four-arm AC bridge, operating at a frequency of about 5 Hz. The output voltage from the bridge is measured using a commercial lock-in amplifier. The bridge circuit, as well as the rest of the electronics used with the calorimeter, are shown in Figure 5.
The platinum resistor probes, which are used for temperature monitoring, are connected to a remotely controlled scanning system (based on a Keithley 2001 multimeter equipped with a scanner card). The bridge balancing resistor, the lock-in amplifier and the multimeter are all connected to a PC using a GPIB interface card, thus allowing each to be controlled and read out remotely. The software allows the bridge to be balanced, the characteristics of the lock-in amplifier to be changed, the acquisition of data
Figure 5: Schematic drawing of the electronics used with the water calorimeter. The lock-in amplifier, the decade box and the 4-wire ohmmeter can all be controlled and read out remotely. The stirrer, valve system and bath are also remotely controlled.
w w w, D =c ◊ DT (1) w w w t c v p dd ρ HD 1 , 1 D T c k k k k k k k = D ◊ ◊ ◊ ◊ ◊ ◊ ◊ ◊ - (2)
Figure 6: Schematic of the setup used to measure the transient response of thermistors to radiation. The same temperature-regulated water flowed over both thermistor probes. The whole assembly was insulated from the environment using Styrofoam sheets. One thermistor was irradiated with a high dose rate (150 Gy/min) electron beam and the difference in response of the two thermistors was measured. The bridge circuit on the right shows how the difference signal was obtained by placing the thermistors in opposite arms of a Wheatstone bridge. according to a preselected scheme and the calculation of the
extrapolation curves and the dose. In addition, the stirrer, valve system and bath can be remotely controlled.
The drawing in Figure 5 accurately reflects the configuration of the bridge at 22o
C, when each thermistor has a resistance of approximately 5 kΩ. At 4o
C, the thermistor resistance increases to approximately 10 kΩ, so the 10 kΩ decade box does not have enough range to permit the bridge to be balanced. To compensate, an extra 10 kΩ resistor is added in series with the decade box.
The response of the bridge per unit change in thermistor resistance is obtained by changing the resistance of the decade box by a known amount. A detailed electrical model of the bridge, including the impedances imposed by the lock-in amplifier, is used to relate the measured response to a change in the decade box to the response expected due to a change in the thermistor resistance. The 10 MΩ input impedance of the lock-in represents a significant loading of the bridge circuit, and its effect is largest when the bridge is asymmetric (4o
C operation). If ignored, it can lead to errors of up to 0.3% in the estimated voltage change per unit change of thermistor resistance.
III. D
ETERMINATION OFA
BSORBEDD
OSE The raw data obtained from a calorimeter run consists of the measured bridge voltage as a function of time. Changes in bridge voltage can be converted to changes in thermistor resistance, and these in turn can be converted to changes in temperature using the measured thermistor sensitivity. Ignoring correction factors, the absorbed dose to water, Dw isgiven by
where
)
Tw is the measured temperature increase and cw is thespecific heat capacity of water. If the various correction factors are included, the equation for Dw becomes
where kt accounts for any transient effects of the radiation on
the thermistor response, kc and kv are corrections for
conductive and convective heat transfer, respectively, kp is a
correction for perturbations of the radiation field by the glass vessel or probes, kdd is a correction for the non-uniformity of
the lateral dose profile, kD accounts for the change of the density of water with temperature and kHD is the heat defect.
The following sections summarize our knowledge of the various correction factors.
A. Transient Thermistor Response to Radiation
Domen [9] has reported on results obtained at NIST which show that thermistors can tolerate doses of several MGy with no adverse effects. Calorimetric measurements of the absorbed dose for radiation therapy purposes are unlikely to require doses of more than a few kGy. Thus, we can safely assume that radiation will have no effect on the quiescent behaviour of our thermistor probes.However, there remains the possibility that radiation might induce transient effects which persist for tens of seconds and thus distort the post-irradiation drift curve. To test this possibility, we constructed the apparatus shown in Figure 6. Two closely matched thermistors were placed in a flow of temperature-regulated water. The thermistors were mounted in opposite arms of a Wheatstone bridge so that the output
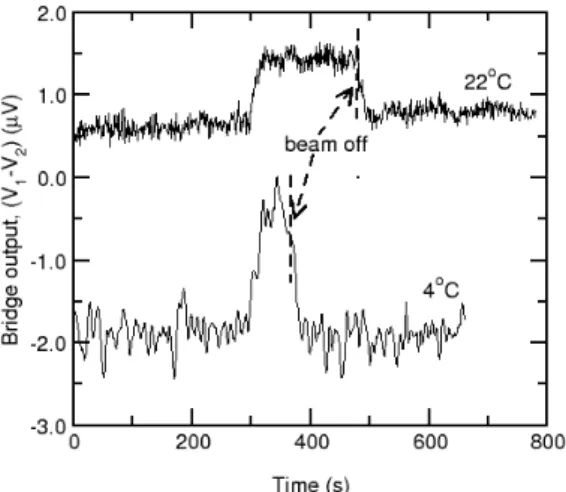
Figure 7: Measured transient response of a thermistor to radiation. The electron beam dose rate was approximately 150 Gy/min, and measurements were carried out at both 4oC and 22 oC. A 1 µV change
in bridge output corresponds to a temperature change of approximately 130 µK, and in 100 s the signal would have been about 460 µV if the water had been stagnant.
Figure 8: Calculated excess temperature at the end of each thermistor probe, caused by heat conduction from the probes and from the vessel wall. The results apply for vessels with dimensions similar to those of vessel #1. The decrease in temperature immediately after irradiation is due to heat flowing away from the probes. The increase in excess temperature several minutes after the irradiation is due to heat produced in the vessel wall and transported to the point of measurement. voltage was close to zero when water was flowing over the
probes. A collimated electron beam was used to irradiate one of the thermistors while the second remained in a field-free region. Because of the flowing water, both probes continued to see approximately the same temperature, and any transient effects after the beam was turned off would be due to radiation-induced changes in the thermistor response. Measurements were carried out at 4o
C and 22 o
C.
The results are summarized in Figure 7. The dose rate from the electron beam was approximately 150 Gy/min, which would give a temperature rise of about 60 mK in 100 s in stagnant water. This would correspond to a signal of approximately 460 µV in Figure 7. The radiation-induced signal when the beam is on amounts to 1 or 2 µV and is due to local heating of the water and probe. However, any transient effects are over in less than 20 s after the beam is turned off. Any other offsets or slope changes are less than 0.2 µV when extrapolated to mid-run, and this is less than 0.05% of the signal due to the absorbed dose in stagnant water.
Assuming that thermistor response per unit dose is not altered by dose or dose rate, these conclusions should apply to irradiations at our standard dose rate of about 1.5 Gy/min. Thus, we do not use the first 20 s after the irradiation is stopped in extrapolating to mid-run. Under these conditions, any correction for transient thermistor response should be less than 0.05% and we take kt to be unity in equation (2).
B. Conductive Heat Transfer
Conductive heat losses in a large water calorimeter may result from two sources. Firstly, because the heat capacity of glass is about one-sixth that of water, the radiation-induced temperature rise in the glass would be about six times that in
water, if it were not that most of the heat generated in the glass is transferred to the water. Secondly, temperature gradients within the water because of non-uniformities in the absorbed dose distribution will lead to conductive heat transfer. We now examine each of these effects in more detail.
To calculate the effect of heat transfer from the glass we use the following simplifying assumptions: the calorimeter is irradiated uniformly; the glass vessel is an infinitely long cylinder; the thermistor bead is located symmetrically at the end of the glass probe; each probe is semi-infinite in length. Under these assumptions, rotational symmetry reduces the problem to two dimensions. This two-dimensional space is divided by an irregular rectangular grid with a high resolution in the neighbourhood of the probe, probe tip and vessel, and a low resolution elsewhere. Heat transfer calculations begin at the start of the irradiation. For every rectangular cell of the grid the transport of heat energy is calculated in discrete time steps. The calculated effect on the temperature at the point of measurement can either be subtracted from the measured signal before the run is analysed, or the run can first be analysed to get an approximate temperature change which is then corrected for the effects of heat conduction. Additional details have been reported by Seuntjens and Palmans [14].
The calculated excess temperature rise in a 60
Co beam, for the NRC geometry and for different irradiation times, is plotted in Figure 8 for vessel dimensions similar to those of vessel #1. The decrease in temperature immediately after the irradiation is caused by excess heat from the probe that is conducted away from the probe axis into the water, while the increase in temperature at later times is due to excess heat from the vessel reaching the probes. Table 1 gives a summary
Table 1.
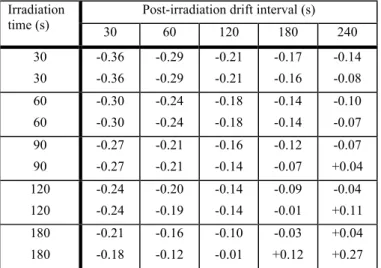
Calculated correction factor, kc expressed as %, on the linear extrapolation to mid-run due to excess heat produced in the end of thermistor probes and in the vessel wall for vessels with dimensions similar to those of vessels #1 and #3. A positive value for the correction means the temperature rise obtained by linear extrapolation should be increased accordingly. Calculations were performed for different irradiation times and for different intervals used to specify the post-irradiation drift curve. The first and second row for each irradiation time is for vessels #1 and #3, respectively. The post-irradiation drift interval starts 20 s after the end of the irradiation.
Post-irradiation drift interval (s) Irradiation time (s) 30 60 120 180 240 30 30 -0.36 -0.36 -0.29 -0.29 -0.21 -0.21 -0.17 -0.16 -0.14 -0.08 60 60 -0.30 -0.30 -0.24 -0.24 -0.18 -0.18 -0.14 -0.14 -0.10 -0.07 90 90 -0.27 -0.27 -0.21 -0.21 -0.16 -0.14 -0.12 -0.07 -0.07 +0.04 120 120 -0.24 -0.24 -0.20 -0.19 -0.14 -0.14 -0.09 -0.01 -0.04 +0.11 180 180 -0.21 -0.18 -0.16 -0.12 -0.10 -0.01 -0.03 +0.12 +0.04 +0.27 Table 2.
Calculated contributions to the excess heat correction. They apply to the case of an irradiation run of 120 s, with 120 s pre- and post-irradiation drifts used to extrapolate to mid-run. A negative value means that the measured temperature rise should be decreased by the indicated percentage.
Energy Glass Depth dose Lateral profile Combined 60 Co -0.133% -0.023% -0.022% -0.178% 10 MV -0.115% -0.007% -0.017% -0.139% 20 MV -0.118% -0.001% +0.035% -0.084% 30 MV -0.121% -0.020% +0.050% -0.091%
Figure 9: Calculated conductive heat-loss correction due to dose gradients in a 15 MeV electron beam as a function of the depth of the measuring point. The peak of the depth dose curve is at about 2.5 cm. The correction was calculated for several irradiation times, as indicated by the different symbols. The series of identical symbols at each depth shows the effect of using different time intervals (30 to 120 s) to characterize the post-irradiation drift.
of calculated values of kc appropriate for 60
Co γ-rays for vessels #1 and #3. For 180 s irradiations with probes of 0.5 mm diameter, corrections of less than 0.2% are calculated for fits of the post-irradiation drift in the range of 30 to 180 s.
For beams of 60Co γ-rays or high energy x-rays, the largest
dose gradients occur in the buildup region or at the edges of the field. If calorimeter measurements are restricted to depths beyond the dose maximum, and if the field size is reasonably large (10 cm by 10 cm or larger), then the effect of conductive heat transfer due to dose nonuniformities is very small [15], [16]. Table 2 summarizes the various contributions to the conductive heat loss correction for photon beams from 60Co
γ-rays to 30 MV x-γ-rays. It is clear that the correction is dominated by heat transfer from the glass vessel.
The dose gradient along the beam axis is much more severe for electron beams than for photon beams, and conductive heat transfer may be a problem. Some initial calculations of the effect of conductive heat transfer in a 15 MeV electron beam are presented in Figure 9. The calculations only account for the effect of the dose gradient along the beam axis. These preliminary results suggest that water calorimetry should also be feasible for high-energy electron beams.
C. Convective Heat Transfer
In addition to heat transfer by conduction, heat transfer by convection can occur in a liquid calorimeter. If the water in the calorimeter is heated nonuniformly, buoyant forces will arise due to local density changes in the gravitational field. These forces may lead to flow within the liquid, and this flow will contribute to heat transport. The flow rate may depend on the absorbed dose and on time, and thus the effective heat transfer coefficient at the point of measurement will not be constant. Under these conditions, the standard approach of extrapolating initial and final drifts to mid-run [17] may not accurately account for convective heat transfer.
Schulz and Weinhous [18] pointed out that one way of avoiding altogether the onset of convection is to operate the calorimeter at 4o
C, because at this temperature the volume expansion coefficient of water is zero. We assume that kv in
equation (2) is unity when our calorimeter is operated at 4o
C. The evidence for convective flow at room temperature and its effect on calorimeter response is described in a paper by Seuntjens et al in these Proceedings.
D. Radiation Field Perturbation
The presence of the calorimeter detection vessel and the glass thermistor probes perturbs to some extent the radiation
Table 3.
Values for the energy-dependent correction factors required in equation 2. Energy kc kp kdd kρ Combined 60 Co 0.9982 1.0021 1.0004 1.0006 1.0013 10 MV 0.9986 1.0026 1.0007 1.0012 1.0031 20 MV 0.9992 1.0009 1.0012 1.0010 1.0023 30 MV 0.9991 0.9994 1.0004 1.0008 0.9997 field when compared to the situation where these objects are absent. We measured the effect of the vessel on the absorbed dose at the measuring point using a PTW-233642 ion chamber. This chamber is small enough to fit inside the glass vessel, and the chamber response was measured with and without the vessel present. The perturbation correction, kp, is taken as the
ratio of the chamber response without the vessel to that with it in place.
For 60Co γ-rays, k
p was measured to be 1.0021 ± 0.0005.
Because 0.9 mm of glass would attenuate the 60
Co beam by about 0.6%, these measurements show that photon attenuation in the glass is partially compensated by the slightly increased dose contribution from scattered photons when the vessel is present. This observation was confirmed by performing a correlated sampling Monte Carlo simulation of the photon transport through the water phantom. By scoring the fluence in a spherical region on the beam axis at the position of the centre of the vessel with the vessel and probes absent and with both materials present, the correction factor was found to be 1.0028 ± 0.0008, in good agreement with the measurements. The measured value of kp at all beam qualities is given in
column 3 of Table 3.
E. Dose Profile Non-Uniformity
The lateral profile of the dose in the x-y plane perpendicular to the beam axis at the measuring point is slightly non-uniform depending on the field size and the source to detector distance. We measured the x-y dose profile using a PTW-M233642 ionization chamber with a cavity volume of 0.125 cm3, and used these data to calculate the
correction factor, kdd, required to obtain the dose at a point on
the beam axis. The correction depends slightly on the spacing between the probe ends. The results are summarized in column 4 of Table 3 for the standard probe spacing of 1 cm.
F. Density of Water
For practical reasons, ion chamber measurements need to be done at room temperature. If the calorimetry measurements are done at 4o
C, a small correction, kD, is necessary to determine the dose at 22oC. Because the density of water
increases by 0.22% as the temperature decreases from 22o
C to 4o
C, there will be more water overlying the measuring point at 4o
C than at 22o
C. Taking the dose gradient for 60
Co to be
5%/cm, the extra attenuation at the calibration depth of 5 cm will be approximately 0.055%, leading to a value for kD of 1.00055.
In order to estimate kD for high energy x-rays, we have taken the depth-dose distribution measured at 22o
C and scaled the depth axis so that x¢=x/ 1.0022. The scaled distribution gives the dose that applies when the water is at 4o
C. The ratio of the 22o
C distribution to the 4o
C distribution, evaluated at the reference depth of 10 cm, gives kD. Values of kD for all beam qualities are given in Table 3.
G. Heat Defect
The use of calorimetry to measure absorbed dose is complicated by the fact that the measured heat energy may not correspond to the energy absorbed from the radiation field. The heat defect is used to quantify the difference between the energy absorbed, Ea, and the energy appearing as heat, Eh, and
it is defined by
The heat defect is positive for endothermic processes, while it is negative if the radiation induces exothermic processes in the calorimeter. For water irradiated by low LET radiation, the heat defect is almost entirely due to radiation-induced chemical reactions [13].
The heat defect can be calculated using the established model for the radiolysis of water. In this model, the ionizing radiation first produces localized clusters of reactive species, called spurs. After about 0.1 µs, the spur products act as if they are homogeneously distributed, and are assigned yields,
Gi, where the subscript, i, identifies the species. The
concentrations of the spur products and other reactive species within the aqueous solution are followed using homogeneous reaction kinetics, where the reactions involved, the rate constants and the values of Gi are obtained from the published
literature on the radiolysis of water. In general, there will be n species which participate in m reactions. The rate constant for reaction i is denoted by ki, and for the aqueous systems we
have studied to date, only first and second order reactions are involved. Mathematically, the problem is equivalent to solving a set of coupled first order differential equations of the form
The concentration of species i is given by Ci, and there are n equations similar to equation (4). The first term in the
equation gives the production rate of species i at 0.1 µs, where ρ is the density of water and D& is the dose rate. The labelling
1 , 2 , 1 , 2 , d d . st nd i i st nd i i i i j i j i k C C j k j k l C C C G D k C k C C t k C k C C r Ø Ø ≠ ≠ = - -+ +
Â
Â
Â
Â
& (4) a h HD a . E E k E -= (3)2 2 2
O-+H O" HO +HO .- (6)
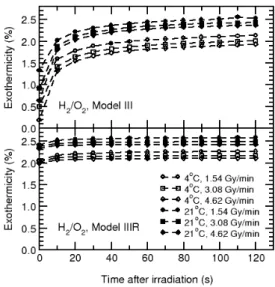
Figure 10: Effect of the irradiation temperature on the calculated heat defect (expressed as percent exothermicity) of water saturated with a 43/57 mixture of H2 and O2 gases. Results are shown for three different
dose rates, but the irradiation time was adjusted so that the same dose was delivered in each case. The calculations for the upper frame were done using Model III [21]. The results shown in the lower frame were obtained using Model IIIR.
“1st
” and “2nd
” on the sums indicate that they are to be taken over all relevant first and second order reactions, respectively, while “CiØ” and “Ci≠” indicate that they are to be taken over all reactions in which species i is being consumed or produced, respectively. Specific values for the initial yields and rate constants can be found in [19].
At a specified time after the irradiation, the yield of species
i can be expressed as Gi¢, where the prime is used to
distinguish it from the yield at 0.1 µs. Then the heat defect is calculated using
where
)
Hi is the heat of formation for species i. Note that canbe negative or positive.
Various computer codes have been developed for solving equation (5). We have made extensive use of the code developed at Atomic Energy of Canada Limited, and referred to as MAKSIMA-CHEMIST [20]. More recently, we have been using the code developed at Harwell in the UK and referred to as FACSIMILE. Both codes give the same results in test cases, but FACSIMILE is more flexible when it comes to calculating secondary output, such as the heat defect.
The computer simulations require values of ki and Gi. Our
most recent set of values is referred to as Model III and was described in [21]. This model is based largely on the data published by Elliot [22]. Elliot has also studied the variation of
ki and Gi with temperature.
The model calculations can be tested experimentally by comparing the relative response of different aqueous systems. Klassen and Ross [19] have identified several aqueous systems which are suitable for water calorimetry. These include pure water, water saturated with H2 gas and water saturated with a
50/50 mixture of H2 and O2 gases.
Because the calorimeter is operated at both 4o
C and 21o
C, the temperature dependence of the heat defect must be estimated. For those systems which attain a steady state after some modest accumulated dose, the situation is quite straightforward. The only concern is whether or not the accumulated dose required to reach steady state (and thus zero heat defect) depends on the temperature. Using data from [22] on the change of Gi and ki with temperature, the heat defect for
H2-saturated and pure water was calculated for a dose rate of
1.5 Gy/min at 4o
C and 21o
C. At both temperatures, the heat defect after an accumulated dose of 3 Gy was less than 0.1%. Furthermore, the reactions go to completion almost immediately after the irradiation stops.
The situation is more complicated for water saturated with H2 and O2 gases. This system is exothermic over a wide range
of accumulated dose, and requires that the heat defect be calculated as a function of dose rate and accumulated dose. Although this might be seen as a significant disadvantage, it is largely outweighed by the fact that earlier work [21] had shown that H2/O2 water is insensitive to impurities. Using
Model III gave the results shown at the top of Figure 10.
These data show that the reactions are taking a long time to go to completion and that the exothermicity is significantly smaller at 4o
C than at 21o
C. We found that our calorimetry data at 4o
C were not consistent with these predictions and this prompted a re-examination of Model III. It was discovered that Elliot had made an error in determining the rate constant for the forward reaction in
We corrected the error in Model III, renamed it IIIR and used it to calculate the results shown at the bottom of Figure 10. Now, the reactions go to completion much more quickly, and the calculated heat defect at 4o
C is in reasonable agreement with calorimetry measurements. The calculations indicate a difference of about 0.3% in the heat defect between 4oC and 21oC. Additional calorimetry measurements should be
able to test this model prediction.
IV. C
ALORIMETERP
ERFORMANCEFigure 11 shows the response of the NRC calorimeter to 20 MV x-rays at a dose rate of about 1.5 Gy/min. The calorimeter was operated at 4o
C, and the power dissipated in each thermistor bead was 6.2 µW. The irradiation time was 120 s, and 120 s of pre- and post-irradiation drift is shown. The resistance change of the thermistors during this irradiation was 0.68 Ω out of a total resistance of about 20,000 Ω. The corresponding temperature change was about 770 µK and the amplitude of the noise signal converted to equivalent temperature amounted to about 10 µK.
Tests for reproducibility of the calorimeter response showed that, for 120 s runs, the sample standard deviation (obtained from a set of 7 to 11 runs) was 0.7 to 0.8%. If the
HD 1 , n i i i k G H = =
Â
¢◊ D (5)Figure 11: Typical water calorimeter run (120 s) obtained using 20 MV x-rays. The total thermistor resistance is about 20,000 Ω and this run represents a change in the resistance of about 0.68 Ω.
Figure 12: Summary of the results obtained using the NRC sealed water calorimeter to measure the absorbed to water for photon beams. Each datum represents the average value obtained from 10 to 15 individual irradiation runs. The solid horizontal lines represent the average value of the data in each set. The different symbols indicate different fills of the vessel, although the same symbol for different beam qualities does not mean the same fill was involved. The monitor to which the calorimeter response is referenced is a NE2571 ion chamber.
Table 4.
Estimates of the contributions to the standard uncertainty on the absorbed dose to water for 60Co γ-rays when measured using the NRC sealed water calorimeter. The only change for high energy x-rays is the addition of a component for beam monitoring which increases the overall uncertainty by about 0.1%.
Uncertainty (%) Quantity si ui Reproducibility (n=190) 0.06 Specific heat 0.00 Heat loss (kc) 0.15 Field perturbation (kp) 0.05 Dose profile (kdd) 0.04 Density (kρ) 0.00 Heat defect (kHD) 0.30 Probe calibration (β) 0.20 Positioning 0.10 Combined uncertainties 0.06 0.41 Overall uncertainty 0.41 w D, w a. D =N ◊Q (7) Co w Q D, w a, D =k ◊N ◊Q (8)
irradiation times were shorter, i.e., 90 s or 60 s, the sample standard deviation was 0.9% and 1.7%, respectively.
The calorimeter has been used to establish the absorbed dose to water in four different photon beams and the results are summarized in Figure 12. In order to help eliminate systematic effects due to the heat defect, at least two different aqueous systems were used at each beam quality. In addition, the vessel was emptied and refilled several times during the course of the measurements. Furthermore, the 60
Co data was obtained using two different vessels [23].
The contributions to the uncertainty on the measured absorbed dose for 60Co γ-rays is shown in Table 4.
V. D
ERIVEDR
ESULTSSection IV summarized how the sealed water calorimeter was used to establish the absorbed dose per monitor unit for several high energy photon beams. These calibrated beams can be used to study problems of interest to radiation dosimetry. Three applications of our calibrated beams are described in the following subsections.
A. Ion Chamber Calibration Factors
Consider a photon beam for which the absorbed dose to water per monitor unit has been established at a reference point in a water phantom using calorimetry. If an ion chamber (or other dosimeter) is placed at the reference point, a calibration factor, ND, w, can be obtained such that the reading
of the instrument, Qa, is related to the absorbed dose to water,
Dw, by
In general, it may not be possible, either because of expense or because calibrated beams are not available, to directly calibrate an ion chamber at every beam quality of clinical interest. In an attempt to circumvent this problem, two recent dosimetry protocols [24], [25] have proposed the introduction of a beam quality conversion factor, kQ, such that
Q Co Q D, w/ D, w,
k =N N (9)
Figure 13: Summary of measured and calculated kQ data for the
NE2571 ion chamber. The data of Guerra et al are from [27]; Palmans
et al from [28]; Ross et al from [29]; and NPL from [30]. The solid
curve labelled TG-51 is the result obtained using the AAPM protocol [24] while the dashed line shows the calculated effect of including a 1 mm Lucite sleeve on the chamber. Data for other chamber types are presented in [26].
Figure 14: Variation of εG with energy. Our measured data with both the stirred [32] and sealed [33] water calorimeters are shown. The data of Shalek et al are from [31]; Nahum et al from [34]; and Svensson and Brahme from [35].
where Co is the absorbed dose calibration factor for 60Co γ-D, w
N
rays and kQ is given by
where Q is the calibration factor at beam quality Q. Both
D, w
N
the AAPM and IAEA protocols rely on values of kQ that have
been calculated using ion chamber theory. In order to test these calculations we have measured kQ for several different
types of ion chambers, and the detailed results are given in a paper which has been submitted for publication [26]. Figure 13 shows our measured values of kQ for the NE2571 chamber
along with results obtained by others and the curve predicted by the AAPM protocol. The agreement among the data sets measured by different groups, and between the measured data and the calculated values of kQ is quite satisfactory.
B. Fricke Dosimetry
The Fricke dosimeter is a chemical dosimeter that is capable of high precision and has been widely used in radiation dosimetry. When irradiated, the amount of ferric ion produced is proportional to the absorbed dose, and the ferric ion concentration can be measured using optical absorption techniques. If the Fricke dosimeter is to be used absolutely, the ferric ion yield, G(Fe3+
), must be determined by calibrating the dosimeter against some dose standard. It is well known that
G(Fe3+) depends on the energy spectrum of the electrons set in
motion in the dosimeter, decreasing as the mean electron energy is decreased [31]. However, existing data are not adequate to determine how G(Fe3+) changes with energy
between 60Co γ-rays and high energy x-rays.
At the previous NPL Workshop, we presented data obtained using a stirred water calorimeter which indicated that
G(Fe3+
) increases by 1% as the energy increases from 60
Co to 20 MV x-rays [32]. Since then, we have used the photon beams calibrated using the sealed water calorimeter to measure
G(Fe3+) (or more precisely εG, where ε is the extinction
coefficient for the ferric ion). The results are summarized in Figure 14 which also includes the data obtained using the stirred water calorimeter. Taken together, these data suggest that G(Fe3+) changes by 0.7 (±0.3)% between 60
Co and high energy x-rays. More details on this work can be obtained from [33].
C. Intercomparison of Absorbed Dose Standards
Other groups have established absorbed dose standards for both 60
Co γ-rays and high energy x-rays. Because the techniques used by different laboratories are not always the same, an intercomparison of dose standards can help to identify systematic errors.
Using ion chambers, the 60
Co dose standard of NRC has been compared with the equivalent standard of several other laboratories, and the results are summarized in Figure 15. Only the uncertainties associated with the ion chamber measurements are shown in this figure, and serve to show that the calibrated beams can be compared with an uncertainty considerably smaller than the uncertainty on the absorbed dose. Given that the uncertainty on most absorbed dose standards is about 0.5%, Figure 15 shows that the agreement between the laboratories is quite impressive.
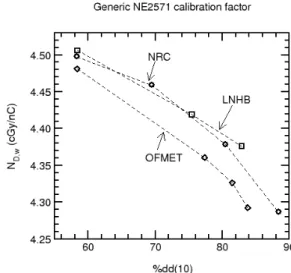
Comparisons have also been carried out between NRC and two laboratories which have the capability of determining the absorbed dose in high energy photon beams. The results are shown in Figure 16, where the average calibration factor for a set of NE2571 ion chambers is given as a function of beam quality for the three laboratories. In this case, the agreement is not as good as for 60
Co, with discrepancies as large as 1% between the laboratories.
Figure 15: Comparison of the 60
Co absorbed dose to water standards of several national laboratories. The comparisons were carried out using ion chambers as transfer instruments. The laboratories are identified as follows: ARL - Australian Radiation laboratory; BIPM - Bureau International des Poids et Mesures; LNHB - Laboratoire National Henri Becquerel; NIST - National Institute of Standards and Technology; OFMET - Swiss Federal Office of Metrology. Only the standard uncertainties arising from the ion chamber measurements are shown.
Figure 16: Comparison of the absorbed dose to water for high energy x-ray beams as measured by three national laboratories. The comparisons were carried out using a set of NE2571 ion chambers, which were calibrated by each laboratory in terms of absorbed dose to water. The laboratories are identified as follows: NRC - National Research Council; LNHB - Laboratoire National Henri Becquerel; OFMET - Swiss Federal Office of Metrology.
VI. S
UMMARYThe NRC calorimeter is operated at 4o
C to avoid convective heat transfer. Apart from the heat defect, no single correction factor is bigger than 0.3%, and the combined effect of all these corrections is less than 0.3%.
Knowledge and control of the heat defect is the most challenging aspect of water calorimetry. Both pure water and water saturated with H2 gas are predicted to have a heat defect
of zero after a small accumulated dose. This result is insensitive to the details of the model used to describe the radiation chemistry. However, traces of O2 will affect the
response of both systems, and pure water tends to be sensitive to impurities in general. On the other hand, the H2/O2 system
tends to be rather insensitive to impurities. However, its heat defect is non-zero, and thus the model used to describe the radiolysis of water plays a more important role. Using all three systems, we estimate that the standard uncertainty contributed by the heat defect is 0.3%, and is the largest contribution to the overall uncertainty.
The sealed water calorimeter operated at 4o
C is now the Canadian standard for the absorbed dose to water. Ion chamber calibration factors have been measured for 60
Co γ-rays and high energy x-rays, and compared with the calibration factors determined by other laboratories. The agreement for 60
Co is excellent, although there are discrepancies as large as 1% for high energy x-rays.
A
CKNOWLEDGEMENTSThe knowledge, skill and dedication of NRC's technical and support staff were critical for the successful outcome of this work. The glass cylinders which form the central portion of the sealed glass vessels were ground by Gary Boyd. The rest of the glass work, including the glass envelopes for the thermistor probes, was done by Peter l'Abbé. David Marchington was responsible for the overall assembly of the calorimeter and he also constructed the internal bead and lead assemblies for the thermistor probes. Leo Heistek constructed the bridge circuit and the electronics for automated control. The original software for reading and analysing the data from the calorimeter was converted into Windows-based applications by a summer student, Dylan Togane.
R
EFERENCES[1] AAPM, “A protocol for the determination of absorbed dose from high-energy photon and electron beams”,
Med. Phys., vol. 10, pp. 741-771, 1983.
[2] IAEA, Absorbed dose determination in photon and electron beams, Technical Report Series 277, International Atomic Energy Agency, Vienna, 1987. [3] IPSM “Code of Practice for high-energy photon therapy
dosimetry based on the NPL absorbed dose calibration service”, Phys. Med. Biol., vol. 35, pp. 1355-1360, 1990.
[4] A.R. DuSautoy, “The UK primary standard calorimeter for photon-beam absorbed dose measurement”, Phys.
Med. Biol., vol. 41, pp. 137-15, 1996.
[5] A.S. Guerra, R.F. Laitano and M. Pimpinella, “Characteristics of the absorbed dose to water standard
at ENEA”, Phys. Med. Biol., vol. 41, pp. 657-674, 1996.
[6] B. Chauvenet, D. Baltès and F. Delaunay, “Comparison of graphite-to-water absorbed-dose transfers for 60
Co photon beams using ionometry and Fricke dosimetry”,
Phys. Med. Biol., vol. 42, 2053-2063, 1997.
[7] S.R. Domen, “Absorbed dose water calorimeter”, Med.
Phys., vol. 7, pp. 157-159, 1980.
[8] C.K. Ross and N.V. Klassen, “Water calorimetry for radiation dosimetry, Phys. Med. Biol., vol. 41, pp. 1-29, 1996.
[9] S.R. Domen, “A sealed water calorimeter for measuring absorbed dose”, J. Res. Natl. Inst. Stand. Tech., vol. 99, pp. 121-141, 1994.
[10] J. Seuntjens, H. Thierens and U. Schneider “Correction factors for a cylindrical ionization chamber used in medium energy x-ray beams”, Phys. Med. Biol., vol. 38, pp. 805-832, 1993.
[11] J. Seuntjens, A. Van der Plaetsen, K. Van Laere and H. Thierens, “Study of the relative heat defect and correction factors of a water calorimetric determination of absorbed dose to water in high-energy photon beams”,
Proc. Symp. on Measurement Assurance in Dosimetry,
IAEA-SM-330/6, (Vienna: IAEA), pp. 45-59, 1993. [12] C.K. Ross, N.V. Klassen and G.D. Smith, “The effect of
various dissolved gases on the heat defect of water’,
Med. Phys., vol. 11, pp. 653-658, 1984.
[13] C.K. Ross, N.V. Klassen, K.R. Shortt and G.D. Smith, “A direct comparison of water calorimetry and Fricke dosimetry”, Phys. Med. Biol., vol. 34, pp. 23-42, 1989. [14] J. Seuntjens and H. Palmans, “Correction factors and
performance of a 4o
C sealed water calorimeter”, Phys.
Med. Biol., vol. 44, pp. 627-646, 1999.
[15] M. Roos, “The current status of water absorbed dose calorimetry in the PTB”, In NRC Workshop on Water Calorimetry, C.K. Ross and N.V. Klassen (Eds.), National Research Council, Ottawa, Canada, pp. 9-15, 1988.
[16] J. Seuntjens, “Comparative Study of Ion Chamber Dosimetry and Water Calorimetry in Medium Energy X-Ray Beams”, Ph.D. thesis, Gent University, Gent, Belgium, 1991.
[17] J.S. Laughlin and S. Genna, “Calorimetry”, In Radiation Dosimetry, Vol. II, F.H. Attix and W.C. Roesch (Eds.), pp. 389-441, Academic Press: New York, 1966.
[18] R.J. Schulz and M.S. Weinhous, “Convection currents in a water calorimeter”, Phys. Med. Biol., vol. 30, pp. 1093-1099, 1985.
[19] N.V. Klassen and C.K. Ross, “Absorbed dose calorimetry using various aqueous solutions”, Radiat.
Phys. Chem., vol. 38, pp. 95-104, 1991.
[20] M.B. Carver, D.V. Hanley and K.R. Chaplin, “MAKSIMA-CHEMIST: A program for mass action kinetics simulation by automatic chemical equation
manipulation and integration using stiff techniques”, Technical Report AECL-6413, Chalk River Nuclear Laboratories, Chalk River, Canada, 1979.
[21] N.V. Klassen and C.K. Ross, “Water calorimetry: The heat defect”, J. Res. Natl. Inst. Stand. Technol., vol. 102, pp. 63-74, 1997.
[22] A.J. Elliot, “Rate constants and G-values for the simulation of the radiolysis of light water over the range 0—300o
C, Technical Report AECL-11073, Atomic Energy of Canada Ltd., Chalk River, Canada, 1994. [23] J.P. Seuntjens, C.K. Ross, N.V. Klassen and K.R. Shortt,
“A status report on the NRC sealed water calorimeter”, NRC Report PIRS-0584, National Research Council, Ottawa, Canada, 1999.
[24] AAPM, “AAPM's TG-51 protocol for clinical reference dosimetry of high-energy photon and electron beams”,
Med. Phys., vol. 26, pp. 1847-1870, 1999.
[25] IAEA, “Absorbed dose determination in external beam radiotherapy: An international code of practice for dosimetry based on standards of absorbed dose to water”, Technical Report Series Draft V.5, International Atomic Energy Agency, Vienna, 1999.
[26] J.P. Seuntjens, C.K. Ross, K.R. Shortt and D.W.O. Rogers, “Absorbed-dose beam quality conversion factors for cylindrical chambers in high-energy photon beams”, Med. Phys., (Submitted, November 1999), 2000. [27] A.S. Guerra, R.F. Laitano and M. Pimpinella, “Experimental determination of the beam quality dependence factors, , for ionization chambers used in photon and electron dosimetry”, Phys. Med. Biol., vol. 40, pp. 1177-1190, 1995.
[28] H. Palmans, W. Mondelaers and H. Thierens, “Absorbed dose beam quality correction factors for the NE2571 chamber in a 5 MV and a 10 MV photon beam”, Phys. Med. Biol., vol. 44, pp. 647-663, 1999. [29] C.K. Ross, K.R. Shortt, D.W.O. Rogers and F.
Delaunay, “A test of as a beam quality specifier for high energy photon beams”, In Proc. Symp. on Measurement Assurance in Dosimetry, IAEA-SM-330/10, Vienna, pp. 309—321, 1993.
[30] P. Sharpe “Progress report on radiation dosimetry at NPL”, BIPM Report CCRI(I)/99-20, BIPM, Paris, 1999. [31] R.J. Shalek, W.K. Sinclair and J.C. Calkins, “The
relative biological effectiveness of 22-mevp x-rays, cobalt-60 gamma rays, and 200-kvcp x-rays II. The use of the ferrous sulfate dosimeter for x-ray and gamma-ray beams”, Radiat. Res., vol. 16, pp. 344-351, 1962. [32] C.K. Ross, N.V. Klassen and K.R. Shortt, “The
development of a standard based on water calorimetry for absorbed dose to water”, In NPL Calorimetry Workshop, Teddington, UK National Physical Laboratory, 1994.
[33] N.V. Klassen, K.R. Shortt, J. Seuntjens and C.K. Ross, “Fricke dosimetry: The difference between G(Fe3+
) for
60
Co γ-rays and high energy x-rays”, Phys. Med. Biol., vol. 44, pp. 1609-1624, 1999.
[34] A.E. Nahum, H. Svensson and A. Brahme, “The ferrous sulphate G-value for electron and photon beams: A semi-empirical analysis and its experimental support”, In Seventh Symposium on Microdosimetry, J. Booz, H.G. Ebert, and H.D. Hartfiel (Eds.), Oxford, UK, pp. 841-851, 1980.
[35] H. Svensson and A. Brahme, “Ferrous sulfate dosimetry for electrons. A re-evaluation”, Acta Radiol. Oncol., vol. 18, pp. 326-336, 1979.
Q
UESTIONS ANDA
NSWERSAchim Krauss: When you assign the 0.3% uncertainty for
the heat defect in your calorimeter, then that means that you actually use the H2/02 system where you find the differences
between the different models.
Carl Ross: We have to admit to not being completely
consistent at this point. The Cobalt data I believe, Jan, does not include the hydrogen/oxygen in our dose number. But the high energy data by and large we have. So, yes.
Achim Krauss: I’m thinking about the fact that: if you use
the H2 system calorimeter, then all the different models you
have produce the zero heat effect, and you can show in your experiment that it is really stable independent on accumulated dose or dose rate. I think there is no reason why you couldn’t say that the model is right and we can take the zero heat effect without any uncertainty.
Carl Ross: Yes. Well, at least the problem that we
encounter is that the business of preparing the fill, purifying the water, bubbling with hydrogen - it is difficult to say that you can always achieve the condition that you have just outlined. You have to be sure that you have purged it of oxygen, for example. So, if you are able to demonstrate conclusively that you can control the quality, then I think you can squeeze the 0.3% smaller, but it is our feeling that we would not feel particularly comfortable for our work in making it much smaller than that.
Ken Gall: Following this point, I think Achim has shown,
that with radiation the heat defects change with a hydrogen/oxygen system. Has anyone confirmed that with these radiation chemistry results that you can actually achieve that? Did you ever do radiation chemistry on them? Have you any results?
Achim Krauss: You mentioned a very special H2/O2
system - it’s not the system used in the NRC calorimeter.
Ken Gall: But doesn’t it become the H2 system in the end?
So just how you get to the H2 is not so important, as long as
you get there.
Carl Ross: But you have to be able to address, for
example, the question of leaks. No valve is perfect, we have not found a perfect valve, and Norman Klassen has done some detailed measurements of leak rates through the valves and
sealing systems we have, and by and large the leak rates are sufficiently small that on the timescale of several days you don’t have to worry. But irradiating to see the chain reaction happen and saying ‘now I’ve purged it of oxygen’ is potentially dangerous as well, if you have a steady leak of oxygen.
Jan Seuntjens: For a hydrogen system, this leads to
dramatic exothermicity. You don’t need much oxygen to get a significant heat defect, and therefore the H2/O2 mixture is


![Figure 14: Variation of εG with energy. Our measured data with both the stirred [32] and sealed [33] water calorimeters are shown](https://thumb-eu.123doks.com/thumbv2/123doknet/14203402.480410/11.892.104.392.451.701/figure-variation-energy-measured-stirred-sealed-water-calorimeters.webp)