RESEARCH OUTPUTS / RÉSULTATS DE RECHERCHE
Author(s) - Auteur(s) :
Publication date - Date de publication :
Permanent link - Permalien :
Rights / License - Licence de droit d’auteur :
Institutional Repository - Research Portal
Dépôt Institutionnel - Portail de la Recherche
researchportal.unamur.be
University of Namur
Can we use local climate zones for predicting malaria prevalence across sub-Saharan
African cities?
Brousse, O.; Georganos, S.; Demuzere, M.; Dujardin, S.; Lennert, M.; Linard, C.; Snow, R.
W.; Thiery, W.; Van Lipzig, N. P.M.
Published in:
Environmental Research Letters
DOI:
10.1088/1748-9326/abc996
Publication date:
2020
Document Version
Publisher's PDF, also known as Version of record Link to publication
Citation for pulished version (HARVARD):
Brousse, O, Georganos, S, Demuzere, M, Dujardin, S, Lennert, M, Linard, C, Snow, RW, Thiery, W & Van Lipzig, NPM 2020, 'Can we use local climate zones for predicting malaria prevalence across sub-Saharan African cities?', Environmental Research Letters, vol. 15, no. 12, 124051. https://doi.org/10.1088/1748-9326/abc996
General rights
Copyright and moral rights for the publications made accessible in the public portal are retained by the authors and/or other copyright owners and it is a condition of accessing publications that users recognise and abide by the legal requirements associated with these rights.
• Users may download and print one copy of any publication from the public portal for the purpose of private study or research. • You may not further distribute the material or use it for any profit-making activity or commercial gain
• You may freely distribute the URL identifying the publication in the public portal ?
Take down policy
If you believe that this document breaches copyright please contact us providing details, and we will remove access to the work immediately and investigate your claim.
Can we use local climate zones for predicting
malaria prevalence across sub-Saharan African
cities?
To cite this article: O Brousse et al 2020 Environ. Res. Lett. 15 124051
View the article online for updates and enhancements.
Recent citations
Impact of Urban Canopy Parameters on a Megacity’s Modelled Thermal Environment
Mikhail Varentsov et al
Environ. Res. Lett. 15 (2020) 124051 https://doi.org/10.1088/1748-9326/abc996
Environmental Research Letters
OPEN ACCESS
RECEIVED
13 July 2020
REVISED
20 October 2020
ACCEPTED FOR PUBLICATION
11 November 2020
PUBLISHED
14 December 2020 Original Content from this work may be used under the terms of the
Creative Commons Attribution 4.0 licence. Any further distribution of this work must maintain attribution to the author(s) and the title of the work, journal citation and DOI.
LETTER
Can we use local climate zones for predicting malaria prevalence
across sub-Saharan African cities?
O Brousse1,2, S Georganos3, M Demuzere4,5, S Dujardin6, M Lennert3, C Linard6, R W Snow7,8, W Thiery9 and N P M van Lipzig1
1 Department of Earth and Environmental Sciences, KU Leuven, Leuven, Belgium
2 UCL Institute for Environmental Design and Engineering, University College London, London, United Kingdom 3 Department of Geosciences, Environment and Society, Universit´e Libre de Bruxelles, Brussels, Belgium 4 Department of Geography, Ruhr-University Bochum, Bochum, Germany
5 Department of Environment, Ghent University, Ghent, Belgium 6 Department of Geography, Universit´e de Namur, Namur, Belgium
7 Population and Health Unit, Kenya Medical Research Institute Wellcome Trust, Nairobi, Kenya
8 Department of Tropical Medicine and Global Health, Nuffield Department of Medicine, University of Oxford, Oxford, United Kingdom 9 Department of Hydrology and Hydraulic Engineering, Vrije Universiteit Brussel, Brussels, Belgium
E-mail:[email protected]
Keywords: malaria, sub-Saharan africa, local climate zones, urban malaria modeling, random forest modeling, urban health, WUDAPT
Supplementary material for this article is availableonline
Abstract
Malaria burden is increasing in sub-Saharan cities because of rapid and uncontrolled urbanization.
Yet very few studies have studied the interactions between urban environments and malaria.
Additionally, no standardized urban land-use/land-cover has been defined for urban malaria
studies. Here, we demonstrate the potential of local climate zones (LCZs) for modeling malaria
prevalence rate (Pf PR
2−10) and studying malaria prevalence in urban settings across nine
sub-Saharan African cities. Using a random forest classification algorithm over a set of 365 malaria
surveys we: (i) identify a suitable set of covariates derived from open-source earth observations;
and (ii) depict the best buffer size at which to aggregate them for modeling Pf PR
2−10.
Our results demonstrate that geographical models can learn from LCZ over a set of cities and be
transferred over a city of choice that has few or no malaria surveys. In particular, we find that
urban areas systematically have lower Pf PR
2−10(5%–30%) than rural areas (15%–40%). The
Pf PR
2−10urban-to-rural gradient is dependent on the climatic environment in which the city is
located. Further, LCZs show that more open urban environments located close to wetlands have
higher Pf PR
2−10. Informal settlements—represented by the LCZ 7 (lightweight lowrise)—have
higher malaria prevalence than other densely built-up residential areas with a mean prevalence of
11.11%. Overall, we suggest the applicability of LCZs for more exploratory modeling in urban
malaria studies.
1. Introduction
In sub-Saharan Africa, malaria transmission is main-tained by mosquito vectors that are predominantly found in rural environment (Hay et al2005, Machault et al 2010). But rapid and uncontrolled urbaniza-tion in sub-Saharan Africa (Union2017, Wolff et al 2020) increased the amount of exposed urban inhab-itants. The inherent appearance of informal and planned residential neighborhoods with their social inequalities (Eloundou-Enyegue and Giroux 2012, Obeng-Odoom 2015, Korah et al 2019), and the
increasing areas allocated to urban agriculture and neighboring wetlands have led to spatial disparit-ies in urban malaria risks (Klinkenberg et al 2005, Baragatti et al2009, Dongus et al2009, Kienberger and Hagenlocher2014, Kabaria et al2016). Under-standing the interactions between the heterogeneous urban environments and malaria have thus become urgent and essential for tackling malaria burden in Africa (Georganos et al2020).
Because of the complex nature of risk factors in urban environments most of urban malaria research has been constrained to the level of case studies and
major review papers (e.g. Robert et al (2003), Hay et al (2005), De Silva and Marshall (2012)). Fur-thermore, few spatial modeling efforts of malaria— or its vectors—prevalence in urban environments have been done (e.g. Machault et al (2012), Borderon (2013), Kabaria et al (2016), Georganos et al (2020)). Additionally, malaria risk mapping initiatives at the global, continental or national level (Guerra et al (2006, Tatem et al2008, Raso et al2012, Noor et al 2014, Bhatt et al2015) simplified urban settlements as a binary covariate, without considering their hetero-geneities in forms and functions (Bennett et al2013, Giardina et al2015). As a consequence, there are to date no standardized approaches for classifying the urban environment for malaria studies. The devel-opment of such approaches is further hampered by scarce documentation on cities’ forms and functions in tropical Africa. To address this scarcity, novel and open source tools have been developed, offering an universal and simple representation of urban land-scapes based on local climate zones (LCZs; Stewart and Oke (2012)). Currently, the World Urban Data-base and Access Portal Tool (WUDAPT; Bechtel et al (2015), Ching et al (2018)) is leading the way for acquiring a city- to continental-wide land-use/land-cover (LULC) classification based on LCZs, thereby offering a detailed representation of the urban het-erogeneities (Bechtel et al2019, Demuzere et al2019a, 2019b). LCZs describe an urban LULC using 10 urban classes and 7 natural ones. Each class is explanatory of a peculiar urban typology and its inherent climate. They are therefore defined in terms of impervious and pervious coverage, building densities and heights, anthropogenic heat fluxes and heat storage capacities (Stewart and Oke2012). While the latter two are of less direct importance for malaria studies, they affect the vector’s survival capacity via their influence on urban climates (Gething et al2010,2011, Dalrymple et al2015). Consequently, Brousse et al (2019) pro-posed the use of LCZs to relate urban climates to urban malaria risk and added a natural LCZ for that purpose: LCZ wetlands (LCZ W). With LCZs gain-ing in popularity for urban design and health stud-ies (Middel et al2014, Geletic et al2018, Aminipouri et al2019, Vandamme et al2019), we hypothesize that they could be used as an universal and standard LULC classification for urban malaria studies in tropical Africa.
In this study we: (i) define a set of predictive vari-ables obtained from LCZs and freely-accessible satel-lite remote sensing data to study malaria prevalence across tropical African cities; (ii) identify the spatial scale that is most suitable for an exploratory model-ing of the heterogeneous urban environments’ influ-ences on malaria prevalence; (iii) evaluate whether the information obtained from the set of predictive variables, and more specifically from LCZs, is trans-ferable across African cities to study malaria preval-ence; and finally (iv) predict malaria prevalence in
multiple tropical African cities to analyze its system-atic spatial patterns. We analyze the results to show the added value of LCZs for urban malaria studies and discuss its potential use for future research.
2. Data and methodology
2.1. Malaria surveys: data type and filtering
Data on malaria prevalence has been assembled over several years for multiple cities to provide a comprehensive overview of malaria infec-tion risk across African cities (Snow et al (2017); http://doi:10.7910/DVN/Z29FR0). Malaria prevalence—or the Plasmodium falciparum parasite rate—is here defined as the fraction of examined indi-viduals tested positive during a single cross-sectional survey for malaria. Plasmodium falciparum parasite rate is usually standardized for children aged 2–10 (hereafter referred to as Pf PR2−10; Smith et al (2007))
to enable comparison among surveys that have dif-ferent age ranges’ targets. The Pull & Grab-based algorithm (Pull and Grab1974) was considered the best by Smith et al (2007) for calculating Pf PR2−10.
As our goal is to study the impact of urban environ-ments on Pf PR2−10, the work solely focuses on
accur-ately geolocated (with GPS coordinates or with the location validated in Google Earth; Georganos et al (2020)) survey estimates of Pf PR2−10 with
coher-ent metadata recorded with at least 20 individu-als sampled between 2005 and 2015 and who were aged below 18 years. In this way, we make sure that the standardization proposed by Smith et al (2007) includes enough examined people, while concentrat-ing on children and adolescents with reduced mobil-ity. This also avoids the inclusion of positive adults in the standardization, who tend to be confronted to a variety of urban environments because of their daily migrations (Andreasen et al2017). This results in a sub-selection of 385 surveys covering nine cit-ies (see figure 1and table S1) and with a rounded average amount of 69 examined people. These sur-veys are composed of random selection of schools and communities across the urban environment. The final selection consists of (see figure S1): Abid-jan (Ivory Coast), Accra (Ghana), Dakar (Senegal), Dar Es Salaam (Tanzania), Freetown (Sierra Leone), Kampala (Uganda), Kinshasa (Democratic Republic of Congo), Lagos (Nigeria) and Mombasa (Kenya). The rounded averaged amount of examined people per city is of 59, 104, 46, 79, 27, 71, 65, 94 and 85, respectively. All nine cities are: (i) endemic for mal-aria, (ii) metropolises of more than 1 M inhabitants, (iii) built at latitudes between 10.0◦S and 20.0◦N, and (iv) subject to the seasonal shifts of the inter-tropical convergence zone.
2.2. Mapping LCZs
We mapped the nine cities in the form of LCZs since they were not publicly available on the WUDAPT
Environ. Res. Lett. 15 (2020) 124051 O Brousse et al
Figure 1. Accurately geolocalized malaria surveys and their respective Pf PR2−10values in % plotted over the LCZ map of each
selected city.
portal (Ching et al 2018). Our mapping method is based on Demuzere et al (2019a), Demuzere et al (2019b), applying Google’s Earth Engine (GEE, Gorelick et al (2017)) random forest (RF) classifica-tion algorithm (Breiman2001) on a variety of earth observation datasets. The model is trained using a set of training areas (polygons) that are digitized over Google Earth images for each city. These training areas have been gathered during a mapathon held at the Universit´e Libre de Bruxelles on the 15th of November 2019. To evaluate the model we bootstrap the RF model 25 times using 70% of the data for train-ing and evaluattrain-ing against the remaintrain-ing 30%. We perform this evaluation in an iterative way where the original sets of training areas are reworked after each iteration until we obtain a satisfactory overall accur-acy (OA) measure of at least 50%, as proposed by Bechtel et al (2019). Other measures are employed for assessing the mapping quality: the OA for the urban LCZ classes only (OAu), the OA of the built versus
natural LCZ classes only (OAbu), and the weighted
accuracy (OAw) (see Bechtel et al (2017), Bechtel et al
(2020)). Optimal F1 accuracies per LCZ—‘which rep-resents the arithmetic mean of the class-wise F1 values, which are calculated as the weighted harmonic mean
of the user’s (UA) and producer’s accuracy (PA)’; in Verdonck et al (2019), pp. 6—are also desirable but can be highly influenced by their respective number of training areas.
The predictive variables used in Demuzere et al (2019a) are expanded with Sentinel 1 Gray Level Co-occurrence Matrix textures with a 11 by 11 window size to better capture the heterogeneities of built up surfaces (Forget et al2018) as well as Sentinel 2 red edge bands to improve the mapping of LCZ wetlands (Forkuor et al2018, Kaplan and Avdan2018) (for a complete list of the variables used in the LCZ mapping see table S2)).
Once all OAs are above the recommended value of 0.5 (figure2), all training areas are used to map each city in the form of LCZ at 100 m resolution. Reaching this value for all nine cities took about 10 working days at full time by an expert (see Brousse et al (2020a) for more information on the challenges for mapping LCZ in sub-Saharan Africa). As single pixels do not constitute an LCZ class, and granular-ity is often present in the raw LCZ maps, the raw LCZ maps are post-processed using a Gaussian fil-ter (Demuzere et al2020). Compared to the default majority post-classification filter with a radius of
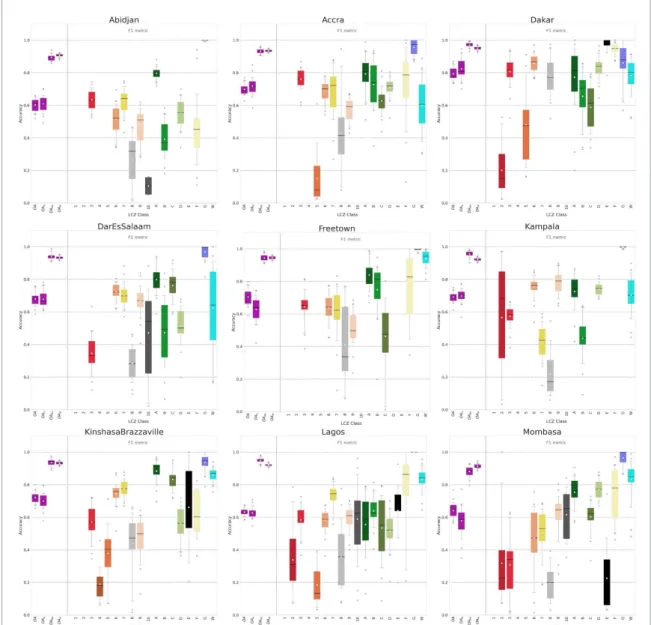
Figure 2. Boxplots of different accuracy indicators’ values for each city. In purple are, from left to right, the overall accuracy OA,
the overall accuracy of urban LCZ OAu, the overall accuracy of the built up against the natural environment OAbuand the weighted accuracy OAw. F1 accuracies per LCZ are given following the same LCZ color scale than in figure1. Zoomed in boxplots per city are provided in supplements (figures S2(a)–(h)).
300 m, this Gaussian approach takes into account typical patch sizes for each LCZ class (e.g. rivers are often more narrow than residential neighbor-hoods). This way, informal settlements, river chan-nels, and wetlands, for example, are retained after fil-tering (figure1).
2.3. Acquiring remotely sensed predictive variables
As previous studies demonstrated, rainfall, near-surface and near-surface temperatures, LULC, near-surface moisture, distance to breeding sites, vegetation indices and elevation variables are commonly used for mapping malaria prevalence (see Weiss et al (2015), Parselia et al (2019)). Here, we define open access-ibility to the data, exhaustive coverage, and hori-zontal and temporal resolutions as major criteria for choosing our data sources. This means that we derive our covariates from freely-available remotely sensed earth observation products without using
in-situ information. We decide to exclude both near-surface and near-surface temperature from the covariates as (i) spatially explicit urban near-surface temper-atures are difficult to obtain from remotely sensed data only (Zhou et al 2019, Venter et al 2020) and (ii) urban land surface temperatures cannot suffice as they are known to be subject to high uncertainties— the latter being mostly related to the complex three-dimensional landscape of cities (Voogt and Oke1998, Voogt and Oke2003). Moreover, our cities are all loc-ated in a tropical climate—defined by a monthly mean temperature that does not decrease below 18◦C—that makes their climate environments all suitable for transmission of malaria across the year (also see figure3(b) from Gething et al (2011)).
Hence, we gather: (i) LCZ maps at a native res-olution of 100 m for each city representative of years 2017–2019—assuming that the urbanization rate over the past 14 years was not sufficient to
Environ. Res. Lett. 15 (2020) 124051 O Brousse et al
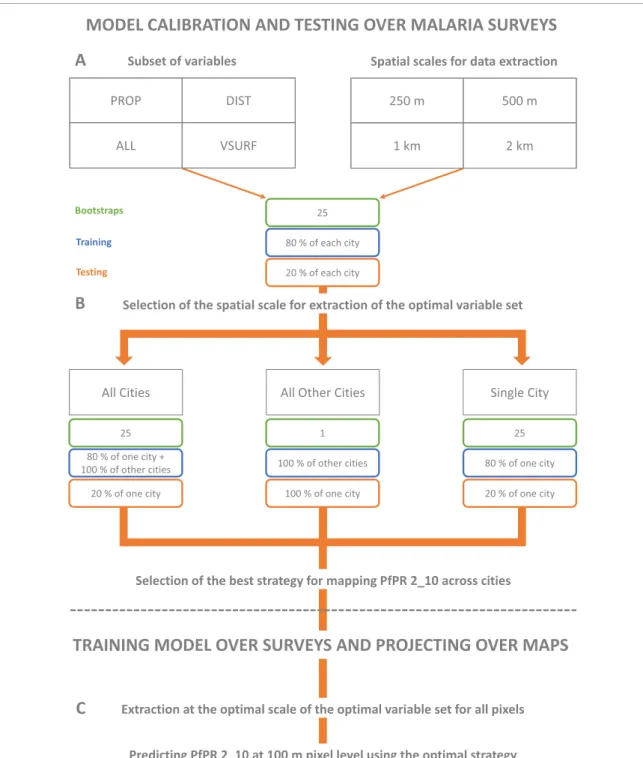
Figure 3. Schematic representation of the workflow followed in this study for modeling Pf PR2−10across nine African cities.
impact malaria prevalence in the studied cities—to capture the generic influence of common LULC fea-tures across cities on Pf PR2−10(e.g. distance to LCZ
wetlands introduced in Brousse et al (2019) or pro-portions of densely built LCZs); (ii) averaged normal-ized difference vegetation and wetness indices (NDVI and NDWI, respectively) and their temporal stand-ard deviations (σ) over the period 2005–2019 from the Landsat 5 and 8 libraries (at a native resolution of 30 m) to capture the local effect of vegetation and soil moisture on Pf PR2−10; (iii) averaged elevation of
30 m pixels in 100 m pixels for the year 2000 from
the Shuttle Radar Topography Mission digital to cap-ture the differences of Pf PR2−10across cities based on
their elevation and also within cities (e.g. low-lying and elevated areas); and (iv) yearly averaged max-imum, minimum and mean monthly precipitation at 0.1◦resolution over the period 2005–2017 from the multi-source weighted-ensemble precipitation data-set (MSWEPv2; Beck et al (2017), Beck et al (2019)) to capture the influence of the seasonal amplitude of precipitation on Pf PR2−10across cities. All data, apart
from the MSWEP product, are pre-processed on GEE and extracted at the LCZ resolution of 100 m.
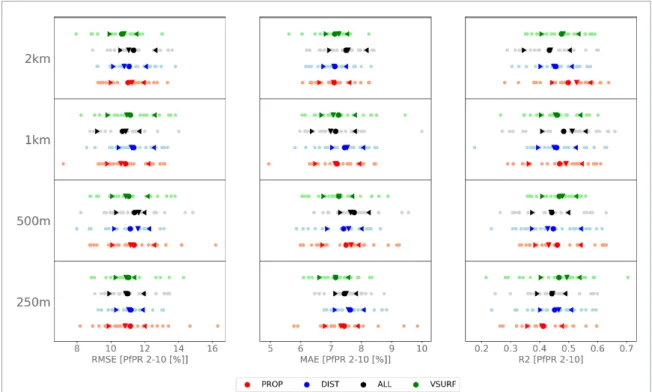
Figure 4. RMSE, MAE and R2scores for the 25 bootstraps of each buffer size (250 m, 500 m, 1 km and 2 km) using the four
different sets of variables (ALL, PROP, DIST and VSURF). Averaged scores are in thick points, median are represented by the down triangle, and the inter-quartile range is given by the summits of the left and right carets.
2.4. Selection of predictive variables and buffer sizes
Four buffer radii centered over the surveys’ loca-tions are tested for predicting malaria prevalence using the above-mentioned variables (figure 3(A)): 250 m, 500 m, 1 km and 2 km. This step permits the definition of an optimal scale at which relations between the heterogeneity of urban environments and Pf PR2−10 in cities can be studied. This step is
necessary as both the examined people and the vector can move throughout the urban environment. Yet, as our sample is filtered to keep only schools and com-munity surveys focusing on children with lowered mobility, and since mosquitoes tend to migrate only over a few hundreds of meter to few kilometers in urban areas for feasting (Byrne2007, Machault et al 2010, Verdonschot and Besse-Lototskaya 2014), we do not define a buffer larger than 2 km. We chose to use an RF model because it (i) efficiently handles noisy and/or multisource data, (ii) focuses on aver-age relationships between the covariates and the pre-dicted variable and (iii) manages data that are coming from temporally and spatially heterogeneous surveys (Georganos et al2019).
For the normalized difference indices and the elevation variables we extract the mean of the buf-fer. For the precipitation data, we assign the under-lying value to the centroid of the buffer because the horizontal resolution of 0.1◦is greater than the max-imum buffer radius of 2 km. For the LCZ inform-ation, we derive the proportions of LCZ contained
within the buffer, and the averaged minimum dis-tance of points within the buffer to other LCZ classes outside of the buffer. Because of the sim-ilarities between some LCZ—as demonstrated by Bechtel et al (2017), Bechtel et al (2020)—in terms of densities and land cover types, we chose to merge some of them. Additionally, the amount of sur-veys comprised in high- and mid-rises LCZ classes was small (see table S1, which is available online at https://stacks.iop.org/ERL/15/124051/mmedia), sup-porting the merging of similar classes to ease the interpretation. The same rationale was applied for natural classes. LCZ were thus merged as follows: LCZ compact (compact high-, mid- and low-rise: LCZ 1, 2 and 3), LCZ open (open high-, mid- and low-rise: LCZ 4, 5 and 6), LCZ industrial (large lowrise and heavy industry: LCZ 8 and 10)), LCZ trees (dense trees and open trees: LCZ A and B)), LCZ lowland (bush—scrubs and lowland: LCZ C and D)). Remain-ing LCZ classes (LCZ 7: lightweight lowrise—also considered as informal settlements, LCZ 9: sparsely built; LCZ G: water—same as in the LCZ classifica-tion but constrained to open and running waters, and LCZ W: wetlands—introduced in Brousse et al (2019) as an important variable for malaria epidemiological studies) are retained as standalone variables for the Pf PR2−10 model. LCZs E and F (bare rock or paved,
and bare soil or sand, respectively) are excluded as predictive variables because they are constrained to beaches and airports and are thus not representative of major features in the urban environment.
Environ. Res. Lett. 15 (2020) 124051 O Brousse et al
Figure 5. RMSE, MAE and R2scores for each city using All Other Cities strategy (in red), All Cities strategy (in purple) and Single
City strategy (in green) using buffers of 1 km. Scores for each bootstrap are in light colors while thick points are the averaged
scores, median are represented by the down triangle, and the inter-quartile range is given by the summits of the left and right carets.
Additionally, the sensitivity of the Pf PR2−10
model is tested with respect to its input features. We used four different sets of input features (figure3(A)): (i) all predictive variables (ALL), (ii) all the variables excluding the distances to LCZs (PROP), (iii) all the variables excluding the LCZ proportions (DIST) and (iv) the most important variables for each buffer size given by the interpretation step of the VSURF package in R (VSURF; Genuer et al (2015)).
All the surveys from each city are merged together to test the most predictive set of variables, for all cit-ies and per buffer size. We then run the RF regres-sion model (Breiman2001) 25 times by following a bootstrapping procedure that randomly selects 80% for training the model and 20% of the data for testing. In addition, the random selection is stratified accord-ing to cities’ amount of surveys ensuraccord-ing that all cit-ies are always used for training and testing the model in a coherent manner across each bootstrap. Based on root-mean squared error (RMSE), mean abso-lute error (MAE) and the coefficient of determination (R2)—which are calculated on the 20% remaining for
testing—an optimal set of variables at a determined buffer size is used for training the RF model and mod-eling Pf PR2−10for each city.
2.5. Are RF models using LCZ transferable across different cities for modeling Pf PR2−10?
Once the optimal set is defined, we test if models that are built on multiple cities using LCZs can be trans-ferred over single cities under consideration to model and study their Pf PR2−10.
We first compare the model performances from the best set of variables with and without a dummy variable that refers to each city—numbers from 1 to 9 in our case. If model performances are significantly better by integrating these dummies, local features
that are not considered in this study—for example socio-economical or temperature parameters— would play a more important role than how and where cities are built for modeling Pf PR2−10.
Trans-ferring the urban environmental information from one city to another might thus not be possible. Second, we evaluate how the RF model is capable of accurately transferring cities’ information for model-ing Pf PR2−10in a single city (figure3(B)) by
compar-ing RMSE, MAE and R2 from three different
mod-eling strategies where we: (i) use all the other cities’ data and test over the held-out city. This strategy is called ‘All Other Cities’; (ii) bootstrap 25 times using only the data available for the specific city under con-sideration with a random selection at each bootstrap of 20% of the data for testing and 80% for training. This strategy is called ‘Single City’; and (iii) test the added value of complementary information from other cities for more accurate predictions in a single city. For this, we bootstrap 25 times using all the data from the other cities, in addition to a random selection at each bootstrap step of 80% of the data from the city to be mapped for training. The remain-ing 20% of the data from the city to be mapped is kept at each step for testing. This strategy is called ‘All Cities’.
2.6. Mapping Pf PR2−10per LCZ
After defining the most optimal training set and buf-fer size for modeling Pf PR2−10 across all cities, we
map Pf PR2−10 at a horizontal resolution of 100 m
for each city. Afterwards, we compare the outcomes between cities (e.g. cities that have a higher prevalence than others) and subsequently quantify the Pf PR2−10
per LCZ class across all cities to show which LULC classes could systematically at higher risks of preval-ence in tropical Africa (figure3(C)).
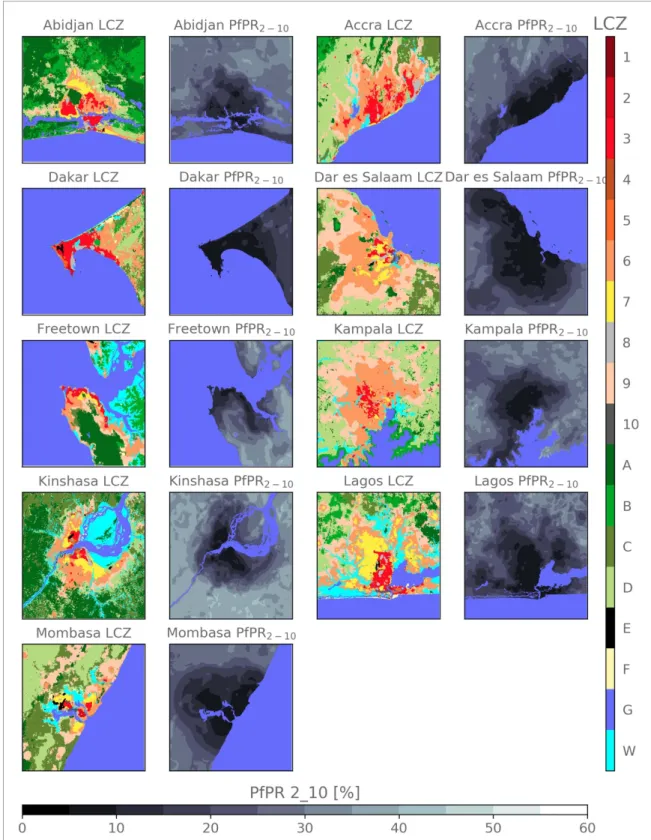
Figure 6. Modeled Pf PR2−10in percentage (%) per city using single city data and all other cities’ data in addition (All Cities, right
panel). The left panel shows the LCZ map for visually relating Pf PR2−10maps to the LULC of each city. Open water and rivers (LCZ (G) are masked out in the Pf PR2−10maps.
3. Results
The mean Pf PR2−10 over the whole data set is of
10.45% with a σ of 14.96%. We find that our mod-els depict averaged statistical scores ranging from 10.64 [% PfPR2−10] to 11.39 [% PfPR2−10], 7.10 [%
PfPR2−10] to 7.76 [% PfPR2−10], and 0.41 to 0.5
for RMSE, MAE, and R2, respectively (figure 4).
With maximum differences of 0.75 [% PfPR2−10]
for RMSE, 0.66 [% PfPR2−10] for MAE, and 0.09
for R2, the sensitivity to buffer sizes and predictors appears to be rather low. The distribution of the pre-dictions seems to follow a quasi-normal distribution, with median RMSE, MAE and R2always close to the
mean. Also, differences between σ are not significant, according to a Wilcoxon rank-sum test.
We therefore opt for a buffer size of 1 km for an exploratory modeling of Pf PR2−10across all cities
Environ. Res. Lett. 15 (2020) 124051 O Brousse et al
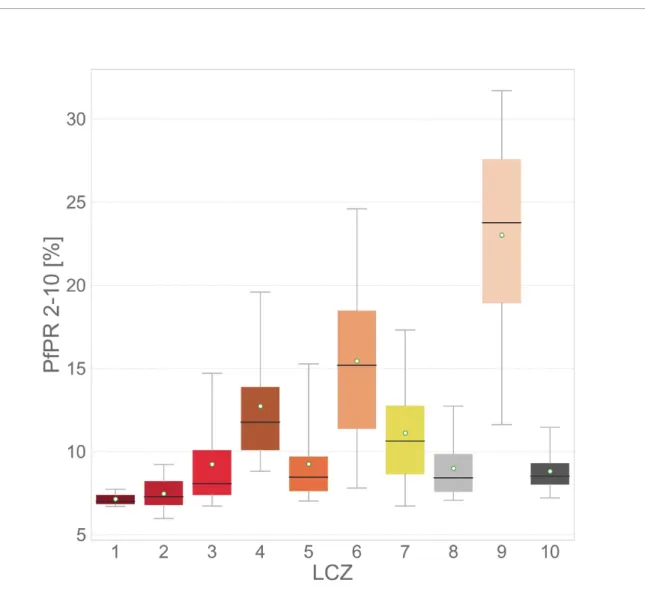
Figure 7. Modeled Pf PR2−10in percentage (%) per urban LCZ across all cities using single city data and all other cities’ data in
addition (All Cities). The distribution is represented in the form of boxplots where boxes are the interquartile range, whiskers the 5 to 95th percentile, black horizontal lines the median, and white points the mean.
using all predictive variables (ALL; figure 4). This buffer size and variables set gives the 2nd, the 5th and the 2nd best mean RMSE, MAE and R2
respect-ively, while still offering a full set of variables that can explain Pf PR2−10. According to the variable
import-ance, we find that the ten most important variables are precipitation, normalized difference indices and their standard deviation, elevation and distances to LCZ compact, LCZ informal, and LCZ industrial. All the other variables derived from LCZ, apart from the proportion of LCZ industrial, are of relative import-ance and contribute to an increase in model’s per-formance (figure S3).
The inclusion of dummies referring to each city leads to a slight deterioration of model performance when using all variables (ALL) obtained within a 1 km buffer. In particular, this leads to a reduction of mean R2by 3.84% and an increase of mean MAE
and mean RMSE by 5.04% and 5.53%, respectively. Extending the single city data with information from other cities (All Cities) results in similar performances
compared to using single city data only (Single City). In addition, the All Cities tends to reduce the uncer-tainty between each bootstrapping step (figure5). In comparison to the two other strategies, using the All Other Cities strategy results in an absolute deteriora-tion of the model performance by 4.18 [% PfPR2−10]
for RMSE, 3.16 [% Pf PR2−10] for MAE and 0.16 for
R2, in average. But, when comparing model perform-ances per city (e.g. Freetown’s statistical indicators against Kampala’s) relative orders are respected. These results overall confirm that the information obtained by the model over other cities can be trans-ferred for modeling Pf PR2−10 in the city under
consideration.
Considering all the above-mentioned results, we are able to map Pf PR2−10 in each city at a
hori-zontal resolution of 100 m using all predictive vari-ables (ALL) gathered in a 1 km buffer size around each pixel. We train the RF model over all 365 surveys (All Cities). Results highlight that urban areas have Pf PR2−10 values between 5% and 30%,
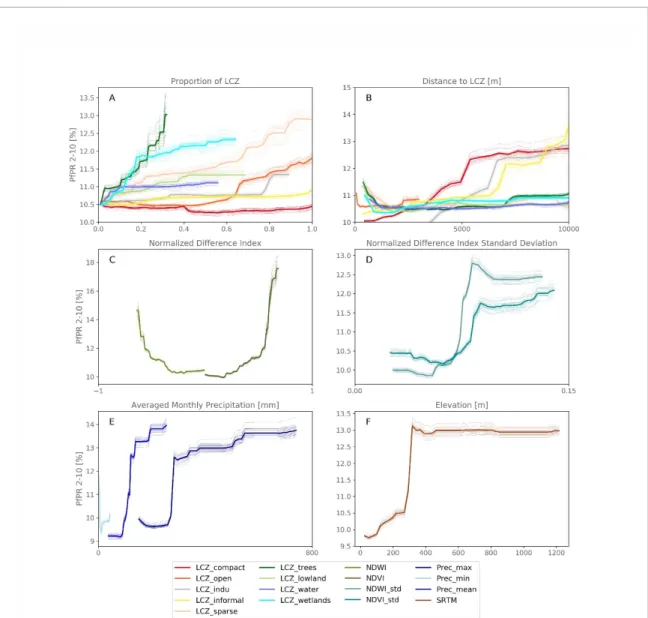
Figure 8. Averaged partial dependence plots (thick lines) over 25 model runs (light lines) for all variables used in the study.
Variables are grouped by type: proportions of Local Climate Zones (LCZs; (A), distances to LCZs (B), normalized difference indices (NDI; (C), standard deviation of NDI (D), precipitation (E) and elevation (F).
while this is between approximately 15% to 40% for rural areas (figure 6). The gradient from the urban center to the rural areas is different between each city suggesting that the endemicity of each local environment is well captured by the model. The big-ger differences between urban and rural areas are loc-ated in Kinshasa, while cities like Dakar and Mombasa have small urban to rural gradients of Pf PR2− 10.
When separating back the merged LCZ classes and looking at the modeled Pf PR2−10 per LCZ
(figure7), we can see that dense LCZs (LCZ 1–3) have the lowest Pf PR2−10values with mean Pf PR2−10
values of 7.14%, 7.47% and 9.24%, respectively. Higher mean Pf PR2−10 are observed in open
low-rise (LCZ 6) and sparsely built (LCZ 9) environ-ments with values of 15.44% and 23.0%, respectively. In addition, very densely built informal settlements (LCZ 7—lightweight lowrise) have a higher mean Pf PR2−10than other densely built classes with a value
of 11.11%. Industrial areas (LCZ 8—large lowrise,
and LCZ 10—heavy industry) have Pf PR2−10values
below 10%.
4. Discussion and conclusions
In this study, we demonstrate that the universal LCZs LULC classification can be used for modeling and studying malaria prevalence (Pf PR2−10) across
trop-ical African cities. In particular, we show that LCZ can efficiently help to understand the influence of urban environments on Pf PR2−10 and that this
informa-tion can be transferred to other cities to study urban Pf PR2−10 in distinct urban areas in tropical Africa.
Our results therefore suggest that geographical mod-els could be trained on other cities to model Pf PR2−10
in a selected city that has no malaria survey—yet acknowledging a probable deterioration of the model performance. Because LCZs are designed to repres-ent urban forms and functions across the world in a generic way (Stewart and Oke2012), they allow for a
Environ. Res. Lett. 15 (2020) 124051 O Brousse et al
standardization of the urban LULC information that enables modeling of Pf PR2−10’s spatial
heterogeneit-ies in urban and peri-urban environments. Indeed, our modeling performances are in line with pre-vious spatial modeling of Pf PR2−10 that modeled
the spatial distribution of Pf PR2−10 in the cities of
Dar Es Salaam and Kampala (Kabaria et al 2016, Georganos et al2020). In these studies, RMSEs are ranging between 6.02 [% Pf PR2−10] and 16.02 [%
Pf PR2−10] for the city of Dar Es Salaam, depending
on the covariates that were used, while the only map-ping over Kampala—that used very-high resolution satellite imagery—had a median RMSE of 5.45 [% Pf PR2−10]. In our study, the mean RMSE is 6.86 [%
Pf PR2−10] and 9.43 [% Pf PR2−10], respectively, for
the two latter cities. This shows that a RF regression model can be trained to predict Pf PR2−10 at a
hori-zontal resolution of 100 m by including the variability of the urban environment in buffers of 1 km radius around each malaria survey. These model outputs at high resolution should however be constrained to exploratory purposes and not be considered as finite maps of Pf PR2−10.
To illustrate the latter, partial dependence plots (figure 8)—that characterize the response of Pf PR2−10to a given explanatory variable—show that
an increase in proportion of open LCZ (e.g. LCZ open or LCZ sparse) is positively correlated to an increase in Pf PR2−10 while more dense urban areas
(LCZ compact) leads to lower Pf PR2−10. In
addi-tion, a slight increase of wetlands coverage from 0% to approximately 20% in the buffer zone leads to an increase in Pf PR2−10 from 10.5% to 12%
(figure 8(A)). Finally, when looking at the partial dependence plots of normalized difference indices, precipitation and elevation, we can see that cities that are embedded in greener and wetter environ-ments, far from the oceans, tend to have higher mal-aria prevalence (figures8(C)–(F)). This is however only true for peri-urban and rural environments as our maps highlight similar Pf PR2−10in densely built
urban environments. The latter could explain why distances to densely built urban neighborhoods and greenness indicators like NDVI are covariates of high importance.
It is indeed commonly accepted that dense urban areas have lower malaria prevalence than surround-ing rural environments and that peri-urban areas are also at higher risk (Robert et al2003, Hay et al 2005, Kabaria et al2017). Previous case studies also concluded that informal settlements have a higher prevalence than planned residential neighborhoods (De Castro et al2004, Mukasa et al2014, Georganos et al2020). One potential explanation could be that informal settlements are forced to be built around unsanitary places, like wetlands, which can be used for urban agriculture (Kabumbuli and Kiwazi2009, Vermeiren et al2013). However, wetlands and urban
agricultural fields are known to increase vectorial capacities (Afrane et al2004, Dale and Knight2008, Verdonschot and Besse-Lototskaya2014). This is also depicted in our study, with urban settlements that are built close to wetlands—and this independent of their neighborhood typology—having higher Pf PR2−10.
The results sustain the introduction of LCZ wetlands (LCZ W) proposed by Brousse et al (2019) for vector-borne disease studies.
Albeit the similarity of our conclusions to the already existing body of literature, none of these stud-ies introduced a standardized LULC classification to study the relations between urban form and functions and malaria prevalence across tropical Africa. Our study suggests that LCZs a suitable tool for such pur-poses. Certainly, information on the urban environ-ments alone does not suffice to explore the factors that explain the heterogeneous dispersal of malaria in cit-ies. Part of the error depicted above may be related to the fact that although LCZs are similar in their build-ing typologies across cities, they can still withhold disparate socio-economic dimensions that influence individuals’ vulnerabilities, for example. Moreover, our study does not integrate temperature variations as a limiting factor for malaria prevalence and should therefore only be considered representative of places where malaria is endemic throughout the year. For instance, additional information on urban meteoro-logical variables at high resolution (e.g. Brousse et al (2020b), Van de Walle et al (2020)) could allow for a deepened understanding of the influence of urban heat, dry and wind islands on the vectorial capacity. Improved model performances and greater insights on the drivers of malaria risk in urban environ-ments could also be obtained from additional data on health infrastructure, diurnal migrations and other socio-economic factors that are not included in this study (see Boyce et al (2019)). In addition, there are inherent limitations to the malaria data that we use in our study because our product is temporally aggregated to analyze spatial patterns of malaria. This means that national interventions that happened dur-ing our 11-year period (2005–2015) are not taken into account, and nor are infections imported from recent rural-to-urban migrations. Finally, our LCZ LULC maps are only representative of recent years (2017–2019), hence hampering the quantification of the effect of recent urbanization on malaria preval-ence in tropical African cities.
Yet, it appears that at least part of the spatial distribution of Pf PR2−10 in African cities is related
to how they are built. Such conclusion could not have been depicted without the details provided by the LCZ LULC classification. For instance, other products, like the MODIS Land Cover Type Product (MCD12Q1; Sulla-Menashe and Friedl (2018)) or the Global Human Settlement Layer derived from Landsat satellites (Pesaresi et al 2013), only offer a
single urban class without information on the vari-ety of the urban environments. Typically, informal settlements, that constitute a neighborhood typo-logy with its inherent socio-economical dimensions, are captured by the LCZ mapping and are linked to higher Pf PR2−10. Nevertheless, higher Pf PR2−10
are found in more open urban environments (open low-rise; LCZ 6) and in rural environments (sparsely built; LCZ 9). Using LCZ as a standard LULC classi-fication thus eases the comparison of common fea-tures in urban Pf PR2−10 between cities and could
help decision makers to learn from other strategies for lowering Pf PR2−10 performed in other cities.
Noteworthy, our study does not integrate popula-tion densities per urban classes because of their com-plex obtainment at high resolutions (Georganos et al 2020). This may further increase the disparities in malaria transmission risks between different urban environments. For instance, number of people infec-ted in densely populainfec-ted informal settlements may be higher than in sub-urban areas. In the end, we suggest that LCZs should further be studied for potentially helping mapping intervention strategies in Africa. Future work could also try to define a standardized urban LULC classification specific to the study of urban malaria prevalence; Local Malaria Zones, for example.
Acknowledgments
The authors express their gratitude to all the partners of the REACT project and to the Steering Committee that always supported the project and helped improv-ing many of its aspects. The Landsat 5, the Land-sat 8, and the SRTM products were retrieved from the online Google Earth Engine archive, courtesy of the NASA and USGS. Same for the Sentinel 1 and Sentinel 2 product, courtesy of the ESA. This work was supported by the Remote sensing for Epidemi-ology in African CiTies (REACThttp://react.ulb.be/) project, funded by the STEREO-III program of the Belgian Science Policy (BELSPO, SR/00/337). R.W. Snow is supported as a Wellcome Trust Principal Fellow (#s 103602 and 212176) and is grateful to the support of the Wellcome Trust to the Kenya Major Overseas Programme (#203077). OB is sup-ported by the Wellcome Trust HEROIC project (grant 216035/Z/19/Z). The full database on mal-aria prevalence that was used in this study is avail-able at http://doi:10.7910/DVN/Z29FR0, Harvard Dataverse, V1, under a CC-BY 4.0 license. Scripts for aggregating satellite data around malaria surveys and for running the random forest algorithms are avail-able at https://github.com/oscarbrousse/REACT-LCZ_Malaria_ERL. OB thanks Miranda Dos Leitoes for the occasional support.
Data availability statement
The data that support the findings of this study are available upon reasonable request from the authors.
Authors’ contributions
O B designed the study together with S G, N vL, M D, W T M L supervised the work of O B and S G O B and M D performed the LCZ classification in line with the WUDAPT mapping protocol. R W S and C L provided assistance with data interpretation and use. O B and S G selected, filtered and processed the data. O B was responsible for the figures. All co-authors contributed to the writing of the paper and to the interpretation of the results.
ORCID iD
O Brousse https://orcid.org/0000-0002-7364-710X
References
Afrane Y A, Klinkenberg E, Drechsel P, Owusu-Daaku K, Garms R and Kruppa T 2004 Does irrigated urban agriculture influence the transmission of malaria in the city of kumasi, ghana? Acta Tropica89 125–34
Aminipouri M, Rayner D, Lindberg F, Thorsson S, Knudby A J, Zickfeld K, Middel A and Krayenhoff E S 2019 Urban tree planting to maintain outdoor thermal comfort under climate change: the case of Vancouver’s local climate zones
Building Environ.158 226–36
Andreasen M H, Agergaard J, Kiunsi R B and Namangaya A H 2017 Urban transformations, migration and residential mobility patterns in african secondary cities Geografisk
Tidsskrift-Danish J. Geogr.117 93–104
Baragatti M, Fournet F, Henry M C, Assi S, Ouedraogo H, Rogier C and Salem G 2009 Social and environmental malaria risk factors in urban areas of ouagadougou, burkina faso Malaria J.8 13
Bechtel B et al 2017 Quality of crowdsourced data on urban morphology-the human influence experiment (huminex)
Urban Sci.1 15
Bechtel B et al 2019 Generating wudapt level 0 data–current status of production and evaluation Urban Clim. 27 24–45
Bechtel B, Alexander P J, Böhner J, Ching J, Conrad O, Feddema J, Mills G, See L and Stewart I 2015 Mapping local climate zones for a worldwide database of the form and function of cities ISPRS Int. J. Geo-Inf.4 199–219
Bechtel B, Demuzere M and Stewart I D 2020 A weighted accuracy measure for land cover mapping: comment on Johnson et al local climate zone (LCZ) Map accuracy assessments should account for land cover physical characteristics that affect the local thermal environment Remote Sensing12 1769 Bechtel B, Demuzere M and Stewart I D 2020 A weighted accuracy measure for land cover mapping: comment on Johnson et al local climate zone (LCZ) Map accuracy assessments should account for land cover physical characteristics that affect the local thermal environment
Remote Sensing 201911 2420
Beck H E, Van Dijk A I, Levizzani V, Schellekens J, Gonzalez Miralles D, Martens B and De Roo A 2017 Mswep: 3-hourly 0.25 global gridded precipitation (1979–2015) by merging
Environ. Res. Lett. 15 (2020) 124051 O Brousse et al
gauge, satellite and reanalysis data Hydrol. Earth System Sci. 21 589–615
Beck H E, Wood E F, Pan M, Fisher C K, Miralles D G, Van Dijk A I, McVicar T R and Adler R F 2019 Mswep v2 global 3-hourly 0.1 precipitation: methodology and quantitative assessment Bull. Am. Meteorol. Soc.100 473–500 Bennett A, Kazembe L, Mathanga D P, Kinyoki D, Ali D,
Snow R W and Noor A M 2013 Mapping malaria
transmission intensity in malawi, 2000–2010 Am. J. Tropical
Med. Hygiene89 840–9
Bhatt S et al 2015 The effect of malaria control on plasmodium falciparum in Africa between 2000 and 2015 Nature 526 207–11
Borderon M 2013 Why here and not there? Developing a spatial risk model for malaria in dakar, senegal From Social
Vulnerability to Resilience: Measuring Progress Toward Disaster Risk Reduction (Bonn: UNU-EHS) pp 108–20
Boyce M R, Katz R and Standley C J 2019 Risk factors for infectious diseases in urban environments of sub-Saharan africa: a systematic review and critical appraisal of evidence
Tropical Med. Infectious Disease4 123
Breiman L 2001 Random forests Mach. Learn.45 5–32 Brousse O, Georganos S, Bechtel B, Droste A, Thiery W,
van Lipzig N P and Demuzere M 2020a Mapping African cities in local climate zones: reporting on a mapathon experience Iauc Newsletter June 2020 p 76
( http://www.urban-climate.org/wp-content/uploads/newsletter/IAUC076.pdf)
Brousse O, Georganos S, Demuzere M, Vanhuysse S, Wouters H, Wolff E, Linard C, Nicole P M and Dujardin S 2019 Using local climate zones in sub-Saharan Africa to tackle urban health issues Urban Clim.27 227–42
Brousse O, Wouters H, Demuzere M, Thiery W, Van de Walle J and van Lipzig N P 2020b The local climate impact of an African city during clear-sky conditions-implications of the recent urbanization in kampala (Uganda) Int. J. Climatol. 40 4586–4608
Byrne N 2007 Urban malaria risk in sub-Saharan Africa: where is the evidence? Travel Med. Infectious Disease 5 135–7
Ching J et al 2018 Wudapt: an urban weather, climate and environmental modeling infrastructure for the anthropocene Bull. Am. Meteorol. Soc.99 1907–24 Dale P and Knight J 2008 Wetlands and mosquitoes: a review
Wetlands Ecol. Manage.16 255–76
Dalrymple U, Mappin B and Gething P W 2015 Malaria mapping: understanding the global endemicity of falciparum and vivax malaria BMC Med.13 140
De Castro M C, Yamagata Y, Mtasiwa D, Tanner M, Utzinger J, Keiser J and Singer B H 2004 Integrated urban malaria control: a case study in Dar es Salaam, Tanzania Am. J.
Tropical Med. Hygiene71 103–17
De Silva P M and Marshall J M 2012 Factors contributing to urban malaria transmission in sub-Saharan Africa: a systematic review J. Tropical Med.2012
Demuzere M, Bechtel B, Middel A and Mills G 2019a Mapping europe into local climate zones PloS one14
Demuzere M, Bechtel B and Mills G 2019b Global transferability of local climate zone models Urban Clim.27 46–63 Demuzere M, Hankey S, Mills G, Zhang W, Lu T and Bechtel B
2020 Combining expert and crowd-sourced training data to map urban form and functions for the continental us
Scientific Data7 1–13
Dongus S et al 2009 Urban agriculture and anopheles habitats in Dar es Salaam, Tanzania Geospatial Health
3 189–210
Eloundou-Enyegue P M and Giroux S C 2012 Demographic change and rural-urban inequality in sub-Saharan Africa: theory and trends Int. Handbook of Rural Demography (Springer) pp 125–35
Forget Y, Shimoni M, Gilbert M and Linard C 2018
Complementarity between sentinel-1 and landsat 8 imagery for built-up mapping in sub-Saharan Africa
Forkuor G, Dimobe K, Serme I and Tondoh J E 2018 Landsat-8 vs. sentinel-2: examining the added value of sentinel-2’s red-edge bands to land-use and land-cover mapping in burkina faso GIScience Remote Sensing55 331–54 Geletic J, Lehnert M, Savi´c S and Milosevi´c D 2018 Modelled
spatiotemporal variability of outdoor thermal comfort in local climate zones of the city of brno, czech republic Sci.
Total Environ.624 385–95
Genuer R, Poggi J M, Tuleau-Malot C 2015 Vsurf: an r package for variable selection using random forests
Georganos S et al 2020 Modelling and mapping the intra-urban spatial distribution of plasmodium falciparum parasite rate using very-high-resolution satellite derived indicators Int. J.
Health Geographics19 1–18
Georganos S, Gadiaga A N, Linard C, Grippa T, Vanhuysse S, Mboga N, Wolff E, Dujardin S and Lennert M 2019 Modelling the wealth index of demographic and health surveys within cities using very high-resolution remotely sensed information Remote Sensing11 2543
Gething P W, Smith D L, Patil A P, Tatem A J, Snow R W and Hay S I 2010 Climate change and the global malaria recession
Nature465 342–5
Gething P W, Van Boeckel T P, Smith D L, Guerra C A, Patil A P, Snow R W and Hay S I 2011 Modelling the global constraints of temperature on transmission of plasmodium falciparum and P. vivax Parasites Vectors4 92
Giardina F, Franke J and Vounatsou P 2015 Geostatistical modelling of the malaria risk in mozambique: effect of the spatial resolution when using remotely-sensed imagery
Geospatial Health
Gorelick N, Hancher M, Dixon M, Ilyushchenko S, Thau D and Moore R 2017 Google earth engine: planetary-scale geospatial analysis for everyone Remote Sens. Environ. 202 18–27
Guerra C A, Snow R W and Hay S I 2006 Defining the global spatial limits of malaria transmission in 2005 Adv. Parasitol. 62 157–79
Hay S I, Guerra C A, Tatem A J, Atkinson P M and Snow R W 2005 Urbanization, malaria transmission and disease burden in africa Nat. Rev. Microbiol.3 81–90
Kabaria C W, Gilbert M, Noor A M, Snow R W and Linard C 2017 The impact of urbanization and population density on childhood plasmodium falciparum parasite prevalence rates in Africa Malaria J.16 49
Kabaria C W, Molteni F, Mandike R, Chacky F, Noor A M, Snow R W and Linard C 2016 Mapping intra-urban malaria risk using high resolution satellite imagery: a case study of Dar es Salaam Int. J. Health Geographics15 26
Kabumbuli R and Kiwazi F W 2009 Participatory planning, management and alternative livelihoods for poor
wetland-dependent communities in kampala, uganda Afr. J.
Ecol.47 154–60
Kaplan G, Avdan U 2018 Sentinel-1 and sentinel-2 data fusion for wetlands mapping: Balikdami, Turkey (Int. Society for Photogrammetry and Remote Sensing)
Kienberger S and Hagenlocher M 2014 Spatial-explicit modeling of social vulnerability to malaria in east Africa Int. J. Health
Geogr.13 29
Klinkenberg E, McCall P, Hastings I M, Wilson M D, Amerasinghe F P and Donnelly M J 2005 Malaria and irrigated crops, accra, ghana Emerging Infect. Dis.11 1290 Korah P I, Matthews T and Tomerini D 2019 Characterising
spatial and temporal patterns of urban evolution in sub-Saharan Africa: the case of accra, ghana Land Use Policy 87 104049
Machault V, Vignolles C, Pag`es F, Gadiaga L, Gaye A, Sokhna C, Trape J F, Lacaux J P and Rogier C 2010 Spatial
heterogeneity and temporal evolution of malaria transmission risk in dakar, senegal, according to remotely sensed environmental data Malaria J.9 252
Machault V, Vignolles C, Pag`es F, Gadiaga L, Tourre Y M, Gaye A, Sokhna C, Trape J F, Lacaux J P and Rogier C 2012 Risk mapping of anopheles gambiae sl densities using
remotely-sensed environmental and meteorological data in an urban area: Dakar, senegal PLoS One7
Middel A, Häb K, Brazel A J, Martin C A and Guhathakurta S 2014 Impact of urban form and design on mid-afternoon microclimate in phoenix local climate zones Landscape
Urban Plan.122 16–28
Mukasa D M, Nakazibwe N, Nsamba H K, Hale S E,
Cornelissen G, Bachmann R T, Salleh M, Yusuf H, Ghani W, Gombya-Ssembajwe W et al 2014 Malaria control and prevention among the under five children in slums: a case of bwaise
Noor A M, Kinyoki D K, Mundia C W, Kabaria C W, Mutua J W, Alegana V A, Fall I S and Snow R W 2014 The changing risk of plasmodium falciparum malaria infection in Africa: 2000–10: a spatial and temporal analysis of transmission intensity The Lancet383 1739–47
Obeng-Odoom F 2015 The social, spatial and economic roots of urban inequality in africa: contextualizing Jane Jacobs and Henry George Am. J. Econom. Sociol. 74 550–86
Parselia E, Kontoes C, Tsouni A, Hadjichristodoulou C, Kioutsioukis I, Magiorkinis G and Stilianakis N I 2019 Satellite earth observation data in epidemiological modeling of malaria, dengue and west nile virus: a scoping review
Remote Sens.11 1862
Pesaresi M et al 2013 A global human settlement layer from optical hr/vhr rs data: concept and first results IEEE J. Sel.
Top. Appl. Earth Obs. Remote Sens.6 2102–31 Pull J and Grab B 1974 A simple epidemiological model for
evaluating the malaria inoculation rate and the risk of infection in infants Bull. World Health Organization 51 507 Raso G et al 2012 Mapping malaria risk among children in cˆote
d’ivoire using Bayesian geo-statistical models Malaria J. 11 160
Robert V, Macintyre K, Keating J, Trape J F, Duchemin J B, Warren M and Beier J C 2003 Malaria transmission in urban sub-Saharan Africa Am. J. Trop. Med. Hyg. 68 169–76
Smith D L, Guerra C A, Snow R W and Hay S I 2007 Standardizing estimates of the plasmodium falciparum parasite rate Malaria J.6 131
Snow R W, Sartorius B, Kyalo D, Maina J, Amratia P, Mundia C W, Bejon P and Noor A M 2017 The prevalence of plasmodium falciparum in sub-Saharan Africa since 1900 Nature 550 515–18
Stewart I D and Oke T R 2012 Local climate zones for urban temperature studies Bull. Am. Meteorol. Soc.93 1879–900 Sulla-Menashe D, Friedl M A 2018 User guide to collection 6
modis land cover (mcd12q1 and mcd12c1) product USGS:
Reston, VA, USA 1–18
Tatem A J, Guerra C A, Kabaria C W, Noor A M and Hay S I 2008 Human population, urban settlement patterns and their impact on plasmodium falciparum malaria endemicity
Malaria J.7 218
Union U 2017 World population projected to reach 9.8 billion in 2050, and 11.2 billion in 2100
Van de Walle J, Thiery W, Brousse O, Souverijns N, Demuzere M and van Lipzig N P 2020 A convection-permitting model for the lake victoria basin: evaluation and insight into the mesoscale versus synoptic atmospheric dynamics Clim. Dyn. 54 1779–99
Vandamme S, Demuzere M, Verdonck M L, Zhang Z and Van Coillie F 2019 Revealing kunming’s (china) historical urban planning policies through local climate zones Remote
Sens.11 1731
Venter Z S, Brousse O, Esau I and Meier F 2020 Hyperlocal mapping of urban air temperature using remote sensing and crowdsourced weather data Remote Sens. Environ.
242 111791
Verdonck Ml, Demuzere M, Bechtel B, Beck C, Brousse O, Droste A,, Fenner D, Leconte F and Van Coillie F 2019 The human influence experiment (part 2): guidelines for improved mapping of local climate zones using a supervised classification Urban Sci.3 27
Verdonschot P F and Besse-Lototskaya A A 2014 Flight distance of mosquitoes (culicidae): a metadata analysis to support the management of barrier zones around rewetted and newly constructed wetlands Limnologica
45 69–79
Vermeiren K, Adiyia B, Loopmans M, Tumwine F R and Van Rompaey A 2013 Will urban farming survive the growth of African cities: a case-study in Kampala (Uganda)?
Land Use Policy35 40–9
Voogt J A and Oke T R 2003 Thermal remote sensing of urban climates Remote Sens. Environ.86 370–84
Voogt J A and Oke T 1998 Effects of urban surface geometry on remotely-sensed surface temperature Int. J. Remote Sens. 19 895–920
Weiss D J, Mappin B, Dalrymple U, Bhatt S, Cameron E, Hay S I and Gething P W 2015 Re-examining environmental correlates of plasmodium falciparum malaria endemicity: a data-intensive variable selection approach Malaria J. 14 68
Wolff E, Grippa T, Forget Y, Georganos S, Vanhuysse S, Shimoni M and Linard C 2020 Diversity of urban growth patterns in sub-Saharan Africa in the 1960–2010 period Afr.
Geogr. Rev.39 45–57
Zhou D et al 2019 Satellite remote sensing of surface urban heat islands: progress, challenges and perspectives Remote Sens. 11 48