IET Electrical Systems in Transportation
Special Issue: Selected Papers from the 2019 IEEE Vehicle Power
and Propulsion Conference (VPPC)
Online energy management of a hybrid fuel
cell vehicle considering the performance
variation of the power sources
ISSN 2042-9738 Received on 26th March 2020 Revised 22nd September 2020 Accepted on 2nd October 2020 E-First on 13th November 2020 doi: 10.1049/iet-est.2020.0035 www.ietdl.org
Razieh Ghaderi
1, Mohsen Kandidayeni
2,3, Mehdi Soleymani
1,4, Loïc Boulon
3, Hicham Chaoui
5 1Department of Mechatronics, Arak University, Arak 38156-8-8349, Iran2e-TESC Laboratory, Department of Electrical and Computer Engineering, University of Sherbrooke, Sherbrooke, QC, Canada
3Hydrogen Research Institute, Department of Electrical and Computer Engineering, Université du Québec à Trois-Rivières, Quebec, Canada 4Centre for Automotive Engineering and Technology School of Aerospace, Transport and Manufacturing (SATM) Cranfield University, Bedfordshire, Cranfield, UK
5Department of Electronics, Carleton University, 1125 Colonel By Drive, Ottawa, ON, Canada E-mail: [email protected]
Abstract: This study investigates the impact of battery and fuel cell (FC) degradation on energy management of a FC hybrid
electric vehicle. In this respect, an online energy management strategy (EMS) is proposed considering simultaneous online adaptation of battery and FC models. The EMS is based on quadratic programming which is integrated into an online battery and proton exchange membrane FC (PEMFC) parameters identification. Considering the battery and PEMFC states of health, three scenarios have been considered for the EMS purpose, and the performance of the proposed EMS has been examined under two driving cycles. Numerous test scenarios using standard driving cycles reveal that the ageing of battery and PEMFC has a considerable impact on the hydrogen consumption. Moreover, the proposed EMS can successfully tackle the model uncertainties owing to the performance drifts of the power sources at the mentioned scenarios.
1 Introduction
Global warming, air pollution owing to toxic fumes of combustion engines, and limitation of fossil fuels have motivated automobile industry to exploit alternative energy sources, such as fuel cell (FC) and electro-chemical battery [1, 2]. Hybrid electric vehicles (HEVs) incorporate more than one energy source to propel the vehicle. FC hybrid electric vehicle (FCHEV) is a kind of HEV that uses the FC as the primary power source and the electric battery as the secondary one [3]. Proton exchange membrane FC (PEMFC) is the most popular technology employed in the FCHEVs because of its low-temperature and low-pressure operating range [4]. Lithium-ion battery, because of its high energy and power density and low self-discharge rate, is also the dominant battery technology in the electric vehicles and HEVs [5]. Furthermore, battery provides the capability of storing the recovered energy from the regenerative braking system which in turn can improve the energy efficiency. Although PEMFCs have good energy density, they suffer from slow dynamic response. Therefore, an FC vehicle may encounter power shortage, when the required power is provided only by the FC. Therefore, the combination of PEMFC and lithium-ion battery seems a proper match for FCHEVs. As the PEMFC and lithium-ion battery have different characteristics in respect of power delivery, the design of an energy management strategy (EMS) is vital to ameliorate the hydrogen economy and lifetime of the powertrain components. The existing EMSs for FCHEVs can be grouped into three kinds: rule based, optimisation based, and intelligent based [6–8]. Rule-based strategies are normally developed based on heuristic methods and do not guarantee the optimality though they are sufficient for reaching an immediate goal [9]. Optimisation-based strategies propose theoretical near-optimal solutions. They can also be utilised to refine the rule sets of the expert system in the rule-based methods [10]. Optimisation-based EMSs are divided into global and real-time methods. Global strategies determine the optimal policy of a defined cost function over a known driving profile and are not appropriate for real-time applications. Dynamic programming (as an optimal solution) [11, 12] and metaheuristic algorithms, such as genetic algorithm [13] (as a near-optimal solution), have been employed several times as off-line global
EMSs. Real-time strategies solve an instantaneous cost function at each instant concerning the variables of the vehicle model. These strategies have been developed employing optimal theory techniques, such as quadratic programming (QP) [14–17], Pontryagin's minimum principle [18, 19], and equivalent consumption minimisation strategy (ECMS) [20, 21]. Intelligent-based strategies are usually formulated by utilising the navigation data and the history of motion for identifying and predicting the driving condition [22, 23]. Such strategies are normally combined with rule- and optimisation-based strategies to resolve the issues associated with the variation of driving condition. A considerable number of EMSs, based on the above-explained techniques and their combinations, have been proposed for FCHEVs in the literature. For instance, in [24], a rule-based EMS is proposed for an fuel cell-supercapacitor-battery vehicle to enhance the lifespan of the power sources by using them in the recommended operational range. Furthermore, the PEMFC output power is maximised by regulating the oxygen ratio. In [25], a quadratic function for the PEMFC energy consumption is defined in a multi-state ECMS to distribute the power among the sources. This strategy has decreased the energy consumption by 2.5% compared to a rule-based power following strategy. In [26], an EMS based on adaptive control theory and fuzzy logic control (FLC) is proposed. The authors suggest updating the membership function values of the FLC as the PEMFC voltage drops owing to degradation after a while. This reflection shows that apart from the importance of considering driving condition and other related factors, it is vital to take into account the state of health (SOH) of the power sources while developing an EMS. Lithium-ion batteries and PEMFCs may undergo various performance drifts in terms of efficiency and power delivery due to the alteration of operating conditions and degradation. In this regard, some attempts have been made to enhance the health awareness of the power sources while developing an EMS. In [27], an EMS based on model predictive control is proposed in which the objective function considers the hydrogen consumption as well as the degradation of both PEMFC and battery. Similarly, in [28–30], a degradation model has been used for each of PEMFC stack and battery pack to prevent the proposed EMSs from mismanagement due to the performance
drifts of these power sources. However, the issue with this line of work is that degradation and ageing mechanisms are highly complicated phenomena to be modelled. Moreover, the variation of the operating conditions, such as humidity and ambient temperature, which are not considered in the model of the power sources can change their power delivery capacity leading to the malfunction of the EMS. To avoid these issues, some attempts have been made to combine the extremum seeking methods, which search an optimal operating point by using a periodic perturbation signal, with the EMS design in FCHEV [31, 32]. The shortfall of the extremum seeking methods is that they are not suitable for simultaneous exploration of several points, such as maximum power and efficiency, as a particular search line is needed for each sought characteristic. This problem can be sorted out by online updating of the power source models using recursive filters and obtaining the required characteristics while the vehicle is under operation. In [33–35], recursive filters, such as Kalman filter (KF) and recursive least square, are employed to update the parameters of the PEMFC model online. Afterwards, the proposed EMSs are fed with the present-state characteristics of the PEMFC, including maximum power and efficiency points, to perform the power distribution with complete awareness of the PEMFC realistic characteristics. The authors have shown that the classical strategies which utilise fixed maximum power and efficiency points of the PEMFC stack are not very functional when the PEMFC goes under degradation. However, one important factor that has not been considered in these works is the online adaptation of the battery pack model to the real conditions. In this regard, unlike the discussed similar studies, this paper puts forward an EMS based on QP for a FCHEV considering the online updating of both the PEMFC model and battery pack. The online adaptation of the models prevents the EMS from malfunction owing to the performance drifts of the power sources. To show the importance of the online modelling in EMS formulation, the influence of the power sources’ performance drifts over the hydrogen consumption of the FCHEV is scrutinised for different cases. The rest of the paper is organised as follows. Section 2 describes the powertrain modelling of the FCHEV. Section 3 deals with the online identification of power sources. Section 4 explains the EMS development. The obtained results from the EMS are discussed in Section 5. Finally, a conclusion is given in Section 6.
2 Powertrain modelling
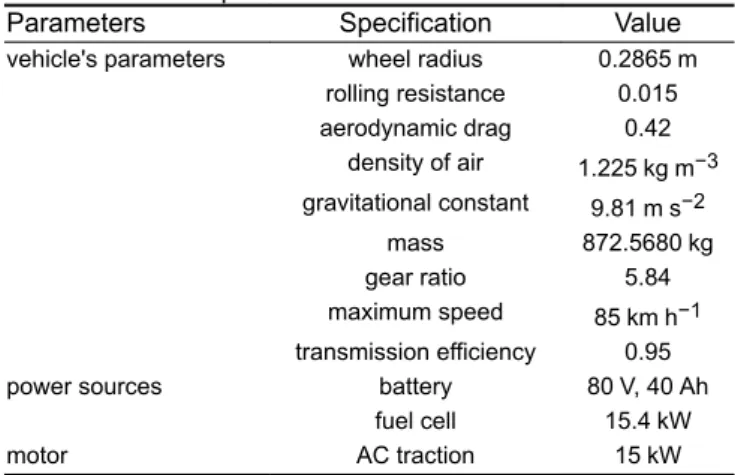
The utilised vehicle model in this study is an electrified vehicle equipped with a single ratio gearbox, a differential and two driven wheels [36]. The powertrain of this vehicle consists of a 15 kW induction motor, a lithium iron phosphate (LiFePO4) battery pack, and a PEMFC stack. The maximum speed of this vehicle is 85 km h−1 and its main specifications are listed in Table 1. Fig. 1 schematically represents the powertrain configuration modelling of this vehicle for the purpose of this work. The required power at the wheels is estimated based on the longitudinal dynamics, including aerodynamic drag, rolling resistance, and grade forces [37]. The
required power is then demanded from the downstream components step by step until it reaches the power bus. Equation (1) calculates the road resistance force, where Fr is the rolling resistance force, Fa is the aerodynamic drag force, Fg is the grade force, v is the vehicle speed, mv is the vehicle mass, ρ is the air density, A is the frontal area of the vehicle, g is the gravitational acceleration, Cx is the aerodynamic drag coefficient, Cr is the rolling resistance coefficient, and α is the grade angle. It should be noted that the simulation in this paper will be done for a flat road
Ft= v mvdtv(t) + Fd a(t) + Fr(t) + Fg(t) (1) Fa= 0.5ρACxv2
Fg= mvgsin(α) Fr= mvCrgcos(α)
(2)
The requested power is obtained as
Preq= Ft(t)v (3)
Pmotor= Preq/Eff (4)
Pbus= Pmotor/ηConverterηDC/AC (5) where Preq is the required power, Pmotor is the electric motor required power, Eff is the electric motor efficiency, Pbus is the bus power to be provided by the battery and FC according to the control strategy, ηDC/AC is the converter efficiency.
2.1 Lithium-ion battery model
An electrical circuit network (ECN) named 1RC Thevenin model is employed as the battery cell model [38]. This model comprises a voltage source in series with a single resistance which represents the cell internal resistance and a parallel resistance capacitor which represents the cell polarisation effect. The model is shown in Fig. 2, where Vbat is the terminal voltage, OCV is the open-circuit voltage, Ibat is the battery load current, Rs is the internal ohmic
resistance, and Rc and Cc are the equivalent polarisation resistance
and capacitance, respectively.
The governing dynamic equation of the ECN model can be described as
V˙c= Ibat Cc −
Vc
RcCc
Vbat= OCV − Vc(t) − RsIbat
(6)
Vbat= OCV + (Rs+ Rc)Ibat− RcCcdvdt + Rbat sRcCcdIdtbat (7) Table 1 FCHEV parameters
Parameters Specification Value
vehicle's parameters wheel radius 0.2865 m rolling resistance 0.015 aerodynamic drag 0.42 density of air 1.225 kg m−3 gravitational constant 9.81 m s−2 mass 872.5680 kg gear ratio 5.84 maximum speed 85 km h−1 transmission efficiency 0.95 power sources battery 80 V, 40 Ah
fuel cell 15.4 kW motor AC traction 15 kW
The state of charge (SOC) of battery is also calculated using Coulomb counting method [39]:
SOCbat= SOCinit− 1003600Q
bat
∫
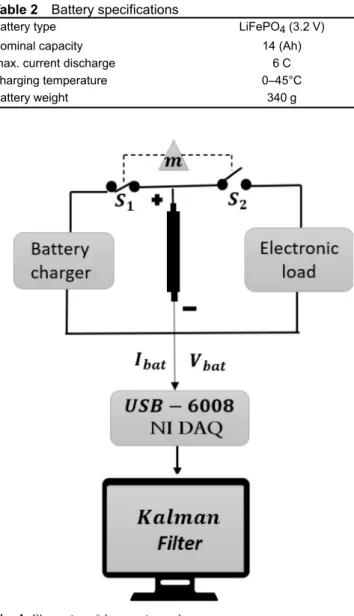
Ibatdt, 0 < SOCbat< 1 (8) where SOCinit is the initial SOC of the battery, Ibat is the battery current, and Qbat is the maximum battery capacity. The battery pack comprises three parallel cell strings. Each string also includes 25 cells connected in series. Table 2 shows the employed lithium-ion cell specifications. For the purpose of this study, two battery models, namely new and degraded, are required to investigate the effect of battery ageing on the EMS performance. In this respect, the model based on the specified characteristics in Table 2 is considered as the new battery model. Regarding the degraded battery, based on which the degraded model is built, 20% capacity fade and 100% increase in the internal resistance are considered. Therefore, the SOC calculation in these scenarios will be based on the new and degraded battery characteristics. The cell parameters, including the OCV, internal resistance (Rs), polarisation resistance(Rc), and polarisation capacitance (Cc), are identified through an
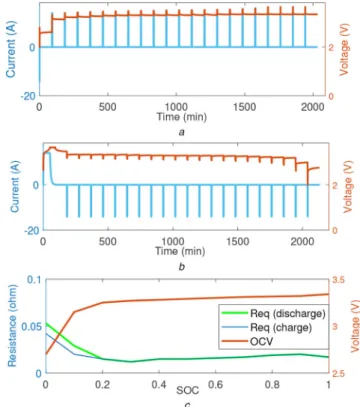
online model identification approach. To do that, the cell is subjected to extensive charge tests during which the cell current and the terminal voltage are measured. Fig. 3 illustrates the laboratory test setup. Fig. 4 also depicts the schematic diagram of the experimental setup. The test setup comprises a climate chamber in which the battery cell's temperature is controlled. To extract the required characteristics of the battery to be used as the reference for validating the online estimation of the 1RC Thevenin model parameters, a pulse charge and discharge test has been done. This test allows characterising the battery voltage response (cell dynamics) at various SOC levels [40]. To perform these pulse tests, a charged cell has been subjected to 21 discharge pulses at 1 C rate. Subsequently, after an hour of rest, the discharged cell has been charged using 21 charge pulses at 1 C rate. These tests have been conducted at 25°C. Fig. 5 demonstrates the cell current and the terminal voltage measurements during the complete pulse discharge and charge experimental tests. The collected experimental data are used with a sampling time of 1 s to validate
the effectiveness of the KF. Moreover, the extracted relationship of the battery SOC with each of OCV, internal resistance changes in charge and internal resistance changes in discharge are shown in Fig. 5c.
2.2 PEMFC model
The existing PEMFC models in the literature fall into three categories of black box, grey box, and white box [31–36, 38]. The white box models are based on the system differential equations and can be used when the detailed parameters of the system are available. On the contrary, the black box models are based on input–output experimental data and do not go through the details of physical phenomena interpretations. Fuzzy logic and neural network models fall into this category. The grey box models, also known as semi-empirical models, are based on the polarisation behaviour of PEMFCs, easy to implement, and effective to be used for designing EMSs [41]. In this paper, a PEMFC semi-empirical model, proposed by Squadrito et al. [42], is utilised to emulate the polarisation behaviour of a FCvelocity®-9SSL PEMFC stack technology manufactured by Ballard Power Systems for transportation application. This semi-empirical model has been recommended for the EMS design of FCHEV in several papers [43]. The general formulation of this electrochemical PEMFC model is as follows:
Vst= N[Vo− blog(J) − RinternalJ + αJσln(1 − βJ)] (9) where N is the number of cells, Vst is the output voltage of the stack (V), Vo is the reversible cell potential (V), b is the Tafel slope
Fig. 2 Thevenin 1RC model [38]
Table 2 Battery specifications
battery type LiFePO4 (3.2 V) nominal capacity 14 (Ah) max. current discharge 6 C charging temperature 0–45°C battery weight 340 g
Fig. 3 Battery cell test setup
Fig. 4 Illustration of the experimental setup
(V dec–1), J is the actual current density (A cm–2), R
internal is the cell resistance (cm2 Ω), α is a semi-empirical parameter related to the diffusion mechanism (V cm2 A–1), σ (between 1 and 4) is a dimensionless number which is related to the water flooding phenomena, and β is the inverse of the limiting current density (cm2 A–1). As reported in Table 3, the utilised PEMFC in this paper has a maximum current of 300 A, and its active area is considered to be 285.5 cm2 [44] which yields the value of 0.951 cm2 A–1 for β. V
o, b, Rinternal, and α will be estimated by the KF, explained in Section 3. The characteristics of the utilised PEMFC are shown in Table 3.
The power of the PEMFC system (Pfc) is obtained by considering the losses from the balance of plant as [45, 46]
Pfc= (Pst− Pcomp− Pfan) (10) Pcomp= ηcomp−1 WaircpTamb((Pca/Pamb)(((γ− 1)/γ) − 1) (11) Pst= VstIst (12) Wair= λWo2/ χo2 (13) Wo2= Mo2Nfcifc/2F (14) Po2= 0.2Pca (15) PH2= 0.99Pan (16) Pca= a1+ a2Ist+ a3Ist2+ a4Ist3 (17) Pan= Pca+ 20, 000 (18) where Pcomp is the consumed power by the compressor (W), Pca is the pressure in the cathode side (bar), Pfan is the consumed power by the FC fan (200 W), ηcomp is considered as the average compressor efficiency (0.70), Wair is the rate of used air (g s–1), cp is the air specific heat capacity (1005 J kg–1), P
amb is the ambient pressure (bar), γ is the ratio of specific heats of air (1.4), λ is the oxygen excess ratio which is 2, Wo2 is the oxygen consumption rate
(g s–1), χ
o2 is the oxygen mass fraction (0.233), Mo2 is oxygen
molar mass (32 g mol–1), F is the Faraday constant, P an is the pressure in the anode side (bar), Ist is the current of the stack (A), Pst is the power of the stack (W), and ai (i = 1…4) are the
experimentally obtained coefficients, described in [46]. The hydrogen flow (qH2) is calculated based on an experimental
formula as below [47]:
qH2= 0.00696IstN (19)
Based on the described equations, the efficiency of the FC system is calculated considering the power losses of the auxiliaries:
ηsys= (Pfc− Pcomp− Pfan)/(qH2HHV) (20)
where the generated hydrogen power is the product of hydrogen flow and the high heating value of hydrogen (HHV = 286 kj mol– 1). The converter efficiency is also multiplied by the FC system efficiency to know the efficiency in the DC bus.
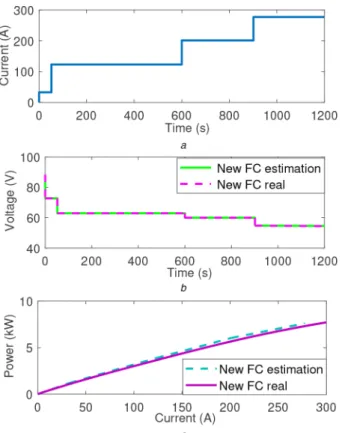
Similar to the battery modelling, new and degraded PEMFC models are required for the purpose of this paper. In this respect, the new PEMFC model is based on the available characteristics in the datasheet of FCvelocity®-9SSL PEMFC stack [47].
However, the degraded PEMFC model is generated using a degradation model proposed in [48]. This degradation model takes into account the voltage drop of the PEMFC stack under constant current load and frequent start-stop switches as below:
Vfc= Vstexp(α, t) − ΔVK (21)
where Vfc is the voltage of the degraded PEMFC, Vst is the stack voltage of the PEMFC, α is a constant coefficient, K is the number of on/off cycles, t is the operation time, and ΔV is the FC voltage drop owing to one start–stop cycle. According to the performed degradation test in [49], ΔV is assumed as 13.79 μV cycle−1. The
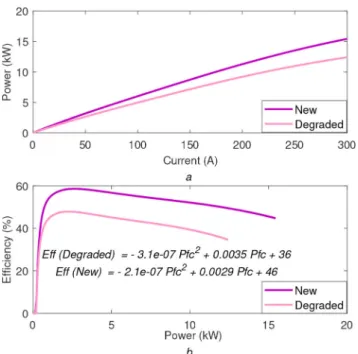
other parameters of the degradation model have been tuned in a way to reach a 20% decline in the maximum power of the PEMFC stack. It should be noted that since the main purpose of this paper is to check the influence of a degraded PEMFC and battery over the performance of the vehicle, the adopted models are adequate enough to meet this objective and developing very accurate degradation models are not necessary. As Fig. 6b shows, the relation of PEMFC system efficiency versus its power can be defined by a quadratic function. Hence, a quadratic formula has been fitted to each curve, as illustrated in Fig. 6b.
3 Online model identification
As mentioned earlier, the characteristics of the FCHEV power sources are time varying since they are influenced by degradation and operating conditions variation. The main purpose of this section is to utilise an identification technique to deal with these uncertainties which can decrease the performance of an EMS in terms of fuel economy. The process of parameter identification can be done offline and online concerning the requirement of the problem. In offline identification, the measured data is first recorded in a data storage, and then they are transferred to a computer for further evaluation by batch processing of data. However, in online identification, which is the main focus of this work, the data is treated as each sample is received by utilising recursive filters. In this work, KF is employed to estimate the
Fig. 5 Battery characteristics
(a) Current and voltage in charge profile, (b) Current and voltage in discharge profile, (c) OCV and equivalent resistors
Table 3 FC stack characteristics
Component Parameter Variable Value
FC number of cells N 80 max power Pfc,max 15.4 kW
max current Ist,max 300 A
power of fan Pfan 200 W
parameters of the battery and PEMFC models online. The online identification of battery model provides the EMS with the battery parameters including internal resistance, polarisation resistance, polarisation capacity, and OCV which are necessary for calculating
the battery response variables and tracking the health state of this power source. Regarding the SOC calculation, the capacity is very important whose identification is not in the scope of this work. However, the battery internal resistance has been employed for the estimation of the battery SOH and its impact on the performance of EMS is studied. The online parameters estimation of the PEMFC model provides the EMS with some significant characteristics, such as maximum efficiency and maximum power points, which have an important role in the performance of the power sharing algorithm. KF has been already suggested for the EMS design of FCHEV due to its robustness [39]. It is perceived as an optimal estimator which concludes the targeted parameters of interest from inaccurate and uncertain observations. Firstly, it estimates the current state variables and then updates them when the next measurement is received. The structure of KF is as follows:
x(t + 1) = F(t + 1 t)x(t) + w(t)
y(t) = H(t)x(t) + v(t) (22) (state-space model)
x^−(t) = F(t t − 1)x^−(t − 1) (23)
(state estimate propagation)
P−(t) = F(t t − 1)P(t − 1)FT(t t − 1) + Q(t − 1) (24) (error covariance propagation)
G(t) = P−HT(t)[H(t)P−(T)HT(t) + R(t)]−1 (25)
(Kalman gain matrix)
x^(t) = x^−(t) + G(t)(y(t) − H(t)x^−(t)) (26)
(state estimate update)
P(t) = (I − G(t)H(t))P−(t) (27)
(error covariance update)
where t is the discrete time, x(t) is the state vector, which is unknown and here it is the parameters vector, x^(t) is the estimate of
the state vector, x^−(t) denotes priori estimate of the state vector,
F(t + 1 t) is the transition matrix, which takes the state vector from time t to time t + 1 and is assumed to be an identity matrix, w(t) is the process noise, y(t) is the output, H(t) is the measurement matrix, v(t) is the measurement noise, P(t) is the error covariance matrix, Q(t) is the process noise covariance matrix, G(t) is the Kalman gain, R(t) is the measurement noise covariance matrix, and
I is the identity matrix. Table 4 specifies the state vector and the
measurement matrix for each of the battery and PEMFC models in this work.
3.1 Results analysis
The obtained results from the online identification process are discussed in this section. The estimated characteristics of the battery model using KF are presented in Fig. 7. To avoid the repetition of the results presentation, only the estimated
Fig. 6 Old and new PEMFCs’ characteristics
(a) Power versus current, (b) Efficiency versus power [R2 for Eff (degraded) is 0.98
and for Eff (new) is 0.9789]
Table 4 KF customisation for the identification problem
Operators Symbols PEMFC Battery
state vector x(t) V0, b, Rinternal, α RcCc, −RsRcCc, Rs+ Rc, OCV
measurement vector
H(t) 1, − log j, Jσln(1 − βl) V˙bat, I˙bat, Ibat, 1
transition matrixF(t + 1 t) identity matrix identity matrix measured
output
y(t) measured VFC from the
PEMFC
measured Vbat
from the battery
Fig. 7 Battery parameters in charge profile
(a) Equivalent resistor, (b) Polarisation capacity, (c) OCV, (d) Estimated terminal
voltage
characteristics for charging the battery are illustrated. From Fig. 7a, it is obvious that the estimated equivalent resistor (Rs+ Rc) is in the
same range as the reference points calculated by the following equation introduced in [50]:
Rbat(SOC) = OCV(SOC) −Ibat(SOC)Vbat(SOC) (28) Although this method for determining the reference equivalent resistance is sensitive to the sensors’ noise, it is adequate to provide an estimated range for the battery's resistance to validate
the proposed online parameter identification technique. Fig. 7b shows the evolution of the capacitor element (Cc). The comparison of the estimated OCV and its reference value is shown in Fig. 7c. Fig. 7d represents the estimation of the battery terminal voltage, which confirms the accuracy of the performed identification. Regarding the PEMFC stack, Fig. 8a shows the applied current to the PEMFC system. From Fig. 8b, it can be seen that the output voltage estimation of the stack has been done successfully by a very good accuracy. To show the main use of this PEMFC online estimation in EMS design, Fig. 8c presents the estimated power curve of the stack at 200 s. The maximum power point can be easily extracted from this curve and utilised to update the constraints of the EMS. In fact, such characteristics can be extracted from the power sources online, while the vehicle is under operation, to adapt the performance of the EMS to the present SOH of the power sources.
4 Energy management strategy
Battery and PEMFC system are used to supply the requested power (Preq) from the electric motor side. Consequently, the hydrogen economy of an FCHEV depends to a great extent on the distribution of the power between the PEMFC and the battery. In this paper, the aim of the EMS is to determine an online optimal power split trajectory which maximises the PEMFC efficiency while respecting the limitations of the system:
Preq= ηDC−DCPfc+ PBat (29)
where PBat is the battery power and ηDC−DC is the DC–DC converter efficiency. Fig. 9 shows the employed online EMS in this paper. According to this figure, the parameters of the PEMFC and battery models are estimated online by KF. Afterwards, the required characteristics are extracted from the updated models of the power sources and sent to the power split strategy where a QP algorithm determines the portion of the power which should be supplied by the PEMFC and the remainder is asked from the battery. The relation of PEMFC system efficiency versus its power can be modelled by a quadratic function as
J = max
∑
k = 1 N
α2(k)Pfc2 + α1(k)Pfc(k) + α0(k) (30)
n = tΔt, n ∈ N (31)
where t is the driving cycle duration which is discretised to n time points concerning the time interval (Δt). The defined cost function in (30) can be solved by classical QP method as it is convex in the bounded power range shown in Fig. 6b. However, the following limitations are taken into account to keep the operation of the power sources within a safe zone:
SOCmin⩽ SOCk⩽ SOCmax (32)
PFC,min⩽ Pfc,k⩽ Pfc,max (33) ΔPRise,k− Slewrate,rise⩽ 0 (34) ΔPFall,k− Slewrate,fall⩽ 0 (35) where SOCmin is 50%, SOCmax is 90%, Pfc,min is the maximum efficiency point of the PEMFC extracted from the online identification, Pfc,max is the maximum power point of the PEMFC
determined by the online model, ΔPRise,k is the positive PEMFC
power change, Slewrate,rise is the rising dynamic limitation, ΔPFall,k
is the negative PEMFC power change, and Slewrate,fall is the falling dynamic limitation. A dynamic limitation of 50 W s–1, which means a maximum of 10% of the maximum power per second for rising, and also 30% of the maximum power per second for falling, as suggested in [51], is considered for the operation of the PEMFC
Fig. 8 PEMFC online update
(a) Applied current to the PEMFC, (b) Online voltage estimation, (c) Estimated power
curve at 200 s
stack. It should be noted that as the optimisation variable in (30) is PFC, the battery SOC should be reformulated based on PFC. The SOC calculation in (36) can be represented as
SO˙C(k) = f (SOC(K), P
bat(k)) (36)
where the battery power can be replaced by the difference between requested power and the PEMFC system power as
SO˙C(k) = f (SOC(K), Preq(k) − ηDC−DCPfc(k)) (37) since Preq(k) is obtained by imposing acceleration to the system, (37) can be rewritten in terms of PEMFC power, which is the optimisation variable, by using a new function (F)
SO˙C(k) = F(SOC(K), Pfc(k)) (38) It is worth reminding that the proposed EMS is fed with the updated characteristics of the PEMFC and battery by the help of the developed online models. In this regard, if the battery SOC or PEMFC output power change owing to the variation of temperature and ageing, the online models provide the EMS with the updated characteristics to avoid the mismanagement of the power sources.
5 Results and discussion
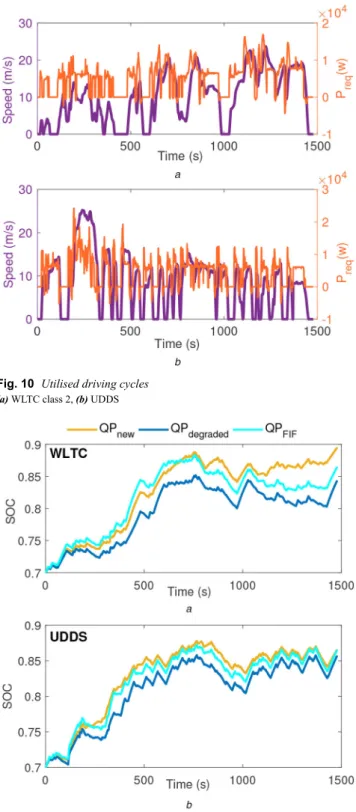
In order to investigate the impact of the battery and FC degradation on the performance of the EMS, three different scenarios under two standard driving cycles, namely urban dynamo meter driving schedule (UDDS) and worldwide harmonised light vehicles test procedures (WLTC) (class 2), are considered in this study. In the first scenario, which is called QPnew in this section, the battery and FC are both in their beginning of life (BOL) and the QP-based EMS is set up for the online identification performed based on the new characteristics of the power sources. In the second scenario, called QPdegraded, the battery and FC are degraded and the EMS updates its policy respecting the degraded models via identification of the parameters of the degraded models. The comparison of the first and second scenarios illustrates the effect of the power sources’ degradation on the hydrogen economy of the studied FCHEV when the proposed EMS is aware of these drifts. In the third scenario, called false input feedback (QPFIF), although both battery and FC are degraded, the EMS is not aware of these performance drifts and still operates using the tuned model parameters based on the BOL's characteristics. The philosophy behind studying this scenario is to highlight how heath unawareness of an EMS can impact the fuel consumption of the investigated FCHEV. In other words, to what extent a false input feedback owing to an inaccurate model identification can affect the EMS performance. The key parameters in the EMS are SOC, maximum efficiency, and maximum power of the PEMFC that are strongly dependent on the identified parameters of the power sources’ models. Fig. 10 shows the two driving cycles utilised in this study and their corresponding requested power profiles (Preq) extracted from the FCHEV model. WLTC driving cycle has a higher average speed (9.92 m s−1) compared to UDDS (8.46 m s −1). However, UDDS contains a lot of start-and-stop cycles. Fig. 11 represents the variation of the battery SOC for each of the driving cycles employed to test the performance of the FCHEV in different scenarios. From this figure, it is clear that the first explained scenario (QPnew) has achieved the highest final SOC followed by QPFIF and QPdegraded scenarios in both of WLTC and UDDS driving cycles. From 0 to almost 500 s, the strategy recharges the battery from 0.7 to a minimum of 0.8. From 500 s to the end of the test, the SOC fluctuates between a high value of 0.8 to a low value of 0.9 in different cases.
Fig. 12 presents the distribution of the drawn power and current from the PEMFC stack in different considered case studies of this work. According to this figure, the developed EMS is able to operate the PEMFC at its highest efficiency point at most of the time during each specific test, and it is in agreement with the
defined cost function for the QP strategy which is supposed to maximise the PEMFC efficiency. Looking more carefully at Fig. 12, it is seen that the PEMFC performs in high efficiency region (from 2200 W to almost 2650 W) for over 800 s during UDDS test, while this duration decreases to <700 s for WLTC. This is due to the different dynamic characteristics of the mentioned driving profiles. As expected, the maximum efficient power region of the new PEMFC (QPnew scenario) is higher than the degraded PEMFC (QPdegraded scenario). However, regarding the QPFIF scenario which utilises the degraded PEMFC, this region is located between the QPnew and QPdegraded scenarios. This is due to the fact that the EMS receives a false input feedback in QPFIF scenario and accordingly attempts to reach the same power level as the new PEMFC. As a result, it reaches a higher power level than the aged PEMFC, which is not the best efficiency region for this
Fig. 10 Utilised driving cycles (a) WLTC class 2, (b) UDDS
Fig. 11 Battery SOC variation for each driving profile (a) WLTC class 2, (b) UDDS
FC and cannot reach the same level as the new PEMFC since it is aged and has more losses than the new one. To better grasp the performance of the proposed EMS, the current allocation between the PEMFC and battery for the case of QPnew is presented in Fig. 13. From this figure, it can be seen that the battery pack absorbs most of the sudden peaks in the requested current.
To completely comprehend the difference between the performance of the studied scenarios, it is vital to compare the archived hydrogen consumption of each particular case. Fig. 14 demonstrates the comparison of the hydrogen consumption for all the considered cases in this paper. As the proposed EMS is real time and the final battery SOCs, shown in Fig. 11, cannot be the same, the battery in both of QPFIF and QPdegraded scenarios has been recharged at the end of each test to reach the same final SOC level
as the QPnew scenario. To recharge the battery at the end of each cycle, the PEMFC is set at its highest efficiency point to perform this recharging step with the minimum hydrogen consumption. Comparison of QPnew and QPdegraded scenarios reveals that as the PEMFC has got aged, the hydrogen consumption has increased by almost 3% for WLTC and 3.2% for UDDS. Moreover, the comparison of QPnew and QPFIF scenarios illustrates that when the EMS is not aware of the health state of the power sources, the hydrogen consumption can increase by almost 14 and 17% in WLTC and UDDS, respectively.
6 Conclusion
This paper explores the performance variation influence of the PEMFC and battery pack owing to ageing over the hydrogen economy of a FCHEV. In this respect, an online parameters estimation procedure based on KF is developed first to track the performance of both power sources in real time. The battery online estimation is validated using the experimental data of a developed setup, and the PEMFC characteristics are gathered from the manufacturer's manual (Ballard FCvelocity®-9SSL). In the second step, an online EMS based on QP is developed with the aim of maximising the PEMFC efficiency while supplying the requested power of the vehicle. The operation of the EMS is evaluated through three scenarios, namely QPnew, QPdegraded, and QPFIF. In the first scenario, an EMS based on QP is developed for the case that both of the power sources are new, and in the second scenario, a QP is formulated for the degraded power sources. The main point here is that the EMS is aware of the health states of the power sources in these two cases and adapts its policy to the current state of the sources by utilising the developed online parameter identification. However, in the third scenario, the QP is designed for a false input feedback case study where the power sources are degraded while the maximum efficiency curve of the PEMFC as well as the other factors, such as battery SOC calculation and PEMFC maximum power point, are not updated considering the health state of the sources. In fact, the QP is unaware of the power sources’ SOH and acts as a health-unconscious strategy in this scenario. The obtained results from the performed analyses reveal that when the power sources become degraded, the hydrogen economy decreases up to 3.2% for the studied vehicle. Furthermore, the performance comparison of QPnew and QPFIF highlights that not updating the characteristics of the power sources can lead to a noticeable hydrogen consumption increase (up to 17%). This paper has provided a proof of concept for the integration of both battery and PEMFC online characteristics estimation in the design of an EMS for a FCHEV. Looking forward, the use of more complex cost functions considering more aspects, such as degradation of the power sources, could be investigated in further studies since they have an important influence on the hydrogen consumption and lifetime of the system. Moreover, the effect of temperature variation on the performance of the EMS and degradation of the power sources can be considered in future endeavours.
Fig. 12 Distribution of the requested power and its corresponding current from the PEMFC in different scenarios
(a) PEMFC power distribution for WLTC class 2, (b) PEMFC current distribution for
WLTC class 2, (c) PEMFC power distribution for UDDS, (d) PEMFC current distribution for UDDS
Fig. 13 Allocation of the requested current between the FC and the battery for the QPnew scenario
(a) Current distribution for WLTC class 2, (b) Current distribution for UDDS
7 References
[1] Karamanev, D., Pupkevich, V., Penev, K., et al.: ‘Biological conversion of hydrogen to electricity for energy storage’, Energy, 2017, 129, pp. 237–245 [2] Zoundi, Z.: ‘Co2 emissions, renewable energy and the environmental kuznets
curve, a panel cointegration approach’, Renew. Sust. Energy Rev., 2017, 72, pp. 1067–1075
[3] Ehsani, M., Gao, Y., Longo, S., et al.: ‘Modern electric, hybrid electric, and fuel cell vehicles’ (CRC Press, USA, 2018)
[4] Samuelsen, S.: ‘The automotive future belongs to fuel cells range, adaptability, and refueling time will ultimately put hydrogen fuel cells ahead of batteries’, IEEE Spectr., 2017, 54, (2), pp. 38–43
[5] Schipper, F., Aurbach, D.: ‘A brief review: past, present and future of lithium ion batteries’, Russ. J. Electrochem., 2016, 52, (12), pp. 1095–1121 [6] Martinez, C.M., Hu, X., Cao, D., et al.: ‘Energy management in plug-in
hybrid electric vehicles: recent progress and a connected vehicles perspective’, IEEE Trans. Veh. Technol., 2016, 66, (6), pp. 4534–4549 [7] Ali, A.M., Söffker, D.: ‘Towards optimal power management of hybrid
electric vehicles in real-time: A review on methods, challenges, and state-of-the-art solutions’, Energies, 2018, 11, (3), p. 476
[8] Sulaiman, N., Hannan, M., Mohamed, A., et al.: ‘Optimization of energy management system for fuel-cell hybrid electric vehicles: issues and recommendations’, Appl. Energy, 2018, 228, pp. 2061–2079
[9] Li, H., Ravey, A., N'Diaye, A., et al.: ‘A review of energy management strategy for fuel cell hybrid electric vehicle’. 2017 IEEE Vehicle Power and Propulsion Conf. (VPPC), Belfort, France, 2017, pp. 1–6
[10] Huang, Y., Wang, H., Khajepour, A., et al.: ‘A review of power management strategies and component sizing methods for hybrid vehicles’, Renew. Sust. Energy Rev., 2018, 96, pp. 132–144
[11] Zhou, W., Yang, L., Cai, Y., et al.: ‘Dynamic programming for new energy vehicles based on their work modes part ii: fuel cell electric vehicles’, J. Power Sources, 2018, 407, pp. 92–104
[12] Zhou, W., Yang, L., Cai, Y., et al.: ‘Dynamic programming for new energy vehicles based on their work modes part i: electric vehicles and hybrid electric vehicles’, J. Power Sources, 2018, 406, pp. 151–166
[13] Zhang, R., Tao, J.: ‘Ga-based fuzzy energy management system for fc/sc-powered hev considering h 2 consumption and load variation’, IEEE Trans. Fuzzy Syst., 2018, 26, (4), pp. 1833–1843
[14] Chen, Z., Wu, Y., Guo, N., et al.: ‘Energy management for plug-in hybrid electric vehicles based on quadratic programming with optimized engine on-off sequence’. IECON 2017-43rd Annual Conf. of the IEEE Industrial Electronics Society, Beijing, People's Republic of China, 2017, pp. 7134– 7139
[15] Chen, Z., Mi, C.C., Xiong, R., et al.: ‘Energy management of a power-split plug-in hybrid electric vehicle based on genetic algorithm and quadratic programming’, J. Power Sources, 2014, 248, pp. 416–426
[16] Koot, M., Kessels, J.T., De-Jager, B., et al.: ‘Energy management strategies for vehicular electric power systems’, IEEE Trans. Veh. Technol., 2005, 54, (3), pp. 771–782
[17] Liu, Y., Li, J., Chen, Z., et al.: ‘Research on a multi-objective hierarchical prediction energy management strategy for range extended fuel cell vehicles’, J. Power Sources, 2019, 429, pp. 55–66
[18] Li, Q., Huang, W., Chen, W., et al.: ‘Regenerative braking energy recovery strategy based on pontryagin's minimum principle for fell cell/supercapacitor hybrid locomotive’, Int. J. Hydrog. Energy, 2019, 44, (11), pp. 5454–5461 [19] Xie, S., Hu, X., Xin, Z., et al.: ‘Pontryagin's minimum principle based model
predictive control of energy management for a plug-in hybrid electric bus’, Appl. Energy, 2019, 236, pp. 893–905
[20] Li, H., Ravey, A., N'Diaye, A., et al.: ‘A novel equivalent consumption minimization strategy for hybrid electric vehicle powered by fuel cell, battery and supercapacitor’, J. Power Sources, 2018, 395, pp. 262–270
[21] Zhang, W., Li, J., Xu, L., et al.: ‘Optimization for a fuel cell/battery/capacity tram with equivalent consumption minimization strategy’, Energy Convers. Manage., 2017, 134, pp. 59–69
[22] Kamal, E., Adouane, L.: ‘Intelligent energy management strategy based on artificial neural fuzzy for hybrid vehicle’, IEEE Trans. Intell. Veh., 2017, 3, (1), pp. 112–125
[23] Kazemi, H., Fallah, Y.P., Nix, A., et al.: ‘Predictive aecms by utilization of intelligent transportation systems for hybrid electric vehicle powertrain control’, IEEE Trans. Intell. Veh., 2017, 2, (2), pp. 75–84
[24] Wang, Y., Sun, Z., Chen, Z.: ‘Energy management strategy for battery/ supercapacitor/fuel cell hybrid source vehicles based on finite state machine’, Appl. Energy, 2019, 254, p. 113707
[25] Yan, Y., Li, Q., Chen, W., et al.: ‘Optimal energy management and control in multimode equivalent energy consumption of fuel cell/supercapacitor of hybrid electric tram’, IEEE Trans. Ind. Electron., 2018, 66, (8), pp. 6065– 6076
[26] Chen, J., Xu, C., Wu, C., et al.: ‘Adaptive fuzzy logic control of fuel-cell-battery hybrid systems for electric vehicles’, IEEE Trans. Ind. Inf., 2016, 14, (1), pp. 292–300
[27] Li, Z., Khajepour, A., Song, J.: ‘A comprehensive review of the key technologies for pure electric vehicles’, Energy, 2019, 182, pp. 824–839 [28] Li, H., Ravey, A., N'Diaye, A., et al.: ‘Online adaptive equivalent
consumption minimization strategy for fuel cell hybrid electric vehicle considering power sources degradation’, Energy Convers. Manage., 2019,
192, pp. 133–149
[29] Wang, Y., Moura, S.J., Advani, S.G., et al.: ‘Optimization of powerplant component size on board a fuel cell/battery hybrid bus for fuel economy and system durability’, Int. J. Hydrog. Energy, 2019, 44, (33), pp. 18283–18292 [30] Wang, Y., Moura, S.J., Advani, S.G., et al.: ‘Power management system for a
fuel cell/battery hybrid vehicle incorporating fuel cell and battery degradation’, Int. J. Hydrog. Energy, 2019, 44, (16), pp. 8479–8492 [31] Zhou, D., Al-Durra, A., Matraji, I., et al.: ‘Online energy management
strategy of fuel cell hybrid electric vehicles: a fractional-order extremum seeking method’, IEEE Trans. Ind. Electron., 2018, 65, (8), pp. 6787–6799 [32] Zhou, D., Ravey, A., Al-Durra, A., et al.: ‘A comparative study of extremum
seeking methods applied to online energy management strategy of fuel cell hybrid electric vehicles’, Energy Convers. Manage., 2017, 151, pp. 778–790 [33] Ettihir, K., Boulon, L., Agbossou, K.: ‘Optimization-based energy
management strategy for a fuel cell/battery hybrid power system’, Appl. Energy, 2016, 163, pp. 142–153
[34] Fernandez, A.O.M., Kandidayeni, M., Boulon, L., et al.: ‘An adaptive state machine based energy management strategy for a multi-stack fuel cell hybrid electric vehicle’, IEEE Trans. Veh. Technol., 2019, 69, (1), pp. 220–234 [35] Kandidayeni, M., Fernandez, A.O.M., Khalatbarisoltani, A., et al.: ‘An online
energy management strategy for a fuel cell/battery vehicle considering the driving pattern and performance drift impacts’, IEEE Trans. Veh. Technol., 2019, 68, (12), pp. 11427–11438
[36] Ghaderi, R., Kandidayeni, M., Soleymani, M., et al.: ‘Investigation of the battery degradation impact on the energy management of a fuel cell hybrid electric vehicle’. 2019 IEEE Vehicle Power and Propulsion Conf. (VPPC), Hanoi, Vietnam, 2019, pp. 1–6
[37] Kandidayeni, M., Macias, A., Boulon, L., et al.: ‘Investigating the impact of ageing and thermal management of a fuel cell system on energy management strategies’, Appl. Energy, 2020, 274, p. 115293
[38] Xia, B., Lao, Z., Zhang, R., et al.: ‘Online parameter identification and state of charge estimation of lithium-ion batteries based on forgetting factor recursive least squares and nonlinear kalman filter’, Energies, 2018, 11, (1), p. 3
[39] Yuan, J., Yang, L., Chen, Q.: ‘Intelligent energy management strategy based on hierarchical approximate global optimization for plug-in fuel cell hybrid electric vehicles’, Int. J. Hydrog. Energy, 2018, 43, (16), pp. 8063–8078 [40] Huria, T., Ceraolo, M., Gazzarri, J., et al.: ‘Simplified extended kalman filter
observer for soc estimation of commercial power-oriented lfp lithium battery cells’, 2013. Available at https://doiorg/104271/2013-01-1544
[41] Kandidayeni, M., Macias, A., Amamou, A., et al.: ‘Overview and benchmark analysis of fuel cell parameters estimation for energy management purposes’, J. Power Sources, 2018, 380, pp. 92–104
[42] Squadrito, G., Maggio, G., Passalacqua, E., et al.: ‘An empirical equation for polymer electrolyte fuel cell (pefc) behaviour’, J. Appl. Electrochem., 1999,
29, (12), pp. 1449–1455
[43] Ettihir, K., Boulon, L., Becherif, M., et al.: ‘Online identification of semi-empirical model parameters for pemfcs’, Int. J. Hydrog. Energy, 2014, 39, (36), pp. 21165–21176
[44] Liso, V., Nielsen, M.P., Kaer, S.K., et al.: ‘Thermal modeling and temperature control of a pem fuel cell system for forklift applications’, Int. J. Hydrog. Energy, 2014, 39, (16), pp. 8410–8420
[45] Oruganti, P.S., Ahmed, Q., Jung, D.: ‘Effects of thermal and auxiliary dynamics on a fuel cell based range extender’. SAE Technical Paper, 2018 [46] Zhao, X., Li, Y., Liu, Z., et al.: ‘Thermal management system modeling of a
water-cooled’, Int. J. Hydrog. Energy, 2015, 40, (7), pp. 3048–3056 [47] Ballard: ‘FCvelocity-9SSL V4.3’, 2017
[48] Yue, M., Jemei, S., Zerhouni, N., et al.: ‘Towards the energy management of a fuel cell/battery vehicle considering degradation’. 2017 IEEE Vehicle Power and Propulsion Conf. (VPPC), Belfort, France, 2017, pp. 1–6
[49] Chen, H., Pei, P., Song, M.: ‘Lifetime prediction and the economic lifetime of proton exchange membrane fuel cells’, Appl. Energy, 2015, 142, pp. 154–163 [50] Chaoui, H., Gualous, H.: ‘Online parameter and state estimation of
lithium-ion batteries under temperature effects’, Electr. Power Syst. Res., 2017, 145, pp. 73–82
[51] Carignano, M., Roda, V., Costa-Castelló, R., et al.: ‘Assessment of energy management in a fuel cell/battery hybrid vehicle’, IEEE access, 2019, 7, pp. 16110–16122