Cell-Trappable Fluorescent Probes for
Nitric Oxide Visualization in Living Cells
The MIT Faculty has made this article openly available.
Please share
how this access benefits you. Your story matters.
Citation
Pluth, Michael D., Lindsey E. McQuade, and Stephen J. Lippard.
“Cell-Trappable Fluorescent Probes for Nitric Oxide Visualization in
Living Cells.” Organic Letters 12.10 (2010) : 2318-2321.
As Published
http://dx.doi.org/10.1021/ol1006289
Publisher
American Chemical Society
Version
Author's final manuscript
Citable link
http://hdl.handle.net/1721.1/64765
Terms of Use
Article is made available in accordance with the publisher's
policy and may be subject to US copyright law. Please refer to the
publisher's site for terms of use.
Cell-Trappable Fluorescent
Probes for Nitric Oxide
Visualization in Living Cells
Michael D. Pluth, Lindsey E. McQuade, Stephen J. Lippard*
Department of Chemistry, Massachusetts Institute of Technology, Cambridge, Massachusetts 02139Received Date (will be automatically inserted after manuscript is accepted)
ABSTRACT
Two new cell-trappable fluorescent probes for nitric oxide (NO) are reported based on either incorporation of hydrolyzable esters or conjugation to aminodextran polymers. Both probes are highly selective for NO over other reactive oxygen and nitrogen species (RONS). The efficacy of these probes for the fluorescence imaging of nitric oxide produced endogenously in Raw 264.7 cells is demonstrated.
The selective detection of nitric oxide (NO) in living systems has attracted much interest since the discovery that NO is the endothelium-derived relaxing factor (EDRF).1 Nitric oxide is an active signal-inducing
molecule in the immune, cardiovascular, and nervous systems, initiating cascades that promote smooth muscle dilation by activating soluble guanylyl cyclase.2 More
recently, NO has been implicated to modulate synaptic activity in the CNS, where it may play a role in signal transduction in the olfactory bulb.3 Numerous
pathological conditions including carcinogenesis, septic shock, inflammation, and neurodegradation have been associated with the misregulation of NO production.4
Understanding the multiple biological roles of NO will benefit from the development of tools for its selective detection in vivo. Strategies for monitoring NO have
relied on a variety of techniques, including the application of fluorescent probes.5 Here we describe fluorescent
probes that react directly and specifically with NO that are cell-trappable by means of either ester functionalization or dextran conjugation.
The scaffold of these NO probes is based on that of CuFL15 (Scheme 1), previously reported to detect
endogenously produced nitric oxide in mammalian and bacterial cells.6 The CuII fluorescein-based NO probe is
formed in situ by treating FL15 with one equiv of CuCl2.
When non-emissive CuFL15 reacts with NO, Cu(II) is
reduced to Cu(I) with concomitant N-nitrosation of the secondary amine of the ligand to produce the fluorescent species, FL15-NO (Scheme 1). CuFL15 is minimally
cytotoxic, cell-membrane permeable, and selective for NO over other biologically relevant reactive oxygen and
nitrogen species (RONS). One limitation of CuFL15,
however, is that it cannot be trapped within a cell. Under conditions of continual media perfusion, the probe readily diffuses out of cells after initial loading, rendering it ineffective for many biological experiments.
Scheme 1. Fluorescence turn-on for the FL15 NO probe.
The first strategy that we applied to impart cell trappability to FL15 was to incorporate an ester moiety on
the quinoline ring, yielding FL1E. The esterified version of this probe is cell membrane permeable until cytosolic esterases cleave the ester to yield a carboxylic acid, FL1A, which is negatively charged at physiological pH and prohibits re-crossing of the cell membrane.7 A second
strategy was to append the FL15 probe to a
macromolecule, specifically aminodextran, which because of its high molecular weight can gain entry to cells by endocytotic pathways.8 Dextrans are hydrophilic
polysaccharides with low toxicity and low reactivity that are used as carriers for fluorescent probes.9 Their
α-1,6-polyglucose linkages cannot be cleaved by most intracellular glycosidases, rendering dextran conjugates stable in cells. We attached the FL15 derivative, FL1A, to
amino dextran using an acid linker on the quinoline ring for ease of coupling as well as minimal perturbation of the photophysical properties of the fluorophore.
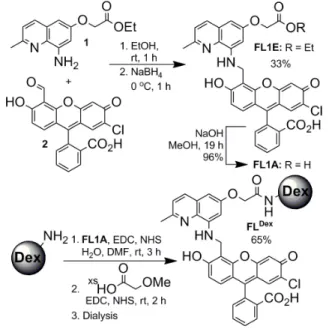
The syntheses of FL1E, FL1A, and FLDex are outlined
in Fig. 1. The Schiff’s base formed by condensation of aminoquinoline 110 with fluorescein aldehyde 211 in
ethanol was reduced with NaBH4 to afford FL1E.
Subsequent hydrolysis under basic conditions yielded the corresponding acid, FL1A. The photophysical properties of FL1A and FL1E are similar to those of FL15, as shown
in Table 1. The dextran conjugate, FLDex, was prepared by
in situ formation of the NHS-ester of FL1A followed by EDC coupling to 10 kDa aminodextran (2.6 amine/dextran). Optimization of the amide coupling efficiency as well as the fluorescence turn-on with NO of the product conjugate revealed that two equiv of FL1A per primary amine of the dextran provides optimal coupling. Although the coupling was mainly complete, capping excess primary amines with 2-methoxyacetic acid resulted in an enhanced fluorescence turn-on with NO by comparison to the uncapped version. The final conjugate FLDex was purified by dialysis.
Figure 1. Preparation of FL1E, FL1A, and FLDex.
Titrations of the various ligands with CuCl2 revealed
that both FL1E and FL1A form 1:1 Cu:ligand complexes, whereas FLDex binds 1.7 equiv of CuII per FL1A unit,
probably due to non-specific Cu-binding to the dextran backbone. Using the copper stoichiometry determined by titration, exposure of solutions of the probes generated in situ to excess NO under anaerobic conditions led to an immediate fluorescence enhancement with a concomitant bathochromic shift of the emission maxima (Fig. 2 and Table 1). These results are consistent with formation of the N-nitrosoamine products.
Figure 2. Fluorescence turn-on of CuFL1A (1 µM FL1A, 1 µM CuCl2, 1300 equiv NO, 50 mM PIPES, 100 mM KCl, pH 7, 37 oC). Inset: Time dependence of fluorescence turn-on.
Table 1. Photophysical properties of FL15, FL1E, and FL1A.a
absorption λmax (nm), ε x (104 M-1 cm-1) emission λmax (nm), Φb (%)
unbound + Cu(II)c unbound + Cu(II)c + NOd dynamic rangee
FL1512 504, 4.2 ± 0.1 499, 4.0 ± 0.1 520, 7.7 ± 0.2 520, nr 526, 58 ± 2 16 ± 1
FL1E 506, 2.08 ± 0.05 500, 0.77 ± 0.01 520, 2.57 ± 0.02 520, 3.37 ± 0.08 526, 22 ± 1f 5.4 ± 0.3
FL1A 504, 6.00 ± 0.07 499, 1.94 ± 0.08 521, 2.37 ± 0.08 520, 2.8 ± 0.2 527, 37 ± 2f 11.3 ± 0.1
a Spectroscopic measurements were performed in 50 mM PIPES and 100 mM KCl buffer at pH 7.0. b Quantum yields are based on fluorescein (Φ = 0.95 in
0.1 N NaOH). c One equiv of CuCl2 was added. d 1300 equiv of NO, 60 min at 37 oC. e Dynamic Range = INO/Io. f Generated in situ.
The relative fluorescence enhancement of CuFL1A when exposed to excess NO was 11.3 ± 0.1 fold, which is similar to that of CuFL15 (16 ± 1) (Fig. 2).13 Although the
fluorescence enhancement of CuFL1E is somewhat diminished (5.4 ± 0.3), it is sufficient to be visualized by spectroscopy and microscopy. Because CuFL1E is not the biologically relevant sensing species, it is therefore not a liability that it is less bright than CuFL1A. CuFLDex
exhibited an intermediate, 6.9 ± 0.8 fold, fluorescence enhancement. This result may be due self-quenching by adjacent fluorophores on the dextran backbone. Treatment of any of the probes with NO under anaerobic conditions in the absence of CuII did not result in
fluorescence turn-on. CuFL1E, CuFL1A and CuFLDex all
turn on with NO and NO donors such as S-nitroso-N-acetyl-DL-penicillamine (SNAP), but are only minimally responsive to other physiologically relevant RONS NO2–,
NO3–, ClO–, H2O2, ONOO–, HNO and NO2 (Fig. 3).
Figure 3. Comparison of the selectivity for RONS with CuFL1E, CuFL1A, and CuFLDex
. (50 mM PIPES, 100 mM KCl, pH 7, 37 o
C, 60 min, 100 equiv RONS, 1300 equiv NO).
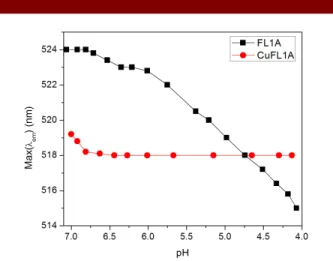
Because FLDex enters cells through endocytosis, we
wanted to confirm that the FL1A platform bound CuII at a
pH similar to that encountered in the endosomes.14 In
order to confirm that the CuFLDex is stable under these
conditions and that copper would not dissociate at the low pH of the endosome, FL1A and CuFL1A were used as a model and their UV-vis and fluorescence spectra were
monitored as a function of pH. For FL1A, as the pH decreased, the fluorescence maxima blue-shifted; however, for CuFL1A, no shift in maxima was observed from pH 6.5 – 4.0, indicating stability of the copper complex at the acidic pH most likely encountered in the endosome (Fig. 4).
Figure 4. pH dependence of λmax(emission) for FL1A and
CuFL1A (5 µM FL, 100 mM KCl, 25 oC)
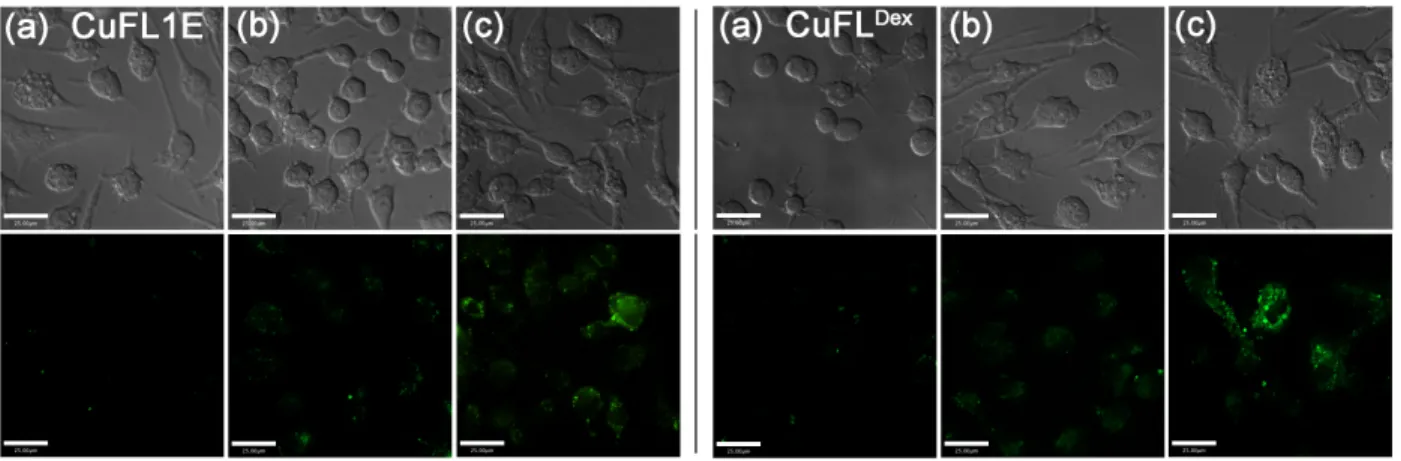
In order to evaluate the efficacy of the probes in live cells, Raw 264.7 murine macrophages, which produce NO from iNOS when induced in response to external activators, were investigated.15 In these cells, NO
production is stimulated by addition of endotoxins, such as lipopolysaccharide (LPS), and cytokines, such as interferon-γ (INF-γ). Raw 264.7 macrophages were therefore treated with LPS and INF-γ, incubating with either CuFL1E or CuFLDex for 14 h prior to imaging. In
both cases, an increase in fluorescence was observed (Fig. 5) confirming turn-on with NO or other biologically relevant NO-transfer agents such as S-nitrosothiols.
Cells that were incubated with the probes without LPS or INF-γ did not display increased fluorescence (Fig. 5). Similarly, stimulation with LPS and INF-γ and treatment with L-NG-nitroarginine (L-NNA), an iNOS inhibitor (K
i
= 4.4 µM for murine macrophages),16 showed little
fluorescence enhancement. These experiments
Figure 5. Visualization of NO produced endogenously in Raw 264.7 cells using CuFL1E (left) and CuFLDex (right) after stimulation with
LPS and INF-γ for 14 h. Top: DIC images, Bottom: fluorescence. (a) Probe only, (b) Probe, LPS, INF-γ, and L-NNA (iNOS inhibitor), (c) Probe, LPS, and INF-γ. [Probe] = 4 µM, [LPS] = (1.25 µg/mL), [INF-γ] = (625 – 6250 U/mL), [L-NNA] = 10 µM. Scale bars = 25 µm.
produced in vivo. Control experiments demonstrated that CuFL1A is not cell permeable (Fig. S1). In order to test the cell trappability of CuFL1E and CuFLDex, Raw 264.7
macrophages were stimulated with LPS and IFN-γ and then incubated with the probes for 14 h. The cells were washed and imaged in the microscope incubator, where minimal change in fluorescence intensity was observed over the course of 30 min, confirming cell trappability in contrast to the parent FL15 scaffold (Fig. S2-S4).
Subcellular localization studies using nuclear and mitochondrial dyes indicated that CuFL1E localizes to the mitochondria whereas CuFLDex is minimally localized
(Fig. S5, S6).
In conclusion, we have prepared two new sensors of the FL15 family that impart cell trappability. Both probes
maintain sufficient fluorescence to allow for imaging of NO produced endogenously in live Raw 264.7 cells.
Acknowledgment This work was supported by the
NSF grant CHE-0907905. MDP thanks the NIH for a postdoctoral fellowship (5 F32 GM085930). The authors acknowledge Gloria Odusote (MIT) for assistance with dextran assays. The content is solely the responsibility of the authors and does not necessarily represent the official views of the National Institute Of General Medical Sciences or the National Institutes of Health
Supporting Information Available Experimental
details, spectroscopic data, and diffusion/localization cell imaging information. This information is available free of charge via the Internet at http://pubs.acs.org
1. Ignarro, L. J.; Buga, G. M.; Wood, K. S.; Byrns, R. E.; Chaudhuri, G., Proc. Natl. Acad. Sci. U. S. A. 1987, 84, 9265-9269; Palmer, R. M. J.; Ferrige, A. G.; Moncada, S., Nature 1987, 327, 524-526.
2. Furchgott, R. F., Angew. Chem., Int. Ed. 1999, 38, 1870-1880; Ignarro, L. J., Angew. Chem., Int. Ed. 1999, 38, 1882-1892; Murad, F.,
Angew. Chem., Int. Ed. 1999, 38, 1857-1868.
3. Kendrick, K. M.; Guevara-Guzman, R.; Zorrilla, J.; Hinton, M. R.; Broad, K. D.; Mimmack, M.; Ohkura, S., Nature 1997, 388, 670-674;
Lowe, G.; Buerk, D. G.; Ma, J.; Gelperin, A., Neuroscience 2008, 153, 842-850.
4. Ignarro, L. J., Nitric Oxide Biology and Pathobiology. Academic Press: San Diego, 2000.
5. Nagano, T., J. Clin. Biochem. Nut. 2009, 45, 111-124; Hetrick, E. M.; Schoenfisch, M. H., Ann. Rev. Anal. Chem. 2009, 2, 409-433; Ye, X. Y.; Rubakhin, S. S.; Sweedler, J. V., Analyst 2008, 133, 423-433; Wardman, P., Free Radical Biol. Med. 2007, 43, 995-1022; Bedioui, F.; Villeneuve, N., Electroanalysis 2003, 15, 5-18; Kim, J. H.; Heller, D. A.; Jin, H.; Barone, P. W.; Song, C.; Zhang, J.; Trudel, L. J.; Wogan, G. N.; Tannenbaum, S. R.; Strano, M. S., Nat. Chem. 2009, 1, 473-481.
6. Lim, M. H.; Xu, D.; Lippard, S. J., Nat. Chem. Biol. 2006, 2, 375-380; Parihar, M. S.; Parihar, A.; Chen, Z. H.; Nazarewicz, R.; Ghafourifar, P., Biochim. Biophys. Acta, BBA 2008, 1780, 921-926; Parihar, M. S.; Parihar, A.; Villamena, F. A.; Vaccaro, P. S.; Ghafourifar, P., Biochem. Biophys. Res. Commun. 2008, 367, 761-767; Gusarov, I.; Shatalin, K.; Starodubtseva, M.; Nudler, E., Science 2009, 325, 1380-1384; Gusarov, I.; Starodubtseva, M.; Wang, Z. Q.; McQuade, L.; Lippard, S. J.; Stuehr, D. J.; Nudler, E., J. Biol. Chem.
2008, 283, 13140-13147; Patel, B. A.; Moreau, M.; Widom, J.; Chen,
H.; Yin, L. F.; Hua, Y. J.; Crane, B. R., Proc. Natl. Acad. Sci. U. S. A.
2009, 106, 18183-18188; Shatalin, K.; Gusarov, I.; Avetissova, E.;
Shatalina, Y.; McQuade, L. E.; Lippard, S. J.; Nudler, E., Proc. Natl.
Acad. Sci. U. S. A. 2008, 105, 1009-1013.
7. Tsien, R. Y., Nature 1981, 290, 527-528; Izumi, S.; Urano, Y.; Hanaoka, K.; Terai, T.; Nagano, T., J. Am. Chem. Soc. 2009, 131, 10189-10200.
8. Berthiaume, E. P.; Medina, C.; Swanson, J. A., J. Cell Biol. 1995, 129, 989-998.
9. Sonawane, N. D.; Thiagarajah, J. R.; Verkman, A. S., J. Biol.
Chem. 2002, 277, 5506-5513; Henry, R. M.; Hoppe, A. D.; Joshi, N.;
Swanson, J. A., J. Cell Biol. 2004, 164, 185-194; Lencer, W. I.; Weyer, P.; Verkman, A. S.; Ausiello, D. A.; Brown, D., Am. J. Physiol. 1990, 258, C309-C317; Clayton, E. L.; Cousin, M. A., J. Neurosci. Methods
2009, 185, 76-81.
10. Fahrni, C. J.; O'Halloran, T. V., J. Am. Chem. Soc. 1999, 121, 11448-11458.
11. Burdette, S. C.; Frederickson, C. J.; Bu, W. M.; Lippard, S. J., J.
Am. Chem. Soc. 2003, 125, 1778-1787; Nolan, E. M.; Burdette, S. C.;
Harvey, J. H.; Hilderbrand, S. A.; Lippard, S. J., Inorg. Chem. 2004, 43, 2624-2635.
12. Lim, M. H.; Wong, B. A.; Pitcock, W. H.; Mokshagundam, D.; Baik, M. H.; Lippard, S. J., J. Am. Chem. Soc. 2006, 128, 14364-14373.
13. For comparison with CuFL15, 1300 equiv of NO were used.
Addition of 100 equiv of NO yielded similar results; see Table S1. 14. Murphy, R. F.; Powers, S.; Cantor, C. R., J. Cell Biol. 1984, 98, 1757-1762; van Weert, A. W. M.; Dunn, K. W.; Geuze, H. J.; Maxfield, F. R.; Stoorvogel, W., J. Cell Biol. 1995, 130, 821-834.
15. Bogdan, C., Nat. Immunol. 2001, 2, 907-916.
16. Furfine, E. S.; Harmon, M. F.; Paith, J. E.; Garvey, E. P.,