published as:
Single electron yields from semileptonic charm and bottom
hadron decays in Au+Au collisions at sqrt[s_{NN}]=200
GeV
A. Adare et al. (PHENIX Collaboration)
Phys. Rev. C 93, 034904 — Published 7 March 2016
DOI:
10.1103/PhysRevC.93.034904
collisions at
s
N N= 200 GeV
2
A. Adare,13 C. Aidala,39, 44 N.N. Ajitanand,63 Y. Akiba,57, 58 R. Akimoto,12 J. Alexander,63 M. Alfred,23
3
K. Aoki,32, 57 N. Apadula,28, 64 Y. Aramaki,12, 57 H. Asano,35, 57 E.C. Aschenauer,7E.T. Atomssa,64 T.C. Awes,53
4
B. Azmoun,7 V. Babintsev,24 M. Bai,6 N.S. Bandara,43B. Bannier,64K.N. Barish,8 B. Bassalleck,50 S. Bathe,5, 58
5
V. Baublis,56 S. Baumgart,57 A. Bazilevsky,7 M. Beaumier,8 S. Beckman,13R. Belmont,13, 44, 68 A. Berdnikov,60
6
Y. Berdnikov,60D. Black,8D.S. Blau,34 J.S. Bok,50, 51 K. Boyle,58 M.L. Brooks,39 J. Bryslawskyj,5 H. Buesching,7
7
V. Bumazhnov,24 S. Butsyk,50 S. Campbell,14, 28 C.-H. Chen,58, 64 C.Y. Chi,14 M. Chiu,7I.J. Choi,25J.B. Choi,10
8
S. Choi,62 R.K. Choudhury,4 P. Christiansen,41T. Chujo,67 O. Chvala,8 V. Cianciolo,53Z. Citron,64, 69 B.A. Cole,14
9
M. Connors,64 N. Cronin,45, 64 N. Crossette,45 M. Csan´ad,17 T. Cs¨org˝o,70 S. Dairaku,35, 57 T.W. Danley,52
10
A. Datta,43, 50 M.S. Daugherity,1 G. David,7 K. DeBlasio,50K. Dehmelt,64 A. Denisov,24 A. Deshpande,58, 64
11
E.J. Desmond,7 O. Dietzsch,61 L. Ding,28 A. Dion,28, 64 P.B. Diss,42J.H. Do,71 M. Donadelli,61 L. D’Orazio,42
12
O. Drapier,36 A. Drees,64 K.A. Drees,6 J.M. Durham,39, 64 A. Durum,24 S. Edwards,6 Y.V. Efremenko,53
13
T. Engelmore,14 A. Enokizono,53, 57, 59 S. Esumi,67 K.O. Eyser,7, 8 B. Fadem,45 N. Feege,64 D.E. Fields,50
14
M. Finger,9 M. Finger, Jr.,9 F. Fleuret,36 S.L. Fokin,34 J.E. Frantz,52 A. Franz,7 A.D. Frawley,19Y. Fukao,57
15
T. Fusayasu,47 K. Gainey,1 C. Gal,64 P. Gallus,15 P. Garg,3 A. Garishvili,65 I. Garishvili,38 H. Ge,64
16
F. Giordano,25 A. Glenn,38 X. Gong,63 M. Gonin,36 Y. Goto,57, 58 R. Granier de Cassagnac,36 N. Grau,2
17
S.V. Greene,68 M. Grosse Perdekamp,25 Y. Gu,63 T. Gunji,12 T. Hachiya,57 J.S. Haggerty,7 K.I. Hahn,18
18
H. Hamagaki,12 H.F. Hamilton,1 S.Y. Han,18 J. Hanks,64S. Hasegawa,29 T.O.S. Haseler,20 K. Hashimoto,57, 59
19
R. Hayano,12 S. Hayashi,12 X. He,20 T.K. Hemmick,64 T. Hester,8 J.C. Hill,28 R.S. Hollis,8 K. Homma,22
20
B. Hong,33 T. Horaguchi,67 T. Hoshino,22 N. Hotvedt,28 J. Huang,7 S. Huang,68 T. Ichihara,57, 58 H. Iinuma,32
21
Y. Ikeda,57, 67 K. Imai,29 Y. Imazu,57 J. Imrek,16 M. Inaba,67 A. Iordanova,8 D. Isenhower,1 A. Isinhue,45
22
D. Ivanishchev,56 B.V. Jacak,64M. Javani,20 M. Jezghani,20 J. Jia,7, 63 X. Jiang,39 B.M. Johnson,7 K.S. Joo,46
23
D. Jouan,54D.S. Jumper,25 J. Kamin,64 S. Kanda,12 B.H. Kang,21 J.H. Kang,71 J.S. Kang,21 J. Kapustinsky,39
24
K. Karatsu,35, 57 D. Kawall,43A.V. Kazantsev,34 T. Kempel,28 J.A. Key,50 V. Khachatryan,64P.K. Khandai,3
25
A. Khanzadeev,56 K.M. Kijima,22 B.I. Kim,33 C. Kim,33 D.J. Kim,30 E.-J. Kim,10 G.W. Kim,18 M. Kim,62
26
Y.-J. Kim,25 Y.K. Kim,21 B. Kimelman,45 E. Kinney,13 E. Kistenev,7 R. Kitamura,12 J. Klatsky,19
27
D. Kleinjan,8 P. Kline,64 T. Koblesky,13 B. Komkov,56 J. Koster,58 D. Kotchetkov,52 D. Kotov,56, 60
28
F. Krizek,30 K. Kurita,57, 59 M. Kurosawa,57, 58 Y. Kwon,71 G.S. Kyle,51 R. Lacey,63 Y.S. Lai,14 J.G. Lajoie,28
29
A. Lebedev,28 D.M. Lee,39 J. Lee,18 K.B. Lee,39 K.S. Lee,33 S Lee,71 S.H. Lee,64 S.R. Lee,10 M.J. Leitch,39
30
M.A.L. Leite,61 M. Leitgab,25 B. Lewis,64 X. Li,11 S.H. Lim,71 L.A. Linden Levy,38 M.X. Liu,39 D. Lynch,7
31
C.F. Maguire,68Y.I. Makdisi,6 M. Makek,69, 72 A. Manion,64 V.I. Manko,34 E. Mannel,7, 14 T. Maruyama,29
32
M. McCumber,13, 39 P.L. McGaughey,39 D. McGlinchey,13, 19 C. McKinney,25 A. Meles,51 M. Mendoza,8
33
B. Meredith,25 Y. Miake,67 T. Mibe,32J. Midori,22 A.C. Mignerey,42 A. Milov,69D.K. Mishra,4 J.T. Mitchell,7
34
S. Miyasaka,57, 66 S. Mizuno,57, 67 A.K. Mohanty,4 S. Mohapatra,63 P. Montuenga,25 H.J. Moon,46
35
T. Moon,71 D.P. Morrison,7, ∗ M. Moskowitz,45 T.V. Moukhanova,34 T. Murakami,35, 57 J. Murata,57, 59
36
A. Mwai,63 T. Nagae,35 S. Nagamiya,32, 57 K. Nagashima,22 J.L. Nagle,13, † M.I. Nagy,17, 70 I. Nakagawa,57, 58
37
H. Nakagomi,57, 67 Y. Nakamiya,22 K.R. Nakamura,35, 57 T. Nakamura,57 K. Nakano,57, 66 C. Nattrass,65
38
P.K. Netrakanti,4 M. Nihashi,22, 57 T. Niida,67 S. Nishimura,12 R. Nouicer,7, 58 T. Nov´ak,31, 70 N. Novitzky,30, 64
39
A. Nukariya,12A.S. Nyanin,34H. Obayashi,22 E. O’Brien,7 C.A. Ogilvie,28 K. Okada,58 J.D. Orjuela Koop,13
40
J.D. Osborn,44 A. Oskarsson,41K. Ozawa,12, 32 R. Pak,7 V. Pantuev,26V. Papavassiliou,51 I.H. Park,18J.S. Park,62
41
S. Park,62 S.K. Park,33 S.F. Pate,51 L. Patel,20 M. Patel,28 H. Pei,28 J.-C. Peng,25 D.V. Perepelitsa,7, 14
42
G.D.N. Perera,51 D.Yu. Peressounko,34 J. Perry,28 R. Petti,7, 64 C. Pinkenburg,7 R. Pinson,1 R.P. Pisani,7
43
M.L. Purschke,7 H. Qu,1 J. Rak,30 B.J. Ramson,44 I. Ravinovich,69K.F. Read,53, 65 D. Reynolds,63 V. Riabov,49, 56
44
Y. Riabov,56, 60 E. Richardson,42 T. Rinn,28 N. Riveli,52 D. Roach,68 G. Roche,40, ‡ S.D. Rolnick,8
45
M. Rosati,28 Z. Rowan,5 J.G. Rubin,44 M.S. Ryu,21 B. Sahlmueller,64N. Saito,32 T. Sakaguchi,7H. Sako,29
46
V. Samsonov,49, 56 M. Sarsour,20 S. Sato,29 S. Sawada,32B. Schaefer,68 B.K. Schmoll,65K. Sedgwick,8 R. Seidl,57, 58
47
A. Sen,20, 65 R. Seto,8 P. Sett,4 A. Sexton,42 D. Sharma,64, 69 I. Shein,24 T.-A. Shibata,57, 66 K. Shigaki,22
48
M. Shimomura,28, 48, 67 K. Shoji,57 P. Shukla,4 A. Sickles,7, 25 C.L. Silva,39 D. Silvermyr,41, 53 K.S. Sim,33
49
B.K. Singh,3 C.P. Singh,3 V. Singh,3 M. Skolnik,45M. Sluneˇcka,9 M. Snowball,39 S. Solano,45 R.A. Soltz,38
50
W.E. Sondheim,39S.P. Sorensen,65 I.V. Sourikova,7 P.W. Stankus,53 P. Steinberg,7 E. Stenlund,41 M. Stepanov,43, ‡
51
A. Ster,70 S.P. Stoll,7 T. Sugitate,22 A. Sukhanov,7 T. Sumita,57 J. Sun,64 J. Sziklai,70 E.M. Takagui,61
A. Takahara,12 A. Taketani,57, 58 Y. Tanaka,47S. Taneja,64 K. Tanida,58, 62 M.J. Tannenbaum,7 S. Tarafdar,3, 69
53
A. Taranenko,49, 63 E. Tennant,51 R. Tieulent,20 A. Timilsina,28 T. Todoroki,57, 67 M. Tom´aˇsek,15, 27 H. Torii,22
54
C.L. Towell,1 R. Towell,1 R.S. Towell,1I. Tserruya,69 Y. Tsuchimoto,12C. Vale,7H.W. van Hecke,39 M. Vargyas,17
55
E. Vazquez-Zambrano,14 A. Veicht,14 J. Velkovska,68 R. V´ertesi,70 M. Virius,15 B. Voas,28 V. Vrba,15, 27
56
E. Vznuzdaev,56 X.R. Wang,51, 58 D. Watanabe,22 K. Watanabe,57, 59 Y. Watanabe,57, 58 Y.S. Watanabe,12, 32
57
F. Wei,51 S. Whitaker,28 A.S. White,44 S.N. White,7D. Winter,14 S. Wolin,25 C.L. Woody,7M. Wysocki,13, 53
58
B. Xia,52 L. Xue,20 S. Yalcin,64Y.L. Yamaguchi,12, 64 A. Yanovich,24J. Ying,20 S. Yokkaichi,57, 58 J.H. Yoo,33
59
I. Yoon,62Z. You,39I. Younus,37, 50 H. Yu,55I.E. Yushmanov,34 W.A. Zajc,14 A. Zelenski,6 S. Zhou,11 and L. Zou8
60
(PHENIX Collaboration)
61
1Abilene Christian University, Abilene, Texas 79699, USA
62
2
Department of Physics, Augustana University, Sioux Falls, South Dakota 57197, USA
63
3
Department of Physics, Banaras Hindu University, Varanasi 221005, India
64
4Bhabha Atomic Research Centre, Bombay 400 085, India
65
5Baruch College, City University of New York, New York, New York, 10010 USA
66
6
Collider-Accelerator Department, Brookhaven National Laboratory, Upton, New York 11973-5000, USA
67
7
Physics Department, Brookhaven National Laboratory, Upton, New York 11973-5000, USA
68
8University of California-Riverside, Riverside, California 92521, USA
69
9
Charles University, Ovocn´y trh 5, Praha 1, 116 36, Prague, Czech Republic
70
10
Chonbuk National University, Jeonju, 561-756, Korea
71
11Science and Technology on Nuclear Data Laboratory, China Institute of Atomic Energy, Beijing 102413, P. R. China
72
12
Center for Nuclear Study, Graduate School of Science, University of Tokyo, 7-3-1 Hongo, Bunkyo, Tokyo 113-0033, Japan
73
13
University of Colorado, Boulder, Colorado 80309, USA
74
14
Columbia University, New York, New York 10027 and Nevis Laboratories, Irvington, New York 10533, USA
75
15Czech Technical University, Zikova 4, 166 36 Prague 6, Czech Republic
76
16
Debrecen University, H-4010 Debrecen, Egyetem t´er 1, Hungary
77
17
ELTE, E¨otv¨os Lor´and University, H-1117 Budapest, P´azm´any P. s. 1/A, Hungary
78
18Ewha Womans University, Seoul 120-750, Korea
79
19
Florida State University, Tallahassee, Florida 32306, USA
80
20
Georgia State University, Atlanta, Georgia 30303, USA
81
21Hanyang University, Seoul 133-792, Korea
82
22Hiroshima University, Kagamiyama, Higashi-Hiroshima 739-8526, Japan
83
23
Department of Physics and Astronomy, Howard University, Washington, DC 20059, USA
84
24
IHEP Protvino, State Research Center of Russian Federation, Institute for High Energy Physics, Protvino, 142281, Russia
85
25University of Illinois at Urbana-Champaign, Urbana, Illinois 61801, USA
86
26
Institute for Nuclear Research of the Russian Academy of Sciences, prospekt 60-letiya Oktyabrya 7a, Moscow 117312, Russia
87
27
Institute of Physics, Academy of Sciences of the Czech Republic, Na Slovance 2, 182 21 Prague 8, Czech Republic
88
28Iowa State University, Ames, Iowa 50011, USA
89
29
Advanced Science Research Center, Japan Atomic Energy Agency, 2-4
90
Shirakata Shirane, Tokai-mura, Naka-gun, Ibaraki-ken 319-1195, Japan
91
30Helsinki Institute of Physics and University of Jyv¨askyl¨a, P.O.Box 35, FI-40014 Jyv¨askyl¨a, Finland
92
31K´aroly R´oberts University College, H-3200 Gy¨ngy¨os, M´atrai´ut 36, Hungary
93
32
KEK, High Energy Accelerator Research Organization, Tsukuba, Ibaraki 305-0801, Japan
94
33
Korea University, Seoul, 136-701, Korea
95
34National Research Center “Kurchatov Institute”, Moscow, 123098 Russia
96
35
Kyoto University, Kyoto 606-8502, Japan
97
36
Laboratoire Leprince-Ringuet, Ecole Polytechnique, CNRS-IN2P3, Route de Saclay, F-91128, Palaiseau, France
98
37Physics Department, Lahore University of Management Sciences, Lahore 54792, Pakistan
99
38Lawrence Livermore National Laboratory, Livermore, California 94550, USA
100
39
Los Alamos National Laboratory, Los Alamos, New Mexico 87545, USA
101
40
LPC, Universit´e Blaise Pascal, CNRS-IN2P3, Clermont-Fd, 63177 Aubiere Cedex, France
102
41Department of Physics, Lund University, Box 118, SE-221 00 Lund, Sweden
103
42
University of Maryland, College Park, Maryland 20742, USA
104
43
Department of Physics, University of Massachusetts, Amherst, Massachusetts 01003-9337, USA
105
44Department of Physics, University of Michigan, Ann Arbor, Michigan 48109-1040, USA
106
45
Muhlenberg College, Allentown, Pennsylvania 18104-5586, USA
107
46
Myongji University, Yongin, Kyonggido 449-728, Korea
108
47Nagasaki Institute of Applied Science, Nagasaki-shi, Nagasaki 851-0193, Japan
109
48Nara Women’s University, Kita-uoya Nishi-machi Nara 630-8506, Japan
110
49
National Research Nuclear University, MEPhI, Moscow Engineering Physics Institute, Moscow, 115409, Russia
111
50
University of New Mexico, Albuquerque, New Mexico 87131, USA
112
51New Mexico State University, Las Cruces, New Mexico 88003, USA
113
52
Department of Physics and Astronomy, Ohio University, Athens, Ohio 45701, USA
53
Oak Ridge National Laboratory, Oak Ridge, Tennessee 37831, USA
115
54IPN-Orsay, Univ. Paris-Sud, CNRS/IN2P3, Universit´e Paris-Saclay, BP1, F-91406, Orsay, France
116
55Peking University, Beijing 100871, P. R. China
117
56
PNPI, Petersburg Nuclear Physics Institute, Gatchina, Leningrad region, 188300, Russia
118
57RIKEN Nishina Center for Accelerator-Based Science, Wako, Saitama 351-0198, Japan
119
58RIKEN BNL Research Center, Brookhaven National Laboratory, Upton, New York 11973-5000, USA
120
59
Physics Department, Rikkyo University, 3-34-1 Nishi-Ikebukuro, Toshima, Tokyo 171-8501, Japan
121
60
Saint Petersburg State Polytechnic University, St. Petersburg, 195251 Russia
122
61Universidade de S˜ao Paulo, Instituto de F´ısica, Caixa Postal 66318, S˜ao Paulo CEP05315-970, Brazil
123
62
Department of Physics and Astronomy, Seoul National University, Seoul 151-742, Korea
124
63
Chemistry Department, Stony Brook University, SUNY, Stony Brook, New York 11794-3400, USA
125
64Department of Physics and Astronomy, Stony Brook University, SUNY, Stony Brook, New York 11794-3800, USA
126
65
University of Tennessee, Knoxville, Tennessee 37996, USA
127
66
Department of Physics, Tokyo Institute of Technology, Oh-okayama, Meguro, Tokyo 152-8551, Japan
128
67Center for Integrated Research in Fundamental Science and Engineering, University of Tsukuba, Tsukuba, Ibaraki 305, Japan
129
68
Vanderbilt University, Nashville, Tennessee 37235, USA
130
69
Weizmann Institute, Rehovot 76100, Israel
131
70Institute for Particle and Nuclear Physics, Wigner Research Centre for Physics, Hungarian
132
Academy of Sciences (Wigner RCP, RMKI) H-1525 Budapest 114, POBox 49, Budapest, Hungary
133
71
Yonsei University, IPAP, Seoul 120-749, Korea
134
72
University of Zagreb, Faculty of Science, Department of Physics, Bijeniˇcka 32, HR-10002 Zagreb, Croatia
135
(Dated: January 26, 2016)
136
The PHENIX Collaboration at the Relativistic Heavy Ion Collider has measured open heavy flavor
137
production in minimum bias Au+Au collisions at√sN N = 200 GeV via the yields of electrons from
138
semileptonic decays of charm and bottom hadrons. Previous heavy flavor electron measurements
139
indicated substantial modification in the momentum distribution of the parent heavy quarks due
140
to the quark-gluon plasma created in these collisions. For the first time, using the PHENIX silicon
141
vertex detector to measure precision displaced tracking, the relative contributions from charm and
142
bottom hadrons to these electrons as a function of transverse momentum are measured in Au+Au
143
collisions. We compare the fraction of electrons from bottom hadrons to previously published
144
results extracted from electron-hadron correlations in p+p collisions at√sN N = 200 GeV and find
145
the fractions to be similar within the large uncertainties on both measurements for pT > 4 GeV/c.
146
We use the bottom electron fractions in Au+Au and p+p along with the previously measured heavy
147
flavor electron RAA to calculate the RAA for electrons from charm and bottom hadron decays
148
separately. We find that electrons from bottom hadron decays are less suppressed than those from
149
charm for the region 3 < pT< 4 GeV/c.
150
PACS numbers: 25.75.Dw
151
∗PHENIX Co-Spokesperson: morrison@bnl.gov †PHENIX Co-Spokesperson: jamie.nagle@colorado.edu ‡Deceased
I. INTRODUCTION
152
High-energy heavy ion collisions at the Relativistic Heavy Ion Collider (RHIC) and the Large Hadron Collider
153
(LHC) create matter that is well described as an equilibrated system with initial temperatures in excess of 340–420
154
MeV [1–5]. In this regime, the matter is understood to be a quark-gluon plasma (QGP) with bound hadronic states no
155
longer in existence as the temperatures far exceed the transition temperature of approximately 155 MeV calculated by
156
lattice quantum chromodynamics (QCD) [6]. This QGP follows hydrodynamical flow behavior with extremely small
157
dissipation, characterized by the shear viscosity to entropy density ratio η/s ≈ 1/4π and is thus termed a near-perfect
158
fluid [1, 7–9].
159
Charm and bottom quarks (mc≈ 1.3 GeV/c2and mb≈ 4.2 GeV/c2) are too heavy to be significantly produced via
160
the interaction of thermal particles in the QGP. Thus the dominant production mechanism is via hard interactions
161
between partons in the incoming nuclei, i.e. interactions that involve large momentum transfer, q2. Once produced,
162
these heavy quarks are not destroyed by the strong interaction and thus propagate through the QGP and eventually
163
emerge in heavy flavor hadrons, for example D and B mesons.
164
Early measurement of heavy flavor electrons from the PHENIX Collaboration in Au+Au collisions at RHIC
indi-165
cated that although the total heavy flavor production scales with the number of binary collisions within
uncertain-166
ties [10, 11], the momentum distribution of these heavy quarks is significantly modified when compared with that in
167
p+p collisions [12, 13]. These results indicate a large suppression for high-pT > 5 GeV/c electrons and a substantial
168
elliptic flow for pT = 0.3–3.0 GeV/c electrons from heavy quark decays. Here, and throughout the paper, we use
169
“electrons” to refer to both electrons and positrons. The suppression of the charm quark has since been confirmed
170
through the direct reconstruction of D mesons by the STAR Collaboration [14]. In Pb+Pb collisions at the LHC
171
at √sN N = 2.76 TeV, similar momentum distribution modifications of heavy flavor electrons and D mesons have
172
been measured [15, 16]. Recently, the CMS experiment has reported first measurements of B → J/ψ [17] and
173
b-jets [18] in Pb+Pb collisions. In contrast to this suppression pattern found in Au+Au collisions, d+Au and
periph-174
eral Cu+Cu collisions at √sN N = 200 GeV exhibit an enhancement at intermediate electron pT in the heavy flavor
175
electron spectrum [19, 20] that must be understood in terms of a mechanism that enhances the pT spectrum, e.g.
176
the Cronin effect [21]. That mechanism potentially moderates the large suppression observed in Au+Au collisions at
177
√
sN N = 200 GeV. It is notable that in central Au+Au collisions at√sN N = 62 GeV an enhancement is also observed
178
at intermediate pT [22].
179
The possibility that charm quarks follow the QGP flow was postulated early on [23], and more detailed Langevin-type
180
calculations with drag and diffusion of these heavy quarks yield a reasonable description of the electron data [24–29].
181
Many of these theory calculations incorporate radiative and collisional energy loss of the heavy quarks in the QGP
182
that are particularly important at high-pT, where QGP flow effects are expected to be sub-dominant. The large
183
suppression of heavy flavor electrons extending up to pT ≈ 9 GeV/c has been a particular challenge to understand
184
theoretically, in part due to an expected suppression of radiation in the direction of the heavy quarks propagation –
185
often referred to as the “dead-cone” effect [30].
186
This observation of the high-pT suppression [31, 32] is all the more striking because perturbative QCD (pQCD)
187
calculations indicate a substantial contribution from bottom quark decays for pT > 5 GeV/c [33]. First measurements
188
in p+p collisions at 200 GeV via electron-hadron correlations confirm this expected bottom contribution to the
189
electrons that increases as a function of pT [34, 35]. To date, there are no direct measurements at RHIC of the
190
contribution of bottom quarks in Au+Au collisions.
191
For the specific purpose of separating the contributions of charm and bottom quarks at midrapidity, the PHENIX
192
Collaboration has added micro-vertexing capabilities in the form of a silicon vertex tracker (VTX). The different
193
lifetimes and kinematics for charm and bottom hadrons decaying to electrons enables separation of their contributions
194
with measurements of displaced tracks (i.e. the decay electron not pointing back to the collision vertex). In this paper,
195
we report on first results of separated charm and bottom yields via single electrons in minimum bias (MB) Au+Au
196
collisions at√sN N = 200 GeV.
197
II. PHENIX DETECTOR
198
As detailed in Ref. [36], the PHENIX detector was originally designed with precision charged particle
reconstruc-199
tion combined with excellent electron identification. In 2011, the VTX was installed thus enabling micro-vertexing
200
capabilities. The dataset utilized in this analysis comprises Au+Au collisions at√sN N = 200 GeV.
A. Global detectors and MB trigger
202
A set of global event-characterization detectors are utilized to select Au+Au events and eliminate background
203
contributions. Two beam-beam counters (BBC) covering pseudorapidity 3.0 < |η| < 3.9 and full azimuth are located
204
at ± 1.44 meters along the beam axis and relative to the nominal beam-beam collision point. Each of the BBCs
205
comprises 64 ˇCerenkov counters.
206
Based on the coincidence of the BBCs, Au+Au collisions are selected via an online MB trigger, which requires at
207
least two counters on each side of the BBC to fire. The MB sample covers 96 ± 3% of the total inelastic Au+Au
208
cross section as determined by comparison with Monte Carlo Glauber models [37]. The BBC detectors also enable a
209
selection on the z-vertex position of the collision as determined by the time-of-flight difference between hits in the two
210
sets of BBC counters. The z-vertex resolution of the BBC is approximately σz= 0.6 cm in central Au+Au collisions.
211
A selection within approximately ±12 cm of the nominal detector center was implemented and ∼ 85% of all Au+Au
212
collisions within that selection were recorded by the PHENIX high-bandwidth data acquisition system.
213
B. The central arms
214
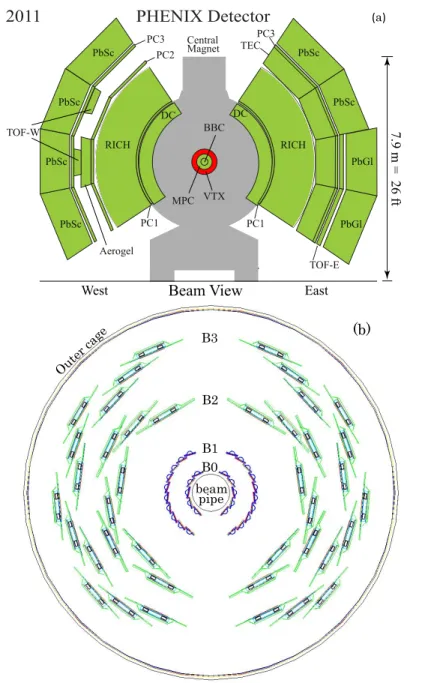
Electrons (e+ and e−) are reconstructed using two central spectrometer arms as shown in Fig. 1(a), each of which
215
covers the pseudorapidity range |η| < 0.35 and with azimuthal angle ∆φ = π/2. The detector configuration of the
216
central arms is the same as in previous PHENIX Collaboration heavy flavor electron publications [12, 13]. Charged
217
particle tracks are reconstructed outside of an axial magnetic field using layers of drift chamber (DC) and
multi-218
wire proportional pad chambers (PC). The momentum resolution is σp/p ' 0.7% ⊕ 0.9% p (GeV/c). For central
219
arm charged particle reconstructions the trajectory is only measured for radial positions r > 2.02 meters, and the
220
momentum vector is calculated by assuming the track originates at the Au+Au collision point determined by the
221
BBC detectors and assuming 0 radial distance.
222
Electron identification is performed by hits in a ring imaging ˇCerenkov detector (RICH) and a confirming energy
223
deposit in an electromagnetic calorimeter (EMCal). The RICH uses CO2 gas at atmospheric pressure as a ˇCerenkov
224
radiator. Electrons and pions begin to radiate in the RICH at pT > 20 MeV/c and pT > 4.9 GeV/c, respectively.
225
The EMCal is composed of four sectors in each arm. The bottom two sectors of the east arm are lead-glass and the
226
other six are lead-scintillator. The energy resolution of the EMCal is σE/E ' 4.5% ⊕ 8.3/pE(GeV) and σE/E '
227
4.3% ⊕ 7.7/pE(GeV) for lead-scintillator and lead-glass, respectively.
228
C. The VTX detector
229
In 2011, the central detector was upgraded with the VTX detector as shown in Fig. 1. In addition, a new beryllium
230
beam pipe with 2.16 cm inner diameter and 760 µm nominal thickness was installed to reduce multiple-scattering
231
before the VTX detector.
232
The VTX detector [38–40] consists of four radial layers of silicon detectors as shown in Fig. 1(b). The detector is
233
separated into two arms, each with nominal acceptance ∆φ ≈ 0.8π centered on the acceptance of the outer PHENIX
234
central arm spectrometers. The detector covers pseudorapidity |η| < 1.2 for collisions taking place at z = 0. The
235
VTX can precisely measure the vertex position of a collision within |z| < 10 cm range of the center of the VTX.
236
The two inner layers, referred to as B0 and B1, of the VTX detector comprise silicon pixel detectors, as detailed in
237
Ref. [41]. B0 (B1) comprises 10 (20) ladders with a central radial position of 2.6 (5.1) cm. The silicon pixel technology
238
is based on the ALICE1LHCb sensor-readout chip [42], which was developed at CERN. Each ladder is electrically
239
divided into two independent half-ladders. Each ladder comprises four sensor modules mounted on a mechanical
240
support made from carbon-fiber composite. Each sensor module comprises a silicon pixel sensor with a pixel size
241
of 50 µm(φ) × 425 µm(z) bump-bonded with four pixel readout chips. One pixel readout chip reads 256 (φ)× 32
242
(z)= 8192 pixels and covers approximately 1.3 cm (∆φ)× 1.4 cm (∆z) of the active area of the sensor. The position
243
resolution is σφ = 14.4 µm in the azimuthal direction.
244
The two outer layers of the VTX detector, referred to as B2 and B3, are constructed using silicon stripixel sensors,
245
as detailed in Ref. [41]. The B2 (B3) layer comprises 16 (24) silicon stripixel ladders at a central radial distance of 11.8
246
(16.7) cm. The stripixel sensor is a novel silicon sensor, and is a single-sided, N-type, DC-coupled, two-dimensional
247
(2-D) sensitive detector [43, 44]. One sensor has an active area of approximately 30 mm × 60 mm, which is divided
248
into two independent sectors of 30 mm × 30 mm. Each sector is divided into 384 × 30 pixels. Each pixel has an
249
effective size of 80 µm (φ) × 1000 µm (z), leading to a position resolution of σφ=23 µm. A pixel comprises two
250
implants (A and B) interleaved such that each of the implants registers half of the charge deposited by ionizing
West
South Side View Beam View
PHENIX Detector
2011
North East MuTr MuID RPC3 MuID RPC3 MPC BBC VTX PbSc PbSc PbSc PbSc PbSc PbGl PbSc PbGl TOF-E PC1 PC1 PC3 PC2 Central Magnet Central MagnetNorth Muon Magnet
South Muon Magnet
TECPC3 BBC VTX MPC BB RICH RICH DC DC ZDC North ZDC South Aerogel TOF-W 7.9 m = 26 ft 10.9 m = 36 ft 18.5 m = 60 ft (a) (b) B0 B1 B2 B3 beam pipe Outer cage
FIG. 1. (Color Online) (a) A schematic view of the PHENIX detector configuration for the 2011 run. (b) A schematic view of the VTX detector with the individual ladders shown.
particles. There are 30 A implants along the beam direction, connected to form a 30 mm long X-strip, and 30 B
252
implants are connected with a stereo angle of 80 mrad to form a U-strip. X-strip and U-strip are visualized in [44].
253
When a charged particle hits a pixel, both the X- and the U-strip sharing the pixel register a hit. Thus the hit pixel
254
is determined as the intersection of the two strips. The stripixel sensor is read out with the SVX4 chip developed by
255
a FNAL-LBNL Collaboration [45].
256
The total number of channels in the VTX pixel and stripixel layers is 3.9 million pixels and 0.34 million strips.
257
The compositions of the pixel and strip are illustrated in [41, 44]. The main characteristics of the VTX detector are
258
summarized in Table I.
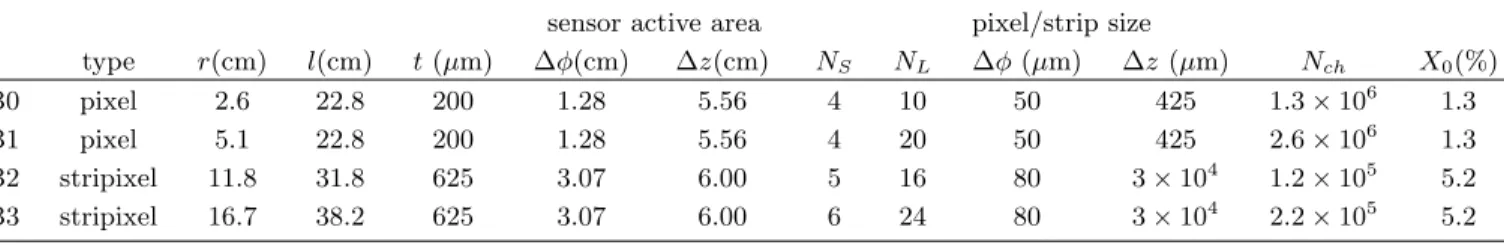
TABLE I. A summary of the VTX detector. For each layer (B0 to B3), the detector type, the central radius (r), ladder length (l), sensor thickness (t), sensor active area (∆φ × ∆z), the number of sensors per ladder (NS), the number of ladders (NL),
pixel/strip size in φ (∆φ) and z (∆z), the number of read-out channels (Nch), and the average radiation length including the
support and on-board electronics (X0) are given.
sensor active area pixel/strip size
type r(cm) l(cm) t (µm) ∆φ(cm) ∆z(cm) NS NL ∆φ (µm) ∆z (µm) Nch X0(%) B0 pixel 2.6 22.8 200 1.28 5.56 4 10 50 425 1.3 × 10⁶ 1.3 B1 pixel 5.1 22.8 200 1.28 5.56 4 20 50 425 2.6 × 10⁶ 1.3 B2 stripixel 11.8 31.8 625 3.07 6.00 5 16 80 3 × 10⁴ 1.2 × 10⁵ 5.2 B3 stripixel 16.7 38.2 625 3.07 6.00 6 24 80 3 × 10⁴ 2.2 × 10⁵ 5.2 III. ANALYSIS 260 A. Overview 261
The purpose of the analysis is to separate the electrons from charm and bottom hadron decays. The life time of B
262
mesons (cτB0= 455 µm, cτB± = 491 µm [46]) is substantially longer than that of D mesons (cτD0 = 123 µm, cτD± 263
= 312 µm) and the decay kinematics are different. This means that the distribution of values for the distance of
264
closest approach (DCA) of the track to the primary vertex for electrons from bottom decays will be broader than
265
that of electrons from charm decays. There are other sources of electrons, namely Dalitz decays of π0and η, photon
266
conversions, Ke3decays, and J/ψ → e+e−decays. With the exception of electrons from Ke3decays, these background
267
components have DCA distributions narrower than those from charm decay electrons. Thus we can separate b → e,
268
c → e and background electrons via precise measurement of the DCA distribution.
269
In the first step of the analysis, we select good events where the collision vertex is within the acceptance of the
270
VTX detector, and its function is normal (Sec. III B). We then reconstruct electrons in the PHENIX central arms
271
(Sec. III C). The electron tracks are then associated with hits in the VTX detector and their DCA is measured
272
(Sec. III D). At this point we have the DCA distribution of inclusive electrons that has contributions from heavy
273
flavor (b → e and c → e) and several background components.
274
The next step is to determine the DCA shape and normalization of all background components (Sec. III E). They
275
include mis-identified hadrons, background electrons with large DCA caused by high-multiplicity effects, photonic
276
electrons (Dalitz decay electrons, photon conversions), and electrons from Ke3 and quarkonia decays. The shapes of
277
the DCA distributions of the various background electrons are determined via data driven methods or Monte Carlo
278
simulation. We then determine the normalization of those background electron components in the data (Sec. III F).
279
Because the amount of the VTX detector material is substantial (13% of one radiation length) the largest source
280
of background electrons is photon conversion within the VTX. We suppress this background by a conversion veto cut
281
(Sec. III E 3)
282
Once the shape and the normalization of all background components are determined and subtracted, we arrive
283
at the DCA distribution of heavy flavor decay electrons that can be described as a sum of b → e and c → e DCA
284
distributions. The heavy flavor DCA distribution is decomposed by an unfolding method (Sec. III G).
285
B. Event selection
286
The data set presented in this analysis is from Au+Au collisions at √sN N = 200 GeV recorded in 2011 after the
287
successful commissioning of the VTX detector. As detailed earlier, the MB Au+Au data sample was recorded using
288
the BBC trigger sampling 96 ± 3% of the inelastic Au+Au cross section. A number of offline cuts were applied for
289
optimizing the detector acceptance uniformity and data quality as described below. After all cuts, a data sample of
290
2.4×10⁹Au+Au events was analyzed.
291
1. z-vertex selection
292
The acceptance of the PHENIX central arm spectrometers covers collisions with z-vertex within ± 30 cm of the
293
nominal interaction point. The VTX detector is more restricted in |z| acceptance, as the B0 and B1 layers cover only
294
|z| < 11.4 cm. Thus the BBC trigger selected only events within the narrower vertex range of |zBBC| < 12 cm. In
the offline reconstruction, the tracks reconstructed from VTX information alone are used to reconstruct the Au+Au
296
collision vertex with resolution σz= 75 µm. All Au+Au events in the analysis are required to have a z-vertex within
297
±10 cm as reconstructed by the VTX.
298
2. Data quality assurance
299
Due to a number of detector commissioning issues in this first data taking period for the VTX, the data quality
300
varies substantially. Therefore we divide the entire 2011 Au+Au data taking period into four periods. The acceptance
301
of the detector changes significantly between these periods.
302
In addition, several cuts are applied to ensure the quality and the stability of the data. Applying electron
identifi-303
cation cuts described in Sec. III C 2, the electron to hadron ratios were checked for each run, a continuous data taking
304
period typically lasting of order one hour, and three runs out of 547 with ratios outside of 5σ from the mean were
305
discarded. The B2 and B3 stripixel layers had an issue in stability of read-out electronics where some of the sensor
306
modules would drop out, resulting in a reduced acceptance within a given run. Additional instabilities also existed in
307
the B0 and B1 pixel layers. Detailed channel by channel maps characterizing dead, hot, and unstable channels were
308
generated for all layers within a given run. These maps were used to mask dead, hot, and unstable channels from the
309
analysis, as well as to define the fiducial area of the VTX in simulations.
310
During this first year of data taking, the instability of the read-out electronics discussed above caused significant
311
run-to-run variations in the acceptance and efficiency of the detector. It is therefore not possible to reliably calculate
312
the absolute acceptance and efficiency correction while maintaining a large fraction of the total data set statistics.
313
Instead, we report on the relative yields of charm and bottom to total heavy flavor. We have checked that the DCA
314
distributions are consistent between running periods and are not impacted by the changing acceptance. Thus we
315
can measure the shape of the DCA distribution using the entire data set. In the following, we use the shape of the
316
measured DCA distribution only to separate b → e and c → e components.
317
C. Electron reconstruction in central arms
318
1. Track reconstruction
319
Charged particle tracks are reconstructed using the outer central arm detectors, DC and PC, as detailed in Ref. [13].
320
The DC has six types of wire modules stacked radially, named X1, U1, V1, X2, U2, and V2. The X wires run parallel to
321
the beam axis in order to measure the φ-coordinate of the track and the U and V wires have stereo angles varying from
322
5.4 to 6.0 degrees. Tracks are required to have hits in both the X1 and X2 sections along with uniquely associated
323
hits in the U or V stereo wires and at least one matching PC hit, to reduce mis-reconstructed tracks. The track
324
momentum vector is determined assuming the particle originated at the Au+Au collision vertex as reconstructed by
325
the BBC.
326
2. Electron identification
327
Electron candidates are selected by matching tracks with hits in the RICH and energy clusters in the EMCal.
328
The details on the electron selection cuts are given in Ref. [12]. In this analysis we select electron candidates within
329
1.5 < pT [GeV/c] < 5.0, and we briefly describe the cuts in the RICH and EMCal below.
330
ˇ
Cerenkov photons from an electron track produce a ring-shaped cluster in the RICH. At least three associated PMT
331
hits are required in the RICH and a ring-shape cut is applied. The center of the ring is required to be within 5 cm of
332
the track projection. The probability that the associated cluster in the EMCal comes from an electromagnetic shower
333
is calculated based on the shower shape. Based on that probability, tracks are selected in a way that maintains high
334
efficiency for electrons while rejecting hadrons. Further, the energy (E) in the EMCal is required to match the track
335
determined momentum (p). This match is calculated as dep = (E/p − µE/p)/σE/p, where µE/pand σE/pare the mean
336
and standard deviation respectively of a Gaussian fit to the E/p distribution, determined as a function of momentum
337
(see Fig. 2). A cut of dep > −2 is used to further reject hadrons that have an E/p ratio < 1, because they do not
338
deposit their full energy in the EMCal.
339
In high-multiplicity Au+Au events there is a significant probability for a random association between the track and
340
hits in the RICH and EMCal. This mis-identified hadron probability is estimated as follows. The z < 0 and z > 0
341
sides of the RICH have their hits swapped in software, and the tracks are re-associated with RICH hits. Because the
two longitudinal sides of the RICH are identical, this gives a good estimate of the random hadron background in the
343
electron sample.
344
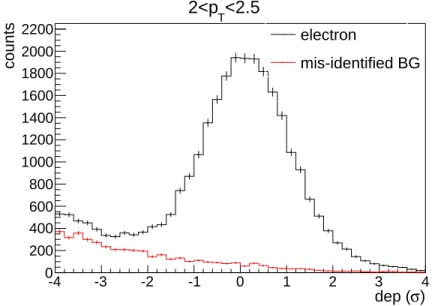
The distribution of electron candidates at pT =2.0–2.5 GeV/c for the normalized EMCal energy to track momentum
345
ratio, dep defined above, is shown in Fig. 2. There is a large peak near zero from true electrons as expected and a
346
clear low-side tail from mis-identified hadron. Also shown is the result of the above swap method. The difference
347
between the data and the “swap” distribution (red) is explained as contributions from off-vertex electrons caused
348
by conversions from the outer layer of the VTX and weak decay. In the final accounting for all contributions to
349
the identified-electron DCA distribution, we utilize this swap method to statistically estimate the contribution of
350
mis-identified hadron in each pT selection as detailed in Section III E 1.
351 ) σ dep ( -4 -3 -2 -1 0 1 2 3 4 counts 0 200 400 600 800 1000 1200 1400 1600 1800 2000 2200
<2.5
T2<p
electron mis-identified BGFIG. 2. (Color Online) Matching variable between the reconstructed track momentum (p) and the energy measured in the EMCal (E): dep = (E/p − µE/p)/σE/p. The black distribution is for identified electrons with pT = 2.0–2.5 GeV/c, and the red
distribution is the estimated contribution from mis-identified electrons via the RICH swap-method.
D. DCA measurement with the VTX
352
Charged particle tracks reconstructed in the central arms must be associated with VTX hits in order to calculate
353
their DCA. Three-dimensional (3-D) hit positions in the 4 layers of VTX are reconstructed. For each collision, the
354
primary vertex is reconstructed by the VTX. Then central arm tracks are associated with hits in the VTX, and
355
VTX-associated tracks are formed. Finally, the DCA between the primary vertex and the VTX-associated tracks are
356
measured.
357
1. VTX alignment
358
In order to achieve good DCA resolution to separate b → e and c → e, alignment of the detector ladders to high
359
precision is required. The detector alignment is accomplished via an iterative procedure of matching outer central
360
arm tracks from the DC and PC to the VTX hits. The procedure is convergent for the position of each ladder.
361
The alignment was repeated each time the detector was repositioned following a service access. The final alignment
362
contribution to the DCA resolution in both φ and z is a few tens of microns.
363
2. VTX hit reconstruction
364
For layers B0 and B1, clusters of hit pixels are formed by connecting contiguous hit pixels by a recursive clustering
365
algorithm. An average cluster size is 2.6 (6.7) pixels for the pixel (stripixel). The center of the cluster in the local
366
2-D coordinate system of the sensor is calculated as the hit position.
For B2 and B3 layers, 2D hit points on the sensor are reconstructed from the X-view and the U-view. Hit lines in
368
the X-view (U-view) are formed by clustering contiguous hit X-strips (U-strips) weighted by deposited charges, and
369
then 2D hit points are formed as the intersections of all hit lines in X- and U- views. When one hit line in U-view
370
crosses more than two hit lines in X-view, ghost hits can be formed, because which crossing point is the true hit is
371
ambiguous. These ghost hits increase the number of reconstructed 2D hits approximately by 50% (30%) in B2 (B3)
372
in central Au+Au collisions. The ghost hit rate was studied using a full geant3 [47] simulation with the HIJING [48]
373
generator as input. However, because the occupancy of the detector at the reconstructed 2D hit point level is low,
374
less than 0.1%, these ghost hits do not cause any significant issue in the analysis.
375
The positions of all 2-D hits in the VTX are then transferred into the global PHENIX 3-D coordinate system.
376
Correction of the sensor position and orientation, determined by the alignment procedure described in the previous
377
section, is applied in the coordinate transformation. The resulting 3-D hit positions in the global coordinate system
378
are then used in the subsequent analysis.
379
3. The primary vertex reconstruction
380
With the VTX hit information alone, charged particle tracks can be reconstructed only with modest momentum
381
resolution δp/p ≈ 10% due to the limited magnetic field integrated over the VTX volume and the multiple scattering
382
within the VTX. These tracks can be utilized to determine the collision vertex in three-dimensions (z0 along the
383
beam axis, and x0,y0in the transverse plane) for each Au+Au event under the safe assumption that the majority of
384
particles originate at the collision vertex. This vertex position is called the primary vertex position.
385
The position resolution of the primary vertex for each direction depends on the sensor pixel and strip sizes, the
386
precision of the detector alignment, and the number of particles used for the primary vertex calculation and their
387
momentum in each event. For MB Au+Au collisions, the resolution values are σx = 96 µm, σy = 43 µm, and
388
σz= 75 µm. The worse resolution in x compared to y is due to the orientation of the two VTX arms. For comparison,
389
the beam profile in the transverse plane is σlumi
x ≈ σylumi≈ 90 µm in the 2011 Au+Au run.
390
4. Association of a central arm track with VTX
391
Each central arm track is projected from the DC through the magnetic field to the VTX detector. Hits in VTX
392
are then associated with the track using a recursive windowing algorithm as follows.
393
The association starts from layer B3. VTX hits in that layer that are within a certain (∆φ × ∆z) window around
394
the track projection are searched. If hits are found in this window, the track is connected to each of the found hits,
395
and then projected inward to the next layer. In this case the search window in the next layer is decreased, because
396
there is much less uncertainty in projection to the next layer. If no hit is found, the layer is skipped, and the track is
397
projected inward to the next layer, keeping the size of the projection window. This process continues until the track
398
reaches layer B0, and a chain of VTX hits that can be associated with the track is formed. The window sizes are
399
momentum dependent and determined from a full geant3 simulation of the detector so that the inefficiency of track
400
reconstruction due to the window size is negligible.
401
After all possible chains of VTX hits that can be associated with a given central arm track are found by the recursive
402
algorithm, a track model fit is performed for each of these possible chains, and the χ2 of the fit, χ2
vtx, is calculated.
403
The effect of multiple scattering in each VTX layer is taken into account in calculation of χ2
vtx. Then the best chain
404
is chosen based on the value of χ2
vtxand the number of associated hits. This best chain and its track model are called
405
a VTX-associated track. Note that at most one VTX-associated track is formed from each central arm track.
406
In this analysis we require that VTX-associated tracks have associated hits in at least the first three layers, i.e.
407
B0, B1, and B2. An additional track requirement is χ2
vtx/NDF < 2 for pT < 2 GeV/c and χ2vtx/NDF < 3 for pT > 2
408
GeV/c, where NDF is the number of degrees of freedom in the track fit.
409
5. DCAT and DCAL
410
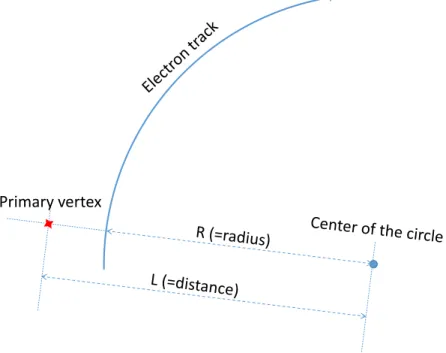
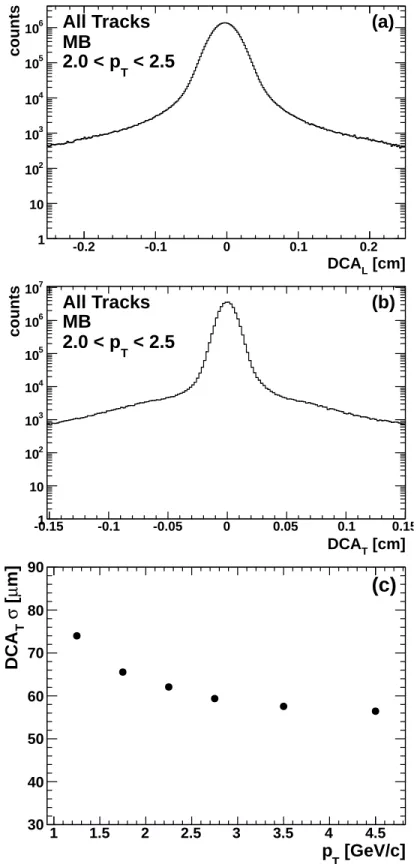
Using the primary vertex position determined above, the DCA of a track is calculated separately in the transverse plane (DCAT) and along the beam axis (DCAL). Because by design the DCAT has a better resolution than DCAL,
we first find DCAT with a track model of a circle trajectory assuming the uniform magnetic field over the VTX. We
define DCAT as
where L is the distance from the collision vertex to the center of the circle defining the particle trajectory, and R is
411
the radius of the circle as shown in Fig. 3. DCAL is the distance between the z-coordinate of the point DCAT found
412
and z-coordinate of the primary vertex.
413
It is notable that DCAT has a sign in this definition. The distinction between positive and negative values of
414
DCAT—whether the trajectory is bending towards or away from the primary vertex—is useful since certain
back-415
ground contributions have asymmetric distributions in positive and negative DCAT, as discussed in section III E. For
416
electrons, the positive side of DCAT distribution has less background contribution. There is no such positive/negative
417
asymmetry in DCAL.
418
Primary vertex
FIG. 3. (Color Online) Illustration of the definition of DCAT ≡ L - R in the transverse plane.
6. DCA measurement
419
For each VTX-associated track, the DCA is calculated separately in the radial and longitudinal direction (DCAT
420
and DCAL) from the track model and the primary vertex position. Shown in Fig. 4 is the resulting DCAT and DCAL
421
distributions for all VTX-associated tracks with pT = 2.0–2.5 GeV/c. Since the vast majority of charged tracks are
422
hadrons originating at the primary vertex, we observe a large peak around DCAT, DCAL = 0 that is well fit to
423
a Gaussian distribution where the σ represents the DCAT, DCAL resolution. A selection of |DCAL | < 0.1 cm is
424
applied to reduce background.
425
There are broad tails for |DCAT | > 0.03 cm. Monte Carlo simulation shows that the main source of the broad
426
tails is the decay of long lived light hadrons such as Λ and K0 S.
427
The DCAT resolution as a function of the track pT is extracted using a Gaussian fit to the peak and is shown in
428
Fig. 4 c). The DCAT resolution is approximately 75 µm for the 1.0–1.5 GeV/c bin and decreases with increasing pT
429
as the effect of multiple scattering becomes smaller for higher pT. The DCAT resolution becomes less than 60 µm for
430
pT > 4 GeV/c, where it is limited by the position resolution of the primary vertex.
431
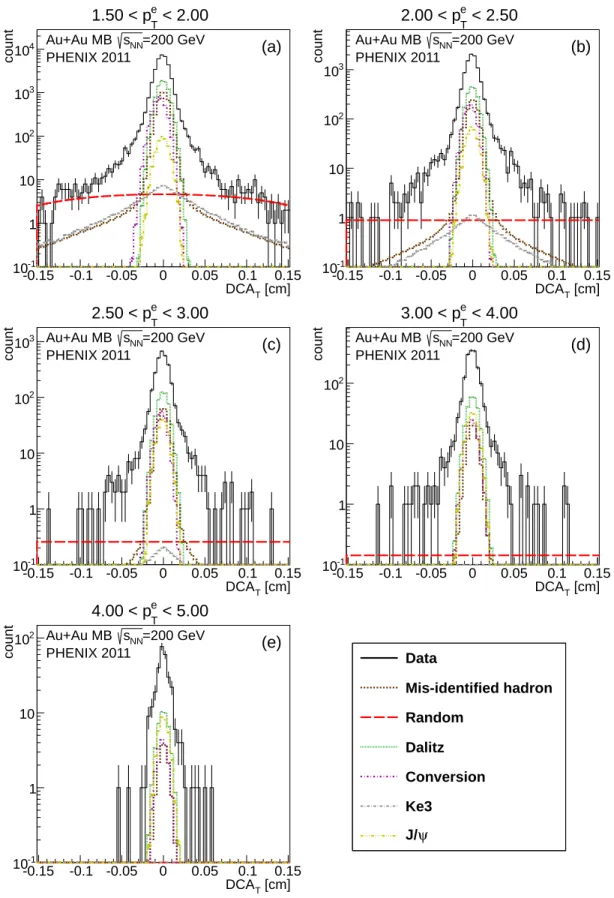
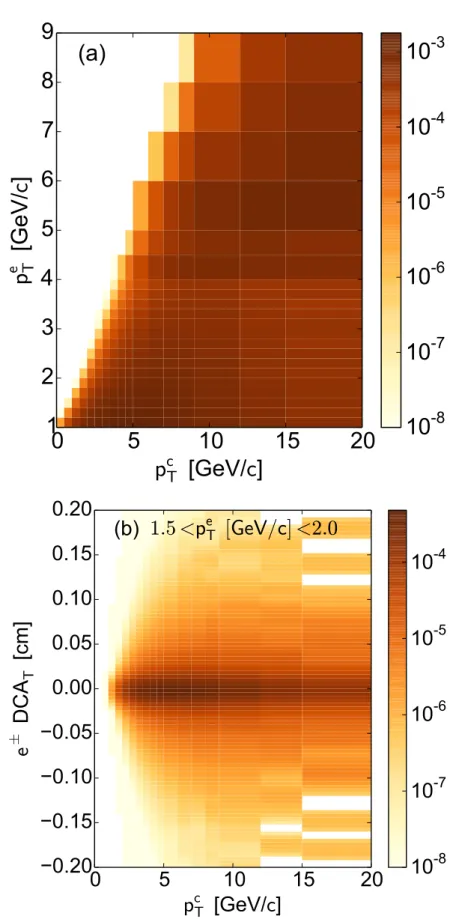
We divide the electrons into five pT bins and show the DCAT distributions for each in Fig. 5. These distributions
432
are in integer-value counts and are not corrected for acceptance and efficiency. The DCA distributions include various
433
background components other than heavy flavor contributions. The background components are also shown in the
434
figure and are discussed in the next section (Section III E).
435
While the DCAT distributions in Fig. 5 are plotted within |DCAT| < 0.15 cm, only a |DCAT| < 0.1 cm is used in
436
the analysis to extract the charm and bottom yield described later. At large DCAT, the distribution is dominated by
437
high-multiplicity background (Sec. III E 2) and therefore provides little constraint in the extraction of the charm and
438
bottom contributions.
[cm] L DCA -0.2 -0.1 0 0.1 0.2 counts 1 10 2 10 3 10 4 10 5 10 6 10
All Tracks
MB
< 2.5
T2.0 < p
(a)
[cm] T DCA -0.15 -0.1 -0.05 0 0.05 0.1 0.15 counts 1 10 2 10 3 10 4 10 5 10 6 10 7 10All Tracks
MB
< 2.5
T2.0 < p
(b)
[GeV/c]
Tp
1 1.5 2 2.5 3 3.5 4 4.5m]
µ
[
σ
TDCA
30 40 50 60 70 80 90(c)
FIG. 4. Distance-of-closest-approach distributions for (a) along the beam axis DCAL and (b) transverse plane DCAT for all
VTX-associated tracks in Au+Au at√sN N = 200 GeV in the range 2.0 < pT[ GeV/c] < 2.5. (c) The DCAT resolution as a
[cm] T DCA -0.15 -0.1 -0.05 0 0.05 0.1 0.15 count -1 10 1 10 2 10 3 10 4 10
< 2.00
e T1.50 < p
(a)
=200 GeV NN s Au+Au MB PHENIX 2011 [cm] T DCA -0.15 -0.1 -0.05 0 0.05 0.1 0.15 count -1 10 1 10 2 10 3 10< 2.50
e T2.00 < p
(b)
=200 GeV NN s Au+Au MB PHENIX 2011 [cm] T DCA -0.15 -0.1 -0.05 0 0.05 0.1 0.15 count -1 10 1 10 2 10 3 10< 3.00
e T2.50 < p
(c)
=200 GeV NN s Au+Au MB PHENIX 2011 [cm] T DCA -0.15 -0.1 -0.05 0 0.05 0.1 0.15 count -1 10 1 10 2 10< 4.00
e T3.00 < p
(d)
=200 GeV NN s Au+Au MB PHENIX 2011 [cm] T DCA -0.15 -0.1 -0.05 0 0.05 0.1 0.15 count -1 10 1 10 2 10< 5.00
e T4.00 < p
(e)
=200 GeV NN s Au+Au MB PHENIX 2011 Data Mis-identified hadron Random Dalitz Conversion Ke3 ψ J/FIG. 5. (Color Online) DCAT distributions for electrons in MB Au+Au at
√
sN N = 200 GeV that pass the reconstruction and conversion veto cut in the indicated five electron-pT selections. Also shown are the normalized contributions for the various
E. DCA distribution of Background Components
440
The sample of candidate electron tracks that pass all the analysis cuts described above contains contributions from
441
a number of sources other than the desired electrons from semi-leptonic decays of charm and bottom hadrons. In order
442
to extract the heavy flavor contributions, all background components must be fully accounted for and their DCAT
443
shapes as a function of pT incorporated. These background components are listed in the order presented below.
444 1. Misidentified hadrons 445 2. High-multiplicity background 446 3. Photonic electrons 447
4. Kaon decay electrons
448
5. Heavy-quarkonia decay electrons
449
As described in this and the following section, all background components are constrained by PHENIX
measure-450
ments in Au+Au and are fully simulated through a geant3 description of the detector. This method is similar to
451
the cocktail method of background subtraction used in the previous analysis of inclusive heavy flavor electrons [12].
452
Next, we describe these background sources and their DCA distributions. The first two components are caused
453
by detector and multiplicity effects. DCA distributions and normalization of these two components are determined
454
by data driven methods, as detailed in this section. The last three components are background electrons that are
455
not the result of semi-leptonic decays of heavy flavor hadrons. Their DCA distributions are determined by Monte
456
Carlo simulation, and their normalization is determined by a bootstrap method described in section III F. Of those
457
background electrons, photonic electrons are the dominant contribution. We developed a conversion veto cut to
458
suppress this background (III E 3).
459
1. Mis-identified hadron
460
As detailed in the discussion on electron identification, there is a nonzero contribution from mis-identified electrons.
461
This contribution is modeled via the RICH swap-method described in Section III C 2. From this swap method, we
462
obtain the probability that a charged hadron is mis-identified as an electron as a function of pT. This probability is
463
then applied to the DCA distribution of charged hadrons to obtain the DCA distribution of mis-identified hadrons.
464
The resulting DCAT distribution is shown in each panel of Fig. 5. Note that this component is properly normalized
465
automatically. For each pT bin, the DCA distribution of mis-identified prompt hadrons has a narrow Gaussian peak
466
at DCAT = 0. The broad tails for large |DCAT | are mainly caused by decays of Λ and KS0. In all pT bins the
467
magnitude of this background is no more than 10% of the data for all DCAT
468
2. High-multiplicity background
469
Due to the high multiplicity in Au+Au collisions, an electron candidate track in the central arms can be associated
470
with random VTX hits. Such random associations can cause a background that has a very broad DCAT distribution.
471
Although the total yield of this background is only ' 0.1% of the data, its contribution is significant at large DCAT
472
where we separate b → e and c → e.
473
To evaluate the effect of event multiplicity on the reconstruction performance, we embed simulated single electrons—
474
i.e. the response of the PHENIX detector to single electrons that is obtained from a geant3 simulation—into data
475
events containing VTX detector hits from real Au+Au collisions. The events are then processed through the standard
476
reconstruction software to evaluate the reconstruction performance in MB Au+Au collisions.
477
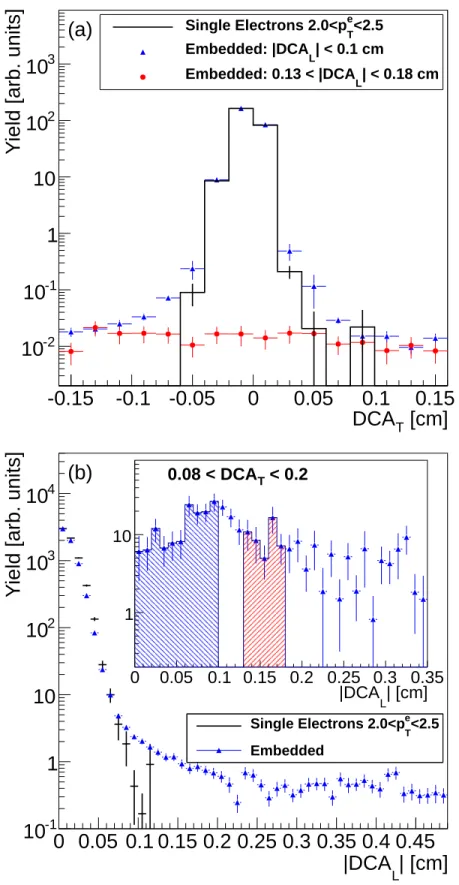
The reconstructed DCAT and DCAL for embedded primary electrons in MB Au+Au collisions is shown in Fig. 6.
478
Here the histograms, labeled as “Single Electrons”, show the reconstructed DCAT and DCALdistributions of primary
479
electrons before embedding. The DCAT distribution comprises a narrow Gaussian with no large DCAT tail and the
480
DCAL distribution comprises a similar, but slightly broader, Gaussian with no large tail. The blue filled triangles
481
show the DCAT and DCALdistributions after embedding. The DCAT and DCAL distributions comprise a Gaussian
482
peaked at DCAT(DCAL) ∼ 0 which is consistent with the distribution before embedding. This demonstrates that the
483
DCA resolution of the VTX is not affected by the high multiplicity environment. However, the embedded distributions
484
have broad tails at large |DCAT| and |DCAL|.
[cm]
TDCA
-0.15
-0.1 -0.05
0
0.05
0.1
0.15
Y
ie
ld
[
a
rb
.
u
n
it
s
]
-210
-110
1
10
210
310
<2.5 T e Single Electrons 2.0<p | < 0.1 cm L Embedded: |DCA | < 0.18 cm L Embedded: 0.13 < |DCA(a)
| [cm]
L|DCA
0 0.05 0.1 0.15 0.2 0.25 0.3 0.35 0.4 0.45
Y
ie
ld
[
a
rb
.
u
n
it
s
]
-110
1
10
210
310
410
<2.5 T e Single Electrons 2.0<p Embedded(b)
| [cm]
L|DCA
0
0.05 0.1 0.15 0.2 0.25 0.3 0.35
1
10
< 0.2
T0.08 < DCA
FIG. 6. (Color Online) Simulated primary electron (a) DCAT and (b) DCALdistribution before and after embedding in real
Au+Au data.
As shown in Fig. 6(b), tracks with |DCAL| > 0.13 cm are dominated by random associations, as they are not
486
present in the “Single Electron” sample. We therefore use the DCAT distribution for tracks with large |DCAL|
as an estimate of this random high-multiplicity background. We choose the region 0.13 < |DCAL| cm < 0.18 to
488
represent this background, and restrict our signal to |DCAL| < 0.1 cm. The DCAT distribution of tracks with
489
0.13 < |DCAL| cm < 0.18 must be normalized in order to be used as an estimate of the high-multiplicity background
490
for tracks within |DCAL| < 0.1 cm. This normalization is determined by matching the integrated yield of embedded
491
primary electrons in each |DCAL| region for 0.08 < DCAT cm < 0.2, as shown in the inlay of Fig. 6(b). The region
492
0.08 < DCAT cm < 0.2 is dominated by random associations, as shown in Fig. 6(a), and is therefore safe to use for
493
determining the normalization. The normalization of the high-multiplicity background is determined to be 2.89±0.29.
494
The red filled circles in Fig. 6(a) show the embedded DCAT distribution with large DCAL(0.13 < |DCAL| cm < 0.18).
495
This distribution agrees with the embedded DCAT distribution (blue filled triangles in Fig. 6) for large DCAT. This
496
demonstrates that the tails for large DCAT are well normalized by the distribution of electrons with large DCAL.
497
However, there is a small excess in the region 0.05 < |DCAT| cm < 0.10 that is not accounted for by the distribution
498
with large DCAL. We address this excess in the systematic uncertainties, as described in Sec. III H, where it is found
499
to have only a small effect on the extraction of b → e and c → e.
500
In each panel of Fig. 5 the high-multiplicity background is shown as a red line. It is determined from the DCAT
501
distribution of the data within 0.13 < |DCAL| cm < 0.18, as described above. The number of electron tracks in the
502
large DCAL region is small. We therefore fit the resulting DCAT data in each pT bin with a smooth function to
503
obtain the shape of the red curves shown in Fig. 5. A second order polynomial is used in the lowest pT bin, where
504
there are enough statistics to constrain it. The higher pT bins are fit with a constant value. All curves are multiplied
505
by the same normalization factor, determined from embedded simulations as described above.
506
3. Photonic electrons and conversion veto cut
507
Photon conversions and Dalitz decays of light neutral mesons (π0 and η) are the largest electron background. We
508
refer to this background as photonic electron background as it is produced by external or internal conversion of
509
photons.
510
The PHENIX Collaboration has previously published the yields of π0 and η mesons in Au+Au collisions at
511
√
sN N = 200 GeV [49, 50]. In addition to the electrons from Dalitz decays of these mesons, the decay photons
512
may convert to an e+e− pair in the detector material in the beam pipe or each layer of the VTX. The PHENIX
513
Collaboration has also published the yields of direct photons in Au+Au collisions at√sN N = 200 GeV [3, 51], that
514
can also be a source for conversions.
515
In principle with these measured yields, combined with simple decay kinematics and a detailed geant3 description
516
of the detector material and reconstruction algorithm, one could fully account for these photonic electron contributions
517
as a function of DCAT and pT. However, systematic uncertainties on the measured yields for the π0, η, and direct
518
photons would then dominate the uncertainty of the heavy flavor electron extraction. Therefore, we utilize the VTX
519
detector itself to help reject these contributions in a controlled manner.
520
We require that at least the first three layers of the VTX have hits associated with the electron track. Conversions
521
in B1 and subsequent layers are rejected by the requirement of a B0 hit, leaving only conversions in B0 and the beam
522
pipe. The requirement of B1 and B2 hits enables us to impose a conversion veto cut, described below, that suppresses
523
conversions from the beam pipe and B0.
524
The conversion veto cut rejects tracks with another VTX hit within a certain window in ∆φ and ∆z around hits
525
associated with a VTX-associated track. Photons that convert to an e+e−pair in the beam pipe will leave two nearby
526
hits in the first layer (B0) and/or subsequent layers of the VTX, and thus be rejected by the conversion veto cut.
527
Similarly, conversions in B0 will result in two nearby hits in the second layer (B1) and/or subsequent outer layers.
528
The same is true for e+e− from a Dalitz decay, though with a larger separation due to a larger opening angle of the
529
pair.
530
Figure 7(a) shows distribution of chrg ∆φ of hits in B0 relative to the electron track, where chrg is the charge of
531
the track. The red (circle) histogram shows the data in MB Au+Au collisions. If the track at the origin is not an
532
electron, we have a flat distribution due to random hits in the detector. These random hits have been subtracted in
533
Fig. 7(a). The transverse momentum of the electron track is in the interval 1 < pT GeV/c < 2.
534
As mentioned above, these correlated hits around electron tracks are caused by the partner e+ or e− of Dalitz
535
decays or photon conversions. The left-right asymmetry of the distribution is caused by the fact that the partner
536
e± track is separated from the electron track by the magnetic field and the direction of the separation is determined
537
by the charge of the electron track. In the distribution of chrg ∆φ, the partner track is bent towards the positive
538
direction.
539
The black (triangle) histogram in Fig. 7(a) shows the distribution from Monte Carlo simulations. In the simulation,
540
the response of the PHENIX detector to single π0s is modeled by geant3, and the resulting hits in the VTX and the
541
central arms are then reconstructed by the same reconstruction code as the data. The correlated hits in the simulation
[rad]
φ
∆
chrg
-0.06 -0.04 -0.02
0
0.02
0.04
0.06
count
210
310
410
510
e
±(data)
(sim)
±Photonic e
(a)
at B0
φ
∆
chrg
[GeV/c]
Tp
0 0.5 1 1.5 2 2.5 3 3.5 4 4.5 5
[rad]
φ∆
chrg
-0.06
-0.04
-0.02
0
0.02
0.04
0.06
1 10 2 10 3 10)
Tvs p
φ
∆
chrg
Veto residual B0 (
(b)
FIG. 7. (Color Online) (a) Distribution of correlated hits in B0 near electron tracks for 1 < pT < 2 GeV/c. The red (circle)
points are from Au+Au data and the black (triangle) points are from Monte Carlo simulation. The insert in (a) illustrates the electron pairs from Dalitz decays. (b) The window of the conversion veto cut for B0 layer (hatched) and the hit distribution near electron track in 2D space of chrg ∆φ vs pT of electrons in Au+Au collisions. (See the text for details).
are caused by the Dalitz decay of π0 and photon conversion in the material of the beam pipe and the VTX itself.