AND ANISOTROPIC MEDIA
I: FINITE DIFFERENCE METHOD
by
Ningya Cheng, CoHo Cheng, and MoNo Toksoz
Earth Resources Laboratory
Department of Earth, Atmospheric, and Planetary Sciences Massachusetts Institute of Technology
Cambridge, MA 02139
ABSTRACT
In this paper we developed a 3-D finite difference method to simulate wave propagations in an isotropic medium. The wave equation is formulated into the first-order hyperbolic equations by using velocity and stress and then discretizing it on a staggered grid. The 3-D time domain finite difference scheme is second order accurate in time and fourth order accurate in space. The grid dispersion and anisotropy are analyzed and the stable condition of the scheme is obtained. Higdon's absorbing boundary condition is discussed and generalized to the anisotropic medium. The scheme can provide realistic 3-D wave propagation simulation by the use of a parallel computer.
The scheme is tested in the homogeneous medium. The finite difference results agree excellently with the analytic solutions of a point explosion source in the acoustic medium and a point force source in the elastic medium. The finite difference method accurately models not only the far field P and S waves, but also the near field term. It demonstrates that the second-order Higdon's absorbing boundary condition works very well in an acoustic and elastic medium.
INTRODUCTION
Finite difference method is widely used in wave propagation simulations. It is one of the pure numerical techniques to provide the full wave solutions for problems with a complex geometry. The application of the finite difference method to seismology can be dated back more than two decades since the digital computer became available. These early applications of the finite difference method were based on the displacement formulation of the wave equations (Alterman and Karal, 1968; Boore, 1972; Alford et al., 1974; Kellyet al., 1976). The second order wave equations are directly discretized on grid. The sharp interior boundaries are treated explicitly to match the displacement and stress boundary conditions. This approach makes the program difficult to write, and limits the flexibility of the method. It also lacks the ability to eliminate the artificial boundary reflections.
8 Cheng et aI.
The next wave of applications of the finite difference method came with the progress in absorbing boundary condition research and a new staggered grid scheme. First the absorbing boundary condition: Lindman (1975) derived an absorbing boundary condi-tion for the acoustic wave equacondi-tion by using a one way equacondi-tion and racondi-tional expansion. The formula involves high order derivatives which is a drawback, but with only three correction terms it can achieve less than 1 percent reflections for the incident angle range from 0 to 89 degrees. A similar absorbing boundary condition can also be obtained for the evanescent waves. Randall (1988, 1989) extended Lindman's idea to the elastic wave case and the staggered grid scheme. Itis not very easy to implement Lindman's absorbing boundary condition on a computer. Also it is not very clear how to treat the grid corners and the behavior of the condition when it encounters the lateral inhomo-geneity. A very popular absorbing boundary condition was discussed by Clayton and Engquist (1977). It is based on paraxial approximation for the wave equations. There are some improvements to this approach(e.g., Fuyuki and Matsumoto, 1980; Emerman and Stephen, 1983; Stacey, 1988; Renaut and Petersen, 1989). This condition needs special treatment at the corner of the grid. The high order Clayton's absorbing bound-ary condition also doesn't work well when it encounters lateral discontinuity. Another class of absorbing boundary conditions only involves the derivatives perpendicular to the boundary (Reynolds, 1978; Liao et al., 1984; Higdon, 1986, 1987, 1990; Peng, 1994). The conditions are directly derived in the discretized form. These schemes work well at the boundary with the lateral inhomogeneity. There is no special treatment at the corner of the grid. Another advantage is that it is very easy to implement.
There are a lot of other ideas to eliminate the artificial boundary reflections. Vis-cous damping can be added near the boundaries of the grid to attenuate incoming waves (Lysmer and Kuhlemeyer, 1969; Kosloff and Kosloff, 1986). The damping can absorb different wave types effectively. It is the easiest absorbing boundary condition to pro-gram. The disadvantage is that the damping layer thickness is frequency dependent. It wastes a lot of grids to absorb low frequency waves. Another idea is to combine the one way wave equation with the damping layer to transport the wave energy out of the grid (Israeli and Orszag, 1981). Smith (1974) proposed an interesting way to get rid of the boundary reflections. He solves the problem twice: once with the Dirichlet boundary condition and once with the Newman boundary condition, then adds the two solutions together to cancel the reflections. But for n artificial boundaries the problem needs to be solved 2n times. The absorbing boundary conditions can also be constructed from variational principles (Daalen et al., 1992; Broeze and Daalen, 1992). This is a general method and it works with any wave equation, linear or non-linear.
The staggered grid scheme was developed by Madariaga (1976) to model an ex-panding circle crack in an elastic medium. Virieux (1984,1986) applied the scheme to model SH and P-SV wave propagation problems in the 2-D case. The second order wave equation is reformulated to first order hyperbolic equations using velocity and stress. Levander (1988) extended the staggered grid scheme to the fourth-order finite difference for the P-SV problem. There are two advantages to the staggered-grid scheme over the conventional schemes. First the staggered grid scheme is stable for any Poisson's ratio. Second, the grid dispersion and anisotropy are small and insensitive to Poisson's ratio. Lou and Schuster (1990) presented a staggered grid scheme which requires less
com-puter memory. Peng (1994) applied a staggered grid finite difference method to VSP problems.
From a programming point of view, the finite difference method is very straight for-ward to implement. But it suffers not only from the grid dispersion and anisotropy, but also from the reflections from the artificial boundaries, which contaminate the solution. These artifacts have to be well controlled to make the finite difference solution mean-ingful. The benchmark test is used to check the 2-D finite difference method for the elastic wave propagation problem (Virieux, 1986; Levander, 1988). This test compares the finite difference results with the analytic solution of Lamb's problem. It checks the body waves as well as the surface waves. But for the 3-D finite -difference method it is not rigorously tested. Igel et al. (1991) showed the seismograms and the snapshots from a 3-D finite difference simulation without any comparisons with the known solutions. Later they did some analysis of finite difference solutions but only for the homogeneous medium (Igel et aI., 1992; Rodrigues and Mora, 1992). Frankel and Vidale (1992) used a 3-D finite difference to simulate seismic wave propagations in a valley. They adopted old fashioned displacement schemes (Kelly et a!., 1976). The comparison with the syn-thetics from the reflectivity method is not very convincing. Yoon and McMechan (1992) displayed a lot of seismograms and snapshots of the 3-D finite difference simulations of wave propagation in the borehole environments. But, again, they didn't show any tests of the method. The 3-D staggered grid scheme was also applied to model the acoustic scattering from seafloor topography (Burns and Stephen, 1990; Burns, 1992).
Even with all the progress made in absorbing the reflection and discretization scheme, most applications of the finite difference method are still for the 2-D problems because of limited computer power. Parallel computing opens the door to realistic 3-D wave propagation simulations. In this paper we formulate a 3-D time domain finite difference method for wave propagation in an isotropic elastic medium. The first order hyperbolic equations are discretized on a staggered grid. The grid dispersion, the grid anisotropy, and the stability condition are analyzed. Then Higdon's absorbing boundary condition is discussed. The implementation of this scheme on the parallel computer is described. Finally, the finite difference method is tested in a homogeneous acoustic and elastic medium.
FORMULATION
Wave propagation in an elastic medium can be described by the equation of motion as:
(1)
where p is the density, Ui is the displacement vector component, and Tij is the stress
tensor. A comma between subscripts is used for spatial derivatives. The summation convention for repeated subscripts is also used. The generalized Hooke's law links the stress tensor Tij to the strain tensorCij in the linear fashion
10
Cheng etal.
Tij = Cijklckl (2)
where Cijkl is the fourth-order elastic constant tensor, and the strain tensor is defined as:
(3) In the case of an isotropic medium, the elastic constant tensor can be written as
Cijkl = A{jijl5kl
+
jl({jik{jjl+
{jU{jjk) (4) where {jij is the Kronecker delta, that equals 1 as i = j; otherwise it equals zero. The isotropic elastic medium has only two independent constants A and jl, called Lame constants. The P wave velocity a is given byJ
A~
2jl and the S wave velocity (3 is given by[if.
The equations given above are coordinate independent. Here, a Cartesian (x,y,z) coordinate is chosen. Equation (1) and (2) can be transformed into first-order hyperbolic equations. Equation (1) is rewritten using the velocity instead of the displacement. Then one takes the first-order time derivative on both sides of Equation (2). Writtten out in their component form, we have
Bvx BTxx BTxy BTxz
p - = - + - + -
at
Bx By Bz Bvy BTxy BTyy BTyz (5)p - = - + - + -
at
Bx By Bz Bvz _ BTxz BTyz BTzzp
Bt - Bx+
By+
8z and 8Txx (A 2)8vx A8vy A8vz =+ jl-+
+
-Bt 8x 8y 8z 8Tyy A8vx (A 2 )8vy A8vz =- +
+ j l +
-at
8x 8y Bz 8Tzz A8vx A8vy (A 2 )8vz (6) =- + - +
+ j l
-Bt 8x 8y Bz 8Txy (8vx 8vy ) =j l +
-at
8y 8xBT
xz (8vx 8vz )at
j l - + -
. 8z 8x 8Tyz (8vy 8vz )j l +
-at
Bz 8ywhere (vx, vy, vz) is the velocity vector. The reason for formulating the second-order wave equations into the first-order hyperbolic system of equations is that once this system is discretized on a staggered grid, it is valid for any Poisson's ratio (Virieux, 1986). The fluid-solid boundary can be treated simply by setting shear modulus to zero. Equations (5) and (6) are the wave equations in a different form. This velocity and stress formulation is the starting point of the finite difference method.
FINITE DIFFERENCE APPROXIMATION
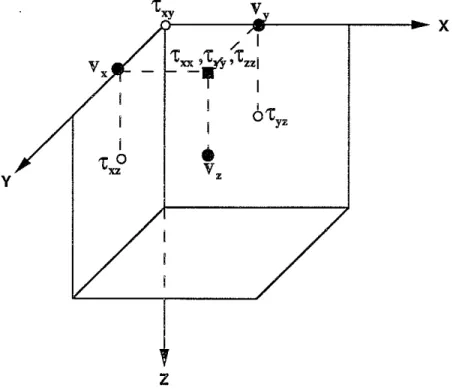
The first-order hyperbolic equations (5) and (6) are discretized on a staggered grid, which is shown in Figure 1. The velocities and stresses are arranged differently from the usual scheme. The velocityVx is shifted a half grid in the Y direction, the velocity
v y is shifted a half grid in the X direction, and the velocityVz is shifted a half grid in all
three directions. But the arrangement still centers all the finite difference operators. In the later applications of the finite difference method to borehole wave propagations, the borehole wall is aligned on the grid with the shear stress. For a 3-D grid in Cartesian coordinates (m6.x, n6.y, k6.z) at time i6.t, where 6.x,6.y and 6.z are the grid size in X,Y,Z directions and 6.t is the time step, we define the second order forward finite difference operator in the time Dt as
i+l i
D
Ii
_
fm,n,k - fm,n,k t m,n,k - !::>..tand the fourth-order forward finite difference operator in space Dx , Dy and Dz as
D
Ii
_
f:"+l,n,k - f:",n,k+
f;"+2,n,k - f:"-1,n,k x m,n,k - 171 6.x 172 6.x DIi
_
f:",n+l,k - f:",n,k+
f:",n+2,k - f:",n-1,k Y m,n,k - 171 6.y 172 6.y DIi
_
f:",n,k+l - f:",n,k+
f:",n,k+2 - f:",n,k-1 z m,n,k - 171 6.z 172 6.z (7) (8) 9 1where 171
=
8"
and 172=
24 are the coefficients of the fourth-order finite difference approximation to the first-order derivative. The finite difference approximation to the equations (5) and (6) with the second-order accuracy in time and the fourth-order accuracy in space can be written asD vi - 1/ 2 Pm.n+l/2,k t xm,n+l/2,k D vi - 1/ 2 Pm+l/2,n,k t Y-m+l/2,n,k
=
Dr.x xX=+1/2,n+l/2,ki +Dr.Y XYm,n+l,ki +Dzr.xZm ,n+l/2,k+l/2i Dxr.XYm+l,n,ki+
Dyr.YYm+l/2,n+l/2,ki +Dzr.yZtn+l/2,n,k+l/2i Pm+l/2,n+l 2,k+l 2/ / Dtvzm+l/2.n+l/2,k+l/2i - 1/ 2 = Dxr.xZm +l,n+lj2,k+l/2i (9)12 Cheng et al.
+D
r.i+D
Ti 11 1/Z771.+1/2,n+1,k+1/2 z ZZm+1/2,n+1/2,k+l and Dtr.i YYm+l/2,n+l/2,k D Ti t ZZm+lj2,n+lj2,k D'T.t XZ17l ,n+l/2,k+l/2i Dtr.YZm+l/2,n,k+lj2iDtT~Ym,n.k
= (J.. + 2") D Vi+l/2 t'" m+l/2.n+l/2,k x X=+l,n+l/2,k +J.. D vi+l/2 m+l/2,n+l/2,k 11 Ym+l/2,n+l,k +J.. D Vi+l/2 m+l/2.n+l/2,k z Zm+l/2,n+l/2,k+l/2 J.. D vi+l/2 m+l/2,n+l/2,k x Xm +l,n+l/2,k +(J..+
2i")m+l/2,n+l/2,kDyv;~%~2,n+l.k
+ J..m+l/2,n+l/2,kDzvi+l/2%=+1/2,n+1/2,k+l/2 J.. D vi+l/2 m+l/2,n+l/2,k x Xm +l,n+l/2,k +J.. D vi+l/2 m+l/2,n+l/2,k 11 1Im+l/2,n+l,k +(J..+
2i")m+l/2,n+l/2,kDzv;~%~2.n+l/2,k+l/2
= " (D vi+l/2+
D vi+l/2 ) t""m,n+l/2,k+l/2 z Xm.,n+l/2,k+l x Zm+lj2,n+lj2,k+l/2 i"m+l/2,n,k+1/2(DZv;~~'~2.n.k+l
+
DyV;~~'~2,n+l/2.k+'/2)
(D vi+l/2 D vi+l/2 ) J.Lm,n,k 11 xm ,n+l/2,k x 1Im+1/2,n,k . (10) (11) = = Pm+l/2,n,k Pm.n+l/2,k Pm+l/2,n+l/2,k+l/2The medium parametersP,J..and i"are given at a grid point
(m+!, n+!,
k), where the normal stressesTxx ,Tyy ,Tzz are assigned (see Figure 1). Inthe calculation to update velocities, the needed density values are obtained from the average of the two assigned densities nearby. This can be written asPm+l/2,n+l/2,k
+
Pm-l/2,n+l/2,k 2 Pm+l/2,n+l/2,k+
Pm+l/2,n-l/2,k 2 Pm+l/2,n+l/2,k+l+
Pm+l/2,n+l/2,k 2The shear moduli used to update the shear stress are determined by the harmonic average of the four shear moduli nearby instead of the arithmetic average (Kostek, 1991). The reason is that the propagated wavelength is much larger than the grid size.
4 1 1
=
+
-i"m,n,k i"m+l/2,n+l/2,k i"m-l/2,n+l/2,k
1 1 i"m,n+l/2,k+l/2 4
+
+
i"m+l/2,n-11.2,k i"m-l/2,n-l/2,k 1 1=
(12) 41 1
+
+
-I'm+l/2,n-l/2,k I'm+l/2,n-l/2,k+l
This harmonic average method can automatically put the shear modulus zero at the fluid-solid boundary,
DISPERSION ANALYSIS AND STABLE CONDITION
In order to do dispersion analysis, we consider a plane wave ei(wt-k,x-kyY-k,z), which makes an angle of 71> 72, 73 with the x,y,z axis, respectively, These angles can be determined by COS7l
=
k:,
COS72=
!'t
and COS73=
~,
wherek
is the wavenumber, It is obvious that these angles satisfy(13)
The dispersion relation for the P wave is
(~)2=k2+e+e
0: x y z (14)where W is the angular frequency. The dispersion relation for the S wave is
The first order time derivative
~
is approximated with the second-order centered finite difference on the staggered grid and is equivalent to approximatingwas numericalWn . This numericalWn is given by
It is very easy to show that
2 t>.t Wn = t>.tsin(Zw). lim Wn = W. Llt-O (16) (17) It says that the finite difference becomes derivative as t>.tgoes to zero. The first-order spatial derivatives are approximated by the fourth order centered finite difference on the staggered grid, which is equivalent to approximated kx , ky ,kz as numerical kxn , kYn' kzn . These numerical kxn , kYn and kZn are given by
14
Cheng et al.2 . l:1.y 2 . 31:1.y
kyn
=
1]11:1.ysm(Tky)+
1]21:1.ysm(-2-k,,) kZn=
1]1I:1.z2 .sm(l:1.z k )T
x+
1]2I:1.z stn2 . (3l:1.z-2-kx) We can also show that:lim kXn
=
1]1+
31]2=
1 .6.x-O lim kYn = 1]1+
31]2 = 1 Lly-O lim kZn=
1]1+
31]2=
1 . Llz_OSo the numerical dispersion relation of the P wave becomes
(18)
(19)
( Wn)2= k2
+
k2+
k2 _ (20)0: Xn Un Zn
To simplify the analysis we assume that I:1.x
=
l:1.y=
I:1.z=
1:1.. This assumption is always used for the numerical simulations in the later part of this paper. We introduce the non-dimensional quantity ~ as~
=
a I:1.t 1:1. and the non-dimensional quantity H as(21)
H=~
Aw
~)
where Aw is the wavelength. The quantity ~ controls the numerical dispersion and H controls the sample rate per wavelength. qp is defined as the ratio of the numerical P wave velocity to the true P wave velocity. Substituting~ and H into equation (20) and with some algebra manipulations we obtain:
qp
=
1f:Hsin-1(~VA~
+
~
+
A~)
where Ax, Ay and Az are defined as
Ax
=
1]1sin(1fH COS"(1)+
1]2sin(31fH COS"(1)Ay
=
'f/1sin(1fHcos"!2)+
'f/zsin(31fHcos"!2) Az=
1]1sin(1fHcos"!3)+
1]2sin(31fHcos"!3) .(23)
(24)
It is obvious that qp is independent of Poisson's ratio v. Similarly, q., defined as the ratio of the numerical S wave velocity to the true S wave-velocity, can be obtained as
_ _a_ - -l(fi IA2 A2 AZ)
(26) To check the simple case, we consider the second-order finite difference (set Til
=
1 and Tl2=
0) in two dimensions (Az=
0). Equation (23) and (25) are reduced to thedispersion formulas given by Virieux (1986). Notice the definition difference of the quantity ~, which has a
v'2
factor.Dispersions of P wave phase velocity caused by the discretization are shown in Figure 2. Three different wave propagation directions are considered: (1) along the X axis ('"n = 0,"12 = 90,"13 = 90). (2) along the diagonal of the X-V plane and perpendicular to the Z axis ("(1 = 45,"12 = 45,"13 = 90). (3) along the diagonal of a cube ("(1 = 54.7,"12 = 54.7,"13 = 54.7).
~
is set at~.
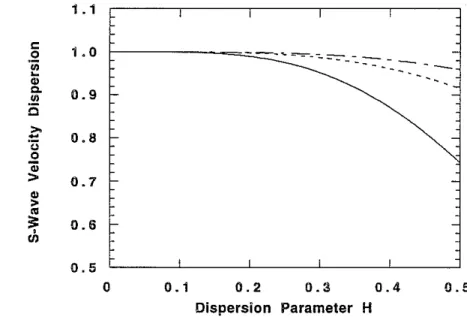
The fourth-order finite difference and the second-order finite difference are shown in plot (A) and (B), respectively. For the second-order finite difference the numerical P wave velocity is slower than the true P wave velocity. For the fourth-order finite difference this is not always the case. The numerical velocity is greater or smaller than the true velocity depending on the wave propagation direction and the grid size.Dispersions of S wave phase velocity are shown in Figure 3 with the same propagation directions and~value as the P wave. In the shear wave case, the dispersion is dependent on the Poisson's ratio. Here v equals 0.25. The numerical shear wave velocity is generally slower than the true shear wave velocity for both the fourth-order and the second-order finite difference. The qs does not degrade as Poisson's ratio v approaches 0.5, as shown in Figure 4, where v is set at 0.4999. This is the reason why the staggered grid is good for modeling the fluid-solid boundary.
The grid anisotropy is caused by the wave traveling on the discrete grid in a different direction with a different velocity. This anisotropy is shown in Figure 5 for the P wave, and Figure 6 for the S wave for the fourth-order finite difference. In the plots the two axes of the angles are related to the propagation direction through
COS'Y1 cos(angle1)
COS'Y2
=
sin(angle1)*
cos(angle2) COS'Y3 = sin(angle1)*
cos(angle2) .The following values are used in the calculations: H = 0.2,
~
=~
and v = 0.25. There is about 1 percent P wave and S wave anisotropy from the discretization in the plot. For 10 samples per wavelength the grid anisotropy can be reduced to less than 0.1 percent.For both P and S waves, the fourth-order finite difference has much less dispersion and grid anisotropy than the second-order one. The rule of thumb is that we need 10 samples per wavelength for the second-order finite difference, and 5 samples per wave-length for the fourth-order finite difference to control the dispersion and the anisotropy at less than 1%.
The dispersion analysis can also be used to derive the stability condition of the scheme. The stability condition from Equation (23) is obtained by setting the argument
16 Cheng et al.
ofsin-1at less than 1 for any incident angle '1'1,)'2, '1'3, that is:
~J3(171l1
+
17)21)2<
1 put in the usual stable condition formt.
t.t
<
~---::---;---:--::-v'3a(I1Jl1
+
17)21) similarly the stable condition from Equation (25) is(27)
(28)
(29)
Because Equation (28) is more restrictive than (29) (a
>
{3), the real stability condition is Equation (28). In the 2-D case (Az = 0) the stable condition ist.
~ < ~ . (W)
2a(I7)11
+
17)21)This is the same as the one given by Levander (1988). In his paper the condition is misprinted. For the second-order finite difference (7)1 = 1 and 7)2 = 0) the condition is
t.
t.t
< -
(31)V3a
the same as the one given by Virieux (1986) for multi-dimension (n=3). The fourth-order stability condition is more restrictive than the second-fourth-order one. This is the price paid for less grid dispersion and grid anisotropy.
ABSORBING BOUNDARY CONDITION
The absorbing boundary condition is applied to the outside boundaries of the grid to minimize the reflections. Higdon's absorbing boundary condition is used (Higdon 1986, 1987, 1990). In his series of papers he worked directly with a discretized wave equation, rather than first finding the analytical boundary conditions and then discretizing them. These conditions turn out to be discretizations of some analytical boundary conditions that are perfectly absorbing for waves traveling at certain angles of incidence. These conditions are generalized for arbitrary angles of incidence and for the elastic wave problem.
For the purpose of application to elastic wave propagation problems, the absorbing boundary condition operator
m
a
a
B =
II
(Cj- - a-)j=1
at
ax
is applied to each component of the displacement vector atx
=
Xl. m is the order of theabsorbing boundary condition. Xl is the left boundary along the X axis. For the right
boundary of the X axis at X
=
X r the minus sign in (32) should be replaced by a plussign. The coefficients Cj are positive constants for all j. The similar operators can be
used for the boundaries along the Y and Zaxis by replacing
tx
in Equation (32) witha
a
ay
oraz'
The jth operator in (32) is perfectly absorbing for the P wave traveling at angles of incidence ±COS-1Cj, and for the S wave traveling at angles of incidence ±cos-1(c)'l.).
a As an example, in case of m
=
2, we can chose Cl=
1 and C2=
~ to absorb both theP and the S wave at zero incident angle perfectly. .
Define operatorsEx and Et as a forward shift in x and t
Ex m,n,kfi
Etf:n.n.k
f:n+l,n,k i+l
fm.n,k· (33)
The absorbing boundary condition operator in Equation (32) can be approximated by the finite difference operator as
parameters a and b give weighted space and time averages. Different a and b values result in different schemes. For example:
1. Forward Euler: a
=
0, b=
1. The stencil has an "L" shape.2. Backward Euler: a
=
0, b=
O. The stencil has an inverted "L" shape.1 1
3. Box scheme: a
=
2'
b=
2'
Ifthe boundary value of the displacementu is needed atX
=
xo, then the absorbingboundary condition is
(35) We solve this equation for Ui+l using the previous time step values. In our staggered
grid scheme, this condition not only applied to the velocities but also to the stresses.
Higdon's absorbing boundary condition can be applied directly to the corner of the grid. It only involves the differences perpendicular to the boundary, so it works well at the boundary with lateral discontinuity. The implementation is straight forward.
18 Cheng et aI.
Incompatibility can be removed by adding small positive constants OJ, at least one OJ is non-zero, to the absorbing boundary condition operator. Thus it becomes
m
a
a
B
=
II(c'- -
, :1& a -ax
+
0')J '
J=1
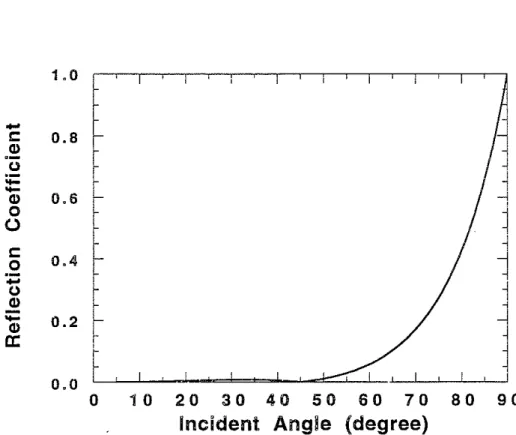
In the simple acoustic case the P wave reflection coefficient has magnitude
(36)
(37)
ft
I
cos OJ - cosOI
j=1 cosOj
+
cosOwhere OJ is the perfectly absorbing angle of incidence. For m
=
2 ,01=
0 and 02=
45, the reflection coefficient is plotted in Figure 7 as an example.PARALLEL
IMPLEMENTATION
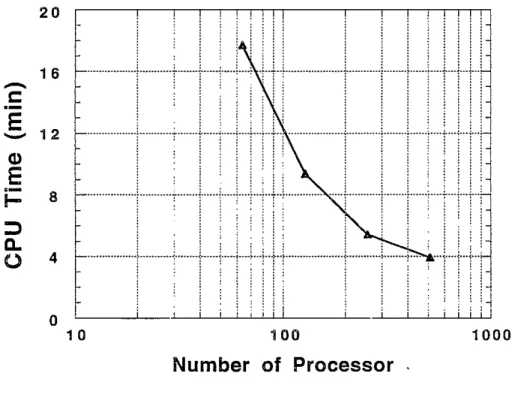
Applications of the finite difference method to 3-D problems are limited by the memory and speed of the computer. Parallel computing provides a new means to overcome these limitations. In the finite difference method all the calculations involve only local inter-actions of the velocities and stresses. For example, in the fourth-order finite difference scheme only two nearby grid points data are needed to update the current grid point. This can be efficiently executed on a multiple instruction and multiple data (MIMD) parallel computer. Each processor is assigned a subset of the whole grid. The finite difference is performed on this subset grid. When the calculations come to the grid near the subset boundary of the current processor, it requires velocity and stress values beyond the current processor. These required data are obtained from the nearby pro-cessor through communication. The communication time is short in comparison to the finite difference calculation time. There is a Grid Decomposition Package (GDP) on the nCUBE to do the job described above. The GDP can decompose a N dimension grid with given interactive lengths. The GDP assigns the subset of the grid to the processor in such a way that the subsets that are the neighbors in the grid will also be neighbors in the hypercube of processors. In the 3-D case these subsets are chosen to be as cubical as possible. This is because in the finite difference method the computation time is proportional to the volume of the subset and the communication time is proportional to the surface area. The best ratio of volume to surface that can be achieved is the cubical subgrid. The staggered-grid fourth-order finite difference scheme we discussed above is paralleled using the GDP on nCUBE 2. For example, a full elastic wave propagation in a 100 x 100 x 100 grid is performed using the fourth-order finite difference scheme. The subgrid of 12 x 12 x 12 is assigned to each processor when we use 512 of them. The subgrid is increased to 25 x 25 x 25 when we use 64 processors. The CPU time of the 100 time step calculations versus the number of processors is plotted in Figure 8. The log scale is used for processor numbers in the plot. Due to the limitation of 4 Mb memory on each processor we need at least 64 processors to run a 100 x 100 x 100 problem. The plot shows roughly that CPU time decreases linearly with the log number of processors.
TEST OF FINITE DIFFERENCE METHOD
We developed the fourth-order 3-D time domain finite difference method on the stag-gered grid. The scheme is implemented on a nCUBE 2 parallel computer. We first test the finite difference method in the homogeneous acoustic medium with a point explosion as source. Then we test it in the homogeneous elastic medium with a point force as source.
Homogeneous Acoustic Medium
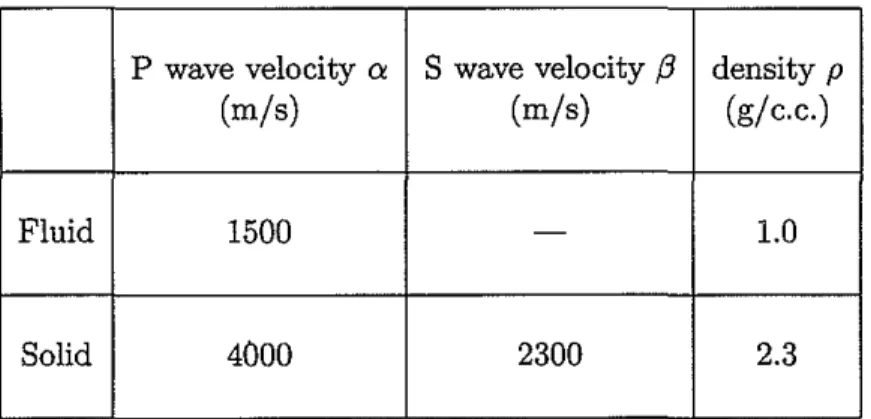
The test is started with the simplest model: the homogeneous acoustic medium. Al-though the finite difference method is developed for the elastic wave propagation prob-lems, the implementation of the acoustic medium is simply by setting shear moduli at zero. The physical parameters of the acoustic medium are listed in Table 0.1 under the entry fluid. The source is a point explosion. The source time function is a Kelly wavelet at center frequency 2.5 kHz; see Appendix A for more details about the Kelly wavelet. A Kelly wavelet is plotted in Figure 9 for the center frequency 2.5 kHz. The Kelly source time function is used in all the flnite difference calculations in this thesis. The wavelength in water at the center frequency isO.Bm. The grid size is taken as
2~
of this wavelength, which equals 0.03 m. The time step size is 0.008 ms, which gives a maximum P-wave velocity of 1500mls
for stability. A grid of 50 x 50 x 120 is used. The source is located at grid point (25, 25, 25) and the pressure receiver at (25, 25, 105). The source receiver distance is 2.4 m, which is 4 wavelengths. The second order Higdon's absorbing boundary condition is applied on all six boundary planes. The two preferred absorbing angles for the boundary along the Z axis are chosen as 5 degrees. The two preferred absorbing angles for the boundary along tge X and Y axis are chosen as 0 and 45 degrees, respectively.The analytic solution is very simple in this case. It is the source time function at retarded time t - !.- and the amplitude reduced by factor
1:.,
where r is thesource-a r
receiver distance. The finite difference result and the analytic solution are plotted in Figure 10. The amplitudes are normalized. The two waveforms are identical, we plot them separately to show the two waveforms. The snapshot of the pressure wavefield at time 1.2 ms is plotted in Figure 11. It shows the expansion of the P wavefront. The synthetic and the snapshot demonstrate Higdon's absorbing boundary condition is very effective in the acoustic medium. Another way to check the comparison is in the frequency domain. The waveforms from the finite difference and analytic solutions are transformed to frequency domain by FFT. They are plotted in Figure 12 from 0 to 20 kHz. The log scale is used for the vertical axis. Within the source frequency range (0 to 8 kHz) the two solutions agree very well. For frequency higher than 8 kHz, we see the numerical noise from the finite difference solution. This numerical noise is about 5 orders of magnitude smaller than the signal.
To simulate a point explosion source in the finite difference scheme the source time function is fed into the normal stresses "Txx ,"Tyy ,"Tzz . In the homogeneous
acous-20
Cheng et aI.tic medium we know the P wave amplitude will decrease by factor of
1
as it travels away from the point source, where R is distance from the source. The amplitudes from finite difference calculation from the point explosion source are plotted against1
in Figure 13. The distance is normalized by the center wavelength. The finite difference amplitudes follow1
excellently. The nearest data point from the finite difference calcu-lations is just one grid away from the source. This demonstrates that the point source is implemented correctly in the scheme.Homogeneous Elastic Medium
The next test is the homogeneous elastic medium. The homogeneous acoustic medium propagates only the compressional body wave. But the homogeneous elastic medium can propagate compressional as well as shear body waves. The physical parameters of the medium are listed in Table 0.1 under the solid entry. All geometries are the same as in the acoustic test. The grid size is determined by
io
of the wavelength of the shear wave at center frequency, which is 0.046 m. The time step size is 0.005 ms. The source-receiver distance is 4 wavelengths of the shear wave and 2.3 wavelengths of the P wave.The point force solution in a homogeneous elastic medium is given in Appendix
B. This solution includes the near field term, the far field P wave term, and the far field S wave term. The near field term includes both P and S wave motions. First the point vertical force (Jz) is used as the source. The receiver records the vertical velocity
(vz). The finite difference and analytic solutions are plotted in Figure 14. Due to the
radiation pattern of the shear wave, the shear wave amplitude is zero at this position. The seismogram shows the far field P wave term at the front and the near field term at the back. The finite difference and the analytic solutions are almost identical, so they are plotted separately.
Next, the point horizontal force (Jx) is used as the source. The receiver records the velocityVx . The comparison of the finite difference synthetic with the analytic solution
is shown in Figure 15. The radiation pattern of the P wave gives the zero amplitude at this receiver position. The seismogram shows a small near field term and a very large shear wave arrival. Once again the comparison is excellent.
The snapshot of the vertical velocity field due to a vertical force is shown in Figure 16. The field is dominated by the shear wave, which is symmetric about the _vertical Z axis. A very small P wave can be observed at the lower part of the image. This test demonstrates that the finite difference method can model not only the far field P and S waves, but also the near field term. The seismograms and the wavefield image also show that Higdon's absorbing boundary condition works very well in the elastic medium.
CONCLUSION
In this paper we developed the 3-D time domain staggered grid finite difference method, whiCh is the fourth-order accuracy in space and the second-order accuracy in time. The finite difference scheme can treat the fluid-solid boundary automatically. It is parallelized on a nCUBE 2 computer. The dispersion analysis shows that as a rule of thumb 5 samples per waveiength are needed to suppress the grid dispersion and anisotropy. The stable condition of the scheme is obtained. The tests show that in the homogeneous acoustic and elastic medium the finite difference solutions match the analytic solutions excellently. In the elastic medium the finite difference method can model the far field P and S waves as well as the near field term accurately. The tests also demonstrate that the second-order Higdon's absorbing boundary condition works very well in an acoustic and elastic medium.
ACKNOWLEDGMENTS
This research was supported by the Borehole Acoustics and Logging Consortium at M.LT. and by the ERL/nCUBE Geophysical Centerfor Parallel Processing.
22 Cheng et al.
APPENDIX A: SOURCE TIME FUNCTION
The source time function used in this thesis is based on a Gaussian curve (Kelly et al., 1976; Stephen et ai., 1985).
f(t)
=
_2~Te-<T2where ~ is a pulse width parameter andT
=
t -t
s .t
s is a time shift parameter.(A.l)
It is straight forward to obtain the first and the second order derivative of f(t),
which is given below:
f"(t)
=
4e(3T - 2~T3)e-<T2 . (A.3)F?
For a pulse at center frequency F
o
we chose pulse width parameter ~ = 0.lgI2't
s isselected such that f(O) '" O. Here we chosets =
~~.
In the finite difference calculation when the source time function is fed into the stress
f'(t) is used to simulate a point explosion and when the source time function is fed into
the velocity f"(t) is used to simulate a point force.
APPENDIX B: A POINT FORCE SOLUTION IN A
HOMOGENEOUS ELASTIC MEDIUM
This appendix presents the solution of a point force in a homogeneous elastic medium (Aki and Richard 1980). In Cartesian coordinates xi(i
=
1,2,3), a point force Xo(t) is applied in the Xj direction at the origin, the displacementUi can be written asUi(X,t)
(B.l)
where direction cosinesIi for vector if= (Xl,X2, X3) isIi = Xi,
,.
r is the distance fromIn the above equation the first term is called the near-field term. Itbehaves like
~
r for sources in which Xo is nonzero from times that are short compared to ~ -~. It dominates in the equation as r -> O. It consists of both P-wave and S-wave motions. For a force time function, nonzero from 0 to T, the near-field term arrives at P wave arrival time ~ and remains active until the time ~+
T.The second term is called the far-field P wave term. Itbehaves like
10.
The particler
motion is the same as the direction of propagation. The third term is called the far-field S wave term. It also behaves like
10.
Its particle motion is normal to the direction ofr
propagation. The far-field terms dominate as r ->00.
REFERENCES
Aki, K., and P.G. Richards, 1980, Quantitative Seismology, W.H. Freeman and Com-pany.
Alford, RM., K.R Kelley, and D.M. Boore,1974, Accuracy of finite difference modelling of the acoustic wave equations, Geophysics, 39, 834-842.
Alterman, Z., and F.C. Karal, 1968, Propagation of elastic waves in layered media by finite difference methods, Bull. Seis. Soc. Am., 58, 367-398.
Boore, D.M., 1972, Finite difference methods for seismic waves, Methods in computa-tional physics, 11, Bolt, B.A., Ed., Academic Press Inc., 1-37.
Broeze,J.,and Daalen, E.V.,1992, Radiation boundary conditions for the two-dimensional wave equation from a variational principle, Math. Camp., 58, 73-82.
Clayton, R, and Engquist, B., 1977, Absorbing boundary conditions for acoustic and elastic wave equations, Bull. Seis. Soc. Am., 67, 1529-1540.
Daalen, E.V.,J.Broeze, and E.V. Groesen, 1992, Variational principles and conservation laws in the derivation for radiation boundary conditions for wave equations, Math.
Camp., 58, 55-71.
Emermen, S.H., and RA. Stephen, 1983, Comment on, "Absorbing boundary conditions for acoustic and elastic wave equations," by R Clayton andB. Engquist, Bull. Seis.
Soc. Am., 73, 661-665.
Frankel, A., and J. Vidale, 1992, A three-dimensional simulation of seismic waves in the Santa Clara Valley, California, from a Loma Prieta aftershock, Bull. Seis. Soc. Am.,
82, 2045-2074.
Fuyuki, M., Y. and Matsumoto, 1980, Finite difference analysis of Rayleigh wave scat-tering at a trench, Bull; Seis. Soc. Am., 67, 2051-1067.
24 Cheng et aI.
Higdon, RL., 1986, Absorbing boundary conditions for difference approximations to the multi-dimensional wave equation, Mathematics of Computation, 47, 437-459.
Higdon, RL., 1987, Numerical absorbing boundary conditions for the wave equation, Mathematics of Computation, 49, 65-90.
Higdon, RL., 1990, Radiation boundary conditions for elastic wave propagation, SIAM
J. Numer. Anal., 27,831-870.
Igel, H, P. Mora, and D. Rodrigues, 1991, 3-D wave propagation using finite differences, 61st S.E.G Annual Meeting Expanded Abstracts, Houston.
Igel, H, Riollet, B. and P. Mora, 1992, Accuracy of staggered 3-D finite difference grids for anisotropic wave propagation, 62nd S.E. G Annual Meeting Expanded Abstracts, New Orleans.
Israeli, M., and S.A. Orszag, 1981, Approximation of radiation boundary conditions, J. Comput. Phys., 41, 115-135.
Kelly, K.R, RW., Ward, S., Treitel, and RM. Alford, 1976, Synthetic seismograms: A finite-difference approach, Geophysics, 41, 2-27.
Kosloff, R, and D. Kosloff, 1986 Absorbing boundaries for wave propagation problems,
J. Comput. Phys., 63, 363-376
Kostek, S., 1991, Modelling of elastic wave propagation in a fluid-filled borehole excited by a piezoelectric transducer, Master Thesis, Massachusetts Institute of Technology, Cambridge, MA.
Levander, A.R, 1988, Fourth-order finite difference P-SV seismograms, Geophysics, 53, 1425-1436.
Liao, Z.P., H.L. Wong, B. Yang, and Y. Yuan, 1984, A transmitting boundary for transient wave analyses, Scientia Sinica (series A), XXVII, 1063-1076
Lindman, E.L., 1975, Free-Space boundary conditions for the time dependent wave equation, J. Comput. Phys., 18,66-78.
Luo, Y., and Schuster, G., 1990, Parsimonious staggered grid finite-difference of the wave equation, Geophys. Res. Lett., 17, 155-158.
Lysmer,J., and RL. Kuhlemeyer, 1969. Finite dynamic model for infinite media. J. Eng. Mech. Div., ASCE 95 EM4, 859-877.
Madariaga, R, 1976, Dynamics of an expandin& circular fault, Bull. Seism. Soc. Am., 65, 163-182.
Randall, C.J., 1988, Absorbing boundary conditions for the elastic wave equation, Geo-physics, 53, 611-624.
Randall, C.J., 1989, Absorbing boundary conditions for the elastic wave equation: velocity-stress formulation, Geophysics, 54, 1141-1152.
Renaut, RA., and J. Petersen, 1989, Stability of wide-angle absorbing boundary con-ditions for the wave equation. Geophysics, 54, 1153-1163.
Reynolds, A.C., 1978, Boundary conditions for the numerical solution of wave propaga-tion problems, Geophysics, 43, 1099-1110.
Rodrigues, D., and P. Mora, 1992, Analysis of a finite difference solution to 3-D elastic wave propagation, 62nd S.E.G. Annual Meeting Expanded Abstracts, New Orleans.
Smith, W.D., 1974, A nonreflecting plane boundary for wave propagation problems. J.
Comput. Phys., 15,492-503.
Stacey, R, 1988, Improved transparent boundary formulations for the elastic-wave equa-tion, Bull. Seis. Soc. Am., 78, 2089-2097.
Stephen, RA., F. Pardo-Casas, and C.H. Cheng, 1985, Finite-difference synthetic acous-tic logs, Geophysics, 50, 1588-1609.
Virieux, J., 1984, SH-wave propagation in heterogeneous media: velocity-stress finite-difference method. Geophysics, 4g, 1933-1957.
Virieux, J., 1986, P-SV wave propagation in heterogeneous media: velocity-stress finite-difference method. Geophysics, 51, 889-901.
Yoon, K.H., and G.A. McMechan, 1992, 3-D finite-difference modelling of elastic waves in borehole environments. Geophysics, 57, 793-804.
26 Cheng et aI.
P wave velocity a S wave velocity
f3
density p(m/s) (m/s) (g/c.c.)
Fluid 1500 - 1.0
Solid 4000 2300 2.3
Table 0.1: The velocity and the density values of the acoustic and elastic medium used in the test.
y I I I 'to xz
z
v
x
Figure 1: Staggered grid used to discretize Equation (2.5) and (2.6). Solid circles represent the velocities. Open circles represent the shear stresses. The solid square represents the normal stresses.
28 Cheng et al.
(A)
0.1 0.2 0.3 0.4 0.5 Dispersion Parameter H ---- ---- ---- ---- ---- =----=----.----:..:::="----:'~----F---==:..:..::..:
1.1 c: 1.0 0 iii ; Co 0.9 11I C ~ 0.8 Q 0 Qj > 0.7"
>..
;: 0.6 ci. 0.5 a (8) 1.1 i: 0 1.0 iii ; Co 11I 0.9 C ~ "0 0.8 0 Qj > 0.7"
>"
~ 0.6~
11. 0.5 a 0.1 0.2 0.3 0.4 0.5 Dispersion Parameter HFigure 2: Normalized P wave velocity dispersion versus sample rate per wavelength. (A) the fourth-order finite difference. (B) the second-order finite difference. Solid line for direction C'YI
=
0,/'2=
90,/'3=
90), dash line for direction C'YI=
45,/'2=
1.1 c 1.0 0 u; ~
..
Co 0.9"
Q...
'"
0.8 <> 0 ;; > 0.7..
>..
;;: 0.6 • (J) 0.5 0(A)
0.1 0.2 0.3 0.4 0.5 Dispersion Parameter H (8) 1.1 c 0 1.0 u;-
... _":.~--:.:--:--~..
-
-Co-..
0.9 -is-....
...
-
0.8 U 0 ;; > 0.7"
"."
;: 0.6 rh 0.5 0 0.1 0.2 0.3 0.4 0.5 Dispersion Parameter HFigure 3: Normalized S wave velocity dispersion versus sample rate per wavelength. (A) the fourth-order finite difference. (B) the second-order finite difference. v = 0.25. Solid line for direction ('n
=
0"Y2=
90"3=
90), dash line for direction (')'1 45,'2=
45,'3=
90) and dash/dot line for direction (')'1=
54.7,,2=
54.7,'3=
54.7).30 Cheng et aI. 1.1 l: 1.0 0 - - - ... =-=--~:=-=-- --
-.
'iii ~ Q) c. 0.9 Ol C>--
0.8'u
0 Q; > 0.7 Q) >'"
:::
• 0.6 (J) 0.5 0 0.1 0.2 0.3 0.4 0.5 Dispersion Parameter HFigure 4: Normalized S wave velocity dispersion versus sample rate per wavelength for the fourth·order finite difference. 1/
=
0.4999. Solid line for direction ('n=
0,'2=
90,'3
=
90), dash line for direction (,1=
45, 12=
45, 13=
90) and dash/dot line for direction (-'11=
54.7,'2=
54.7"3=
54.7).P·Wav. Grid Anisotropy
Figure 5: The fourth-order finite difference grid anisotropy for the P wave. H=O.2. Conversions from Angle 1 and Angle 2 to11.2,3 are given in Equation (2.26).
32
Olsperslon(%)
Cheng et aI.
S-Wave GrId Anisotropy
Figure 6: The fourth-order finite difference grid anisotropy for the S wave. H=0.2. and v = 0.25. Conversions from Angle 1 and Angle 2 to 71,2,3 are given in Equation
1.0
-
l: 0.8 Q) u ~-
I-
l Q) 0.6 -I 0~
() , -; l: , 0 0.41
-
ul
Q)~
;;:: 0.2 Q) ~a:
~
0.0 I 0 10 20 30 40 50 60 70 80 90Incident Angle (degree)
Figure 7: Reflection coefficient of the acoustic case. The perfect absorbing angles are chosen as 0 and 45 degrees. ill = 2.
34 Cheng et al. 20 . : ' 1000 1 : 1
i
i 100Number of Processor
...:---_._---,---.----.---,---,
-,"-,---"]"---,---;--,--(-:-:-;
. . , . . . . . . . +"'-rTT-1
...;...; ; ,..) ;..;..;.; ···1
j!,+il~
~
i :
' ...
, !
! :
i
~
...l-_ ---..l --L.---1. l-.--L..i..
l..
l
_
L
L
~.......,
j •••j •••.
- . -.
:::
.
"
!
i :
j-1 : i ;1 ! ! 10 16o
-
c
g
12 Q)E
.-I-
8 ~ C.o
4Figure 8: CPU time versus number of processors for a 100 time step finite difference calculation on a 100 x 100 x 100 grid.
r
I~
~
II, Io
1TIME (ms)
2Figure 9: Kelly source time function for pressure at the center frequency 2.5 kHz. The scale is arbitrary.
36 Cheng et aI. I I I I
FD
f\
\J
- -Analyticf\
I\J
,
,
,
o
1 2 3 4 5TIME (ms)
Figure 10: Comparison of the finite difference (FD) solution with the analytic solution for homogeneous acoustic medium. The explosion source at center frequency 2.5 kHz is used. The amplitudes are normalized.
Figure 11: Snapshot of the pressure wavefield for the homogeneous acoustic medium at time 1.2 ms. The source center frequency is 2.5 kHz. The image size is 50 x 50 x 70.
38 Cheng et al. 1 0- 1 Ql "C ::l
...
1 0- 3 0..E
«
10- 5 \I 1".",
..'I'
\ ~I - ... v 1 0- 7 '---'---'---'-..L---'---'---"---'---'----'---'---'---'_'---L--'---'---'---'---'o
5 1 0 1 5 2 0Frequency (kHz)
Figure 12: Comparison of the finite difference solution (dash line) with the analytic solution (solid line) for homogeneous acoustic medium in frequency domain. The explosion source at center frequency 2.5 kHz is used.
1 CIl "C 0.1
"
....
CoE
<l: 0.01 0.01 0.1 Distance 1 1 0Figure 13: The point source implementationin the finite difference scheme (dot) against 11. (solid line). Distance is normalized by the wavelength.
40 FD /\ f - - - '
I
I
Analytic Cheng etaI.
,
,
,
-o
1 2 3 4 5TIME
(ms)
Figure 14: Comparison of the finite difference (FD) solution with the analytic solution is a homogeneous elastic medium. The vertical force at the center frequency 2.5 kHz is used. The amplitudes are normalized.
I I FD / \ -Analytic f'. V I i I
,
o
i 2 3 4 5TIME (ms)
Figure 15: Comparison of the finite difference (FD) solution with the analytic solution in a homogeneous elastic medium. The horizontal force at the center frequency 2.5 kHz is used. The amplitudes are normalized.
42 Cheng et al.
Figure 16: Snapshot of the vertical velocity wavefield in a homogeneous elastic medium at time 1.2 ms. The vertical force at center frequency 2.5 kHz is used. The image size is 50 x 50 x 100.