Publisher’s version / Version de l'éditeur:
Vous avez des questions? Nous pouvons vous aider. Pour communiquer directement avec un auteur, consultez la première page de la revue dans laquelle son article a été publié afin de trouver ses coordonnées. Si vous n’arrivez pas à les repérer, communiquez avec nous à [email protected].
Questions? Contact the NRC Publications Archive team at
[email protected]. If you wish to email the authors directly, please see the first page of the publication for their contact information.
https://publications-cnrc.canada.ca/fra/droits
L’accès à ce site Web et l’utilisation de son contenu sont assujettis aux conditions présentées dans le site LISEZ CES CONDITIONS ATTENTIVEMENT AVANT D’UTILISER CE SITE WEB.
ASME International Mechanical Engineering Congress and Exposition
[Proceedings], 2008-11-02
READ THESE TERMS AND CONDITIONS CAREFULLY BEFORE USING THIS WEBSITE. https://nrc-publications.canada.ca/eng/copyright
NRC Publications Archive Record / Notice des Archives des publications du CNRC :
https://nrc-publications.canada.ca/eng/view/object/?id=5e9ba6a0-fb00-43c4-a4dc-268ff09f2368 https://publications-cnrc.canada.ca/fra/voir/objet/?id=5e9ba6a0-fb00-43c4-a4dc-268ff09f2368
NRC Publications Archive
Archives des publications du CNRC
This publication could be one of several versions: author’s original, accepted manuscript or the publisher’s version. / La version de cette publication peut être l’une des suivantes : la version prépublication de l’auteur, la version acceptée du manuscrit ou la version de l’éditeur.
Access and use of this website and the material on it are subject to the Terms and Conditions set forth at
Post-flashover compartment fire for different fire ventilation settings in
a medium-sized residential room
http://irc.nrc-cnrc.gc.ca
P o s t - f l a s h o v e r c o m p a r t m e n t f i r e f o r d i f f e r e n t f i r e
v e n t i l a t i o n s e t t i n g s i n a m e d i u m - s i z e d r e s i d e n t i a l r o o m
N R C C - 5 0 8 6 0
S a b e r , H . H . ; K a s h e f , A . ; B w a l y a , A . C .
2 0 0 8 - 1 1 - 1 3
A version of this document is published in / Une version de ce document se trouve dans: ASME International Mechanical Engineering Congress and Exposition, Boston, Mass., Nov. 2-6, 2008
The material in this document is covered by the provisions of the Copyright Act, by Canadian laws, policies, regulations and international agreements. Such provisions serve to identify the information source and, in specific instances, to prohibit reproduction of materials without written permission. For more information visit http://laws.justice.gc.ca/en/showtdm/cs/C-42
Les renseignements dans ce document sont protégés par la Loi sur le droit d'auteur, par les lois, les politiques et les règlements du Canada et des accords internationaux. Ces dispositions permettent d'identifier la source de l'information et, dans certains cas, d'interdire la copie de documents sans permission écrite. Pour obtenir de plus amples renseignements : http://lois.justice.gc.ca/fr/showtdm/cs/C-42
Proceedings of IMECE2008 2008 ASME International Mechanical Engineering Congress and Exposition November 2-6, 2008, Boston, Massachusetts, USA
IMECE2008-68448
POST-FLASHOVER COMPARTMENT FIRE FOR DIFFERENT FIRE VENTILATION
SETTINGS IN A MEDIUM-SIZED RESIDENTIAL ROOM
Hamed H. Saber, Ahmed Kashef and Alex Bwalya
National Research Council of Canada, Institute for Research in Construction 1200 Montreal Road, Bldg. M59, Ottawa, Ontario K1A 0R6, Canada ABSTRACT
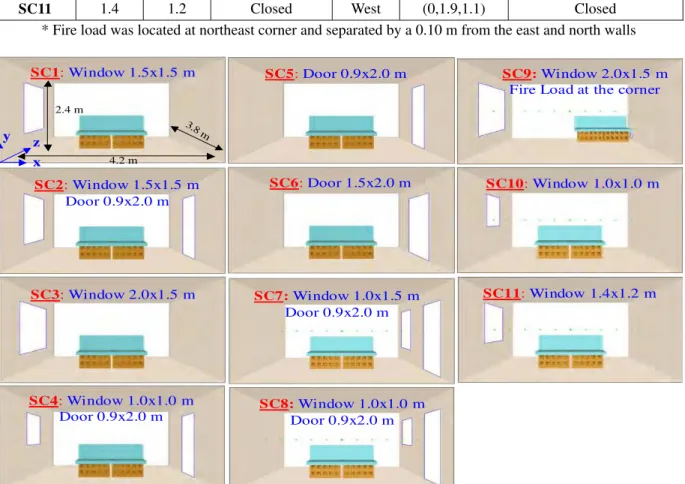
A number of fire ventilation scenarios were investigated in order to identify the proper ventilation scheme for conducting design fire tests in a medium-sized residential room of a size of 4.2 m long, 3.8 m wide and 2.4 m high. The ventilation schemes were based on using a window, door, or both with different sizes. The fuel package that was used in all scenarios consisted of a mock-up sofa made of polyurethane foam and two wood cribs underneath it. The selection of this fuel package is supported by fire statistics that many fatal residential fires begin with an item of upholstered furniture. The CFD technique was used to conduct the numerical simulations for eleven ventilation scenarios using the Fire Dynamics Simulator (FDS) version 5. The effect of window and door sizes, and fire load location on the heat release rate, burning rate, temperature during the period of fully-developed fire (flashover), and the onset of post-flashover and its duration were investigated.
INTRODUCTION
Establishing proper design fire scenarios is a challenging task and an essential component for conducting fire safety design of buildings. The parameters affecting design fires include the type, amount and arrangement of combustible materials, the ventilation conditions, and size of the compartment of fire origin. A design fire scenario is a qualitative description of a fire with time identifying key events that characterize the fire (ignition, growth, fully-developed, and decay stages of fire). In addition, it describes the ventilation conditions that will impact the course of a fire.
This paper presents the analyses for a series of CFD numerical simulations that were conducted in order to investigate the effect of different ventilation settings on fire dynamics in a medium-sized residential room of a size of 4.2 m long, 3.8 m wide and 2.4 m high. The fire was initiated by igniting an item of upholstered furniture. A fuel package consisting of a mock-up sofa constructed with exposed polyurethane foam, the dominant combustible constituent of upholstered furniture, and two wood cribs underneath it was
selected. The masses of the polyurethane sofa and two wood cribs were 8.3 kg and 86.7 kg, respectively. The mock-up sofa was ignited first and the wood cribs provided the remaining fire load to sustain a fully-developed fire. The details of the fuel package and its characteristics are available in (1, 2, 3). This mode of fire initiation is supported by fire statistics that many fatal residential fires begin with an item of upholstered furniture.
In total, eleven CFD simulations for different fire ventilation scenarios were conducted in order to identify the proper ventilation scheme for conducting design fire tests in the investigated room. These scenarios covered a wide range of ventilation factor, Ψ, of ~0.01 – 0.08 m1/2. The ventilation factor is defined as:
T o o H A A / = Ψ (1)
where Ao = area of the openings, AT = total area of the
compartment – enclosing surfaces, and Ho = weighted average
of the opening height (see Eq. 8). In this ventilation range, the cases of both ventilation-controlled burning and fuel-controlled burning were covered. This paper extends the previous effort (1, 4, 5) with a focus on:
(a) Investigating the effect of window size, door size, and fire load location on the fire characteristics (in terms of heat release rate, burning rate, temperature, onset of fully-developed fire (post-flashover), and period of fully-developed fire) for different ventilation settings, and
(b) Comparing the average temperature over the period of post-flashover for a wide range of ventilation factors,
Ψ .
In all the CFD simulations, the fire load was located at the room center except the simulation for scenario SC9 (Figure 1, and Table 1). In scenario SC9, the fire load was located in the northwest corner of the room, and separated by a 0.10 m from the east and north walls. The details of the dimensions and thermal properties of the polyurethane sofa and wood cribs are available in reference (1).
STAGE OF FULLY-DEVELOPED FIRE
The fully-developed fire (post-flashover) scenarios are typically used in the design and analysis of structural fire resistance and in estimating the potential for building-to-building fire spread. The stage of post-flashover was defined as the period when the mass of fuel was between 80% and 30% of the original, unburned fuel mass (6). There are several tools (models and correlations) available to predict the temperature of fully-developed enclosure fires (7, 8, 9). These tools predict a compartment fire temperature based on input data relating to heat release curves, the amount of fuel in the compartment and compartment characteristics (e.g. compartment geometry, ventilation setting, and thermal properties of construction materials). While much attention has been focused on numerical modelling in recent years, closed-form models are still representative of the state of the art in post-flashover enclosure fire modelling.
Recently, Hurley (6) evaluated the closed-form models of fully-developed enclosure fires by comparing predictions of different correlations with temperature data from experiments. The selected experimental data represented a wide spectrum of ventilation conditions, including fuel- and ventilation-controlled scenarios. Most of the available correlations were found to under-predict compartment fire temperatures under some conditions (6). In this paper, the average temperature in the compartment and burning rate or the fuel mass loss during the stage of post-flashover were investigated for all ventilation scenarios shown in Figure 1. Additionally, the temperatures averaged over the period of post-flashover based on CFD simulations for all scenarios (SC1 through SC11) are presented as a function of ventilation factor, Ψ . These temperatures were compared with that obtained using Babrauskas’ correlation (9).
Babrauskas’ correlation for post-flashover
The average temperature in the post-flashover is given as (9): 5 4 3 2 1 * ) ( − ×θ ×θ ×θ ×θ ×θ + =T∞ T T∞ Tg , (2)
where: Tg = average gas temperature (K), T∞ = ambient
temperature (K) and T* = empirical constant = 1725 K. The factors θ through 1 θ in the above equation account for 5 different physical phenomena, which are: burning rate stoichiometry (θ ), wall steady-state heat losses (1 θ ), wall 2 transient heat losses (θ ), opening height effect (3 θ ), and 4
combustion efficiency (θ ). These factors can be calculated 5 from: ⎩ ⎨ ⎧ > − < + = 1 for ) (ln 05 . 0 0 . 1 1 for ln 51 . 0 0 . 1 3 / 5 1 φ φ φ φ θ , o o H A HRR 1500 = φ , (3) ⎥ ⎥ ⎥ ⎦ ⎤ ⎢ ⎢ ⎢ ⎣ ⎡ ⎟ ⎠ ⎞ ⎜ ⎝ ⎛ ⎟ ⎟ ⎠ ⎞ ⎜ ⎜ ⎝ ⎛ − − = 1/3 3 / 2 2 1.0 0.94exp 54 k A H A T o o δ θ , (4) ⎥ ⎥ ⎥ ⎦ ⎤ ⎢ ⎢ ⎢ ⎣ ⎡ ⎟ ⎟ ⎠ ⎞ ⎜ ⎜ ⎝ ⎛ ⎟ ⎟ ⎠ ⎞ ⎜ ⎜ ⎝ ⎛ − − = 4 . 0 6 . 0 3 1.0 0.92exp 150 p T o o C k t A H A ρ θ , (5) 3 . 0 4 =1.0−0.205Ho− θ , and (6) p b ln 0 . 1 5= + θ , (7)
where, HRR = heat release rate (kW), Ao = area of the
opening(s) (m2), AT = total area of the compartment –
enclosing surfaces (m2), bp = the combustion efficiency with
values in the range 0.5 – 0.9, Cp = wall specific heat (J/kg
K), Ho = height of the opening (m), k = wall thermal
conductivity (W/m.K), t = time (s), δ = wall thickness (m), ρ = wall density (kg/m3
), and φ = Equivalence ratio (φ = 1 at stoichiometry, φ > 1 for fuel-rich burning, and φ < 1 for fuel-lean conditions). Note that in the case of having more than one opening as in scenarios SC2, SC4, SC7 and SC8, the height of the opening (Ho) was calculated as the weighted
average of the height as follows:
∑
∑
= = = n i i o n i i o i o o A H A H 1 , 1 , ,, where n = number of openings. (8)
ASSUMPTIONS AND BOUNDARY CONDITIONS The Fire Dynamic Simulator (FDS) is a CFD model developed to idealize fire-driven fluid flow. FDS version 5 (10, 11) was used to simulate the eleven ventilation scenarios listed in Table 1 in a room of a size of 4.2 x 3.8 x 2.4 m (Figure 1). The walls, floor and ceiling of the room were assumed inert and perfectly insulated (adiabatic) in all scenarios. This represented the case of most severe fire conditions. In all scenarios, the windows and doors were open to the outside, meaning that the inflow to the compartment is fresh air at ambient conditions. Ventilation vents were introduced to mimic the actual doors and windows in accordance with Figure 1. The boundary conditions at the windows and doors were treated as open vents. All CFD simulations were conducted for a period of 900 s. The CFD simulation in each scenario was terminated after the combustion of the fire load was completely stopped. Before conducting the CFD simulations for all scenarios, a grid sensitivity analysis was investigated in order to obtain the optimum mesh size (see reference (1) for more details). RESULTS AND DISCUSSIONS
In this section, the results of the different ventilation scenarios are presented and discussed. The fire characteristics (flow fields within the compartment, flow through the opening(s), location of the neutral plane in the opening(s),
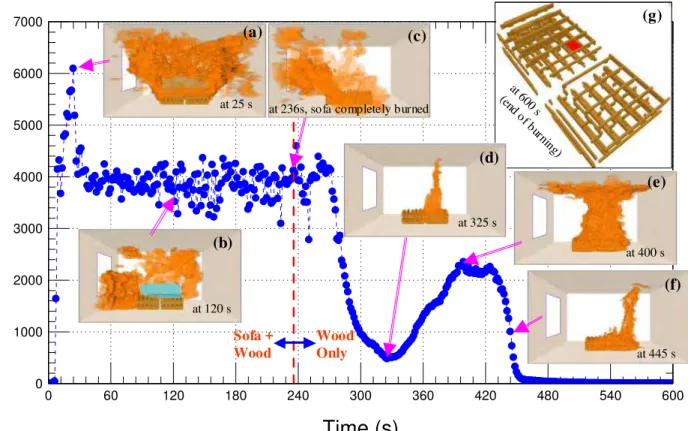
temporal change of the heat release rate, shapes and sizes of the flames, etc) are available in reference (1). In the next subsections, a sample result of the heat release rate, and the effect of window and door sizes, and fire load location on the temperature during the period of post-flashover are discussed. Sample Result of the Heat Release Rate
An example for the calculations of the heat release rate (HRR) is shown in Figure 2 for scenario SC1. Snapshots for flame shapes at different times are shown in the inserts (a) through (f) of Figure 2. As shown in this figure, the HRR increased rapidly with time and reached its maximum value (6,092 kW) at 24 s. At this time the size of the flame was large and filled a significant portion of the room (insert a). After 24 s, the HRR decreased rapidly with time until 37 s. In the period from 37 s to 236 s (at which the sofa was completely burned), the HRR was more or less constant and its mean value was 3,850 kW. In this period, the size of the flame was smaller (insert b, c) than that at 25 s (insert a), and the HRR was due to burning both the polyurethane sofa and wood cribs. In the period from 236 s to 269 s, the HRR was approximately constant (its mean value equal to 3,965 kW). After 269 s, the HRR decreased with time, reaching its minimum value (479 kW) at 325 s. At this time (325 s), the size of the flame reached its minimum size and the majority of the HRR was due to burning the wood crib that was located further from the window (see insert d). After that the HRR and the flame size increased again with time, reaching another peak (2,347 kW, insert e) at 400 s. In the period from 400 s – 425 s, the HRR decreased with time. For example, the HRR decreased from 2,347 kW to 2,211 kW as the time increased from 400 s to 425 s. After 425 s, the HRR decreased rapidly again with time. Eventually, the HRR decreased to ~1 kW at 600 s (see the amount of wood remaining in the insert (g) of Figure 2). In the later stages of burning, the predicted flame size above the wood crib located further from the window was larger than that above the wood crib located closer to the window (e.g. see the inserts d, e, f). With such a result, the amount of mass loss from the wood crib located further from the window was greater than that from the wood crib located closer to the window (see insert g). A similar trend for the HRR and predicted flame shapes were obtained for other scenarios (1, 4, 5).
The CFD results for the 11 ventilation scenarios (1, 4, 5) showed that in the case of using a window and door in the same wall, the size of the window did not affect the fire characteristics as shown in scenarios SC7 and SC8. However, the size of the window had a significant effect on the fire characteristics (in terms of maximum HRR, period of burning, remaining mass of the fire load, effective heat of combustion, flow fields, location of the neutral plane in the opening(s), etc) in the cases with a window and door facing each other (SC2 and SC4), and using only a window (SC1, SC3, SC10 & SC11). Furthermore, for the same ventilation opening (SC3
and SC9), the fire load location had a significant effect on the fire characteristics (1, 4, 5).
Comparison of Post-Flashover Temperature with Babrauskas’ Correlation
Figure 3 compares the numerically predicted temperature averaged over the post-flashover period with that obtained using Babrauskas’ correlation (9). As mentioned earlier, the walls and ceiling of the compartment were insulated in the CFD simulations, which represented the most severe fire conditions. On the other hand, some of the empirical constants in the Babrauskas’ correlation (9) were obtained based on the experimental data (i.e. heat losses through the walls and ceiling were accounted for). As such, the numerical predictions of temperatures were higher (<+25%) than that obtained using Babrauskas’ correlation (9).
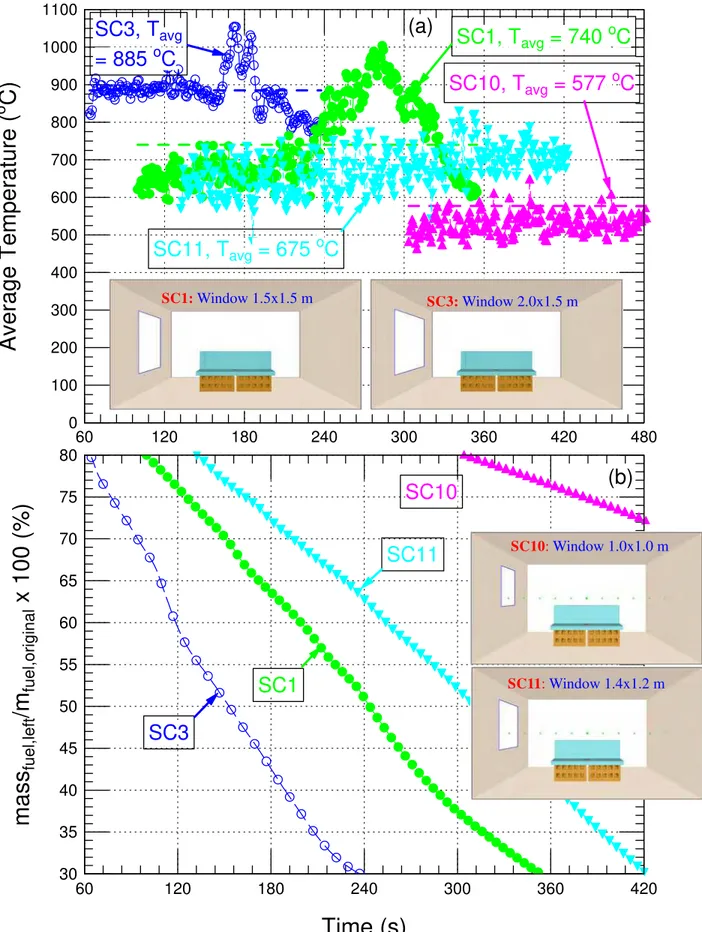
Temperature and Mass Loss During Post-Flashover Stage In this subsection, the average compartment temperature and mass loss are compared for each set of ventilation settings during the fully-developed fire stage. Predicting both the temperature and the onset of post-flashover and its duration are important in terms of fire spread and structure integrity of buildings. Figure 4 compares the temporal change of the average temperature within the compartment and mass loss of ventilation scenarios using only a window with different sizes as in scenarios SC1, SC3, SC11 and SC10. As shown in this figure, the average temperature increased with increase the window size. The calculated temperature averaged over the period of post-flashover in scenarios SC3, SC1, SC11 and SC10 were 885, 740, 675 and 577oC, respectively. Figure 4 shows that the onset of post-flashover took place earlier for ventilation scenarios with a larger window size. For example, in scenarios SC3, SC1, SC11 and SC10, the onset of post-flashover occurred at 65, 100, 132 and 304 s, respectively. Furthermore, the period with a fully-developed fire decreased by increasing the window size. These periods were 174 s (from 65 – 239 s), 254 s (from 100 – 354 s), 291 s (from 132 – 423 s), and ~600 s (from 304 – ~900 s) in scenarios SC3, SC1, SC11 and SC10, respectively.
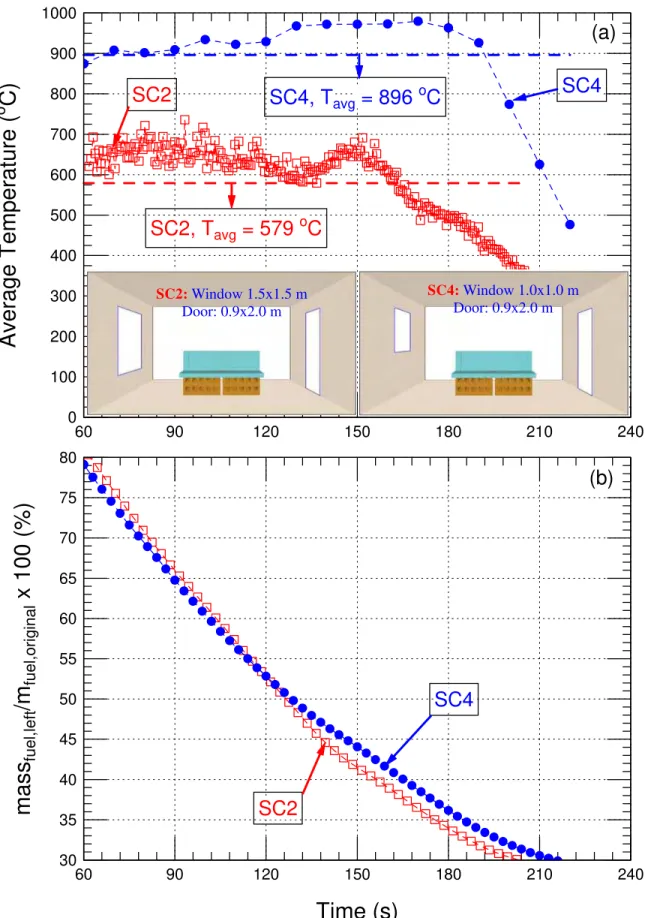
Figure 5 compares the average temperature and mass loss for scenarios SC2 and SC4 (square window of different sizes with a door in the wall opposite to the window, Figure 1). The window size in scenario SC2 (2.25 m2) was 125% larger than that in scenario SC4 (1.0 m2); as a result, the amount of heat losses by convection and radiation in scenario SC2 was larger than that in scenario SC4. Consequently, the average temperature in scenario SC2 was smaller than scenario SC4. The temperature averaged over the period of post-flashover in scenario SC2 (579oC) was 317oC smaller than in scenario SC4 (896oC). The onset of post-flashover took place at about the same time in both scenarios (~60 s). Additionally, the duration of fully-developed fire in scenario SC2 was slightly shorter than in scenario SC4.
Figure 6 compares the average temperature and mass loss in the case of having both the window and door located in the
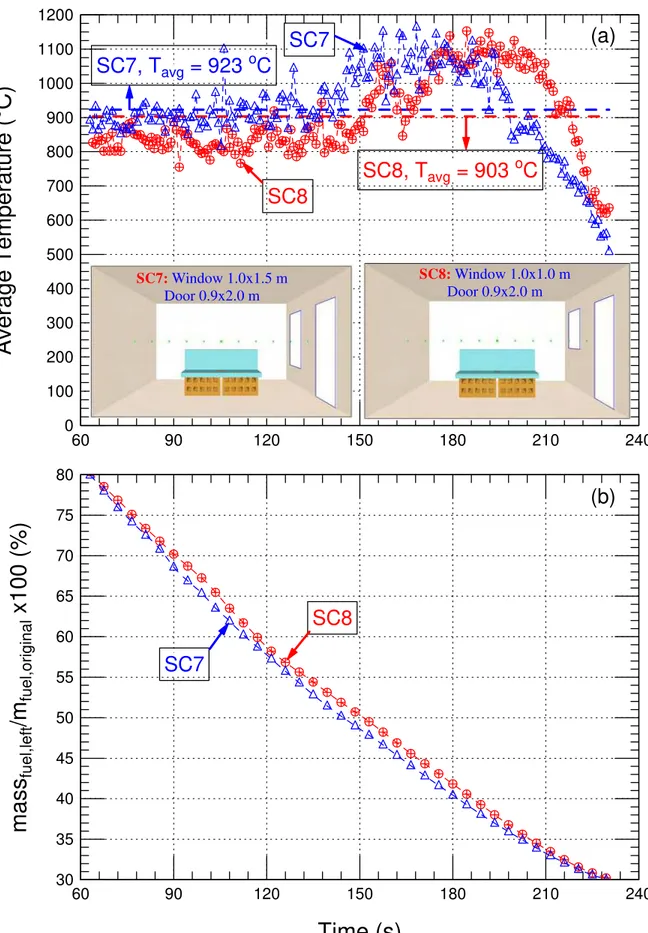
same wall as in scenarios SC7 and SC8. As shown in this figure, the window size did not affect the average temperature and the onset of post-flashover and the duration of the fully-developed fire. The temperature averaged over the period of post-flashover in scenario SC7 (923oC) was only 20oC higher than in scenario SC8 (903oC). In both scenarios, the onset of post-flashover occurred at 63 s and its duration was 168 s.
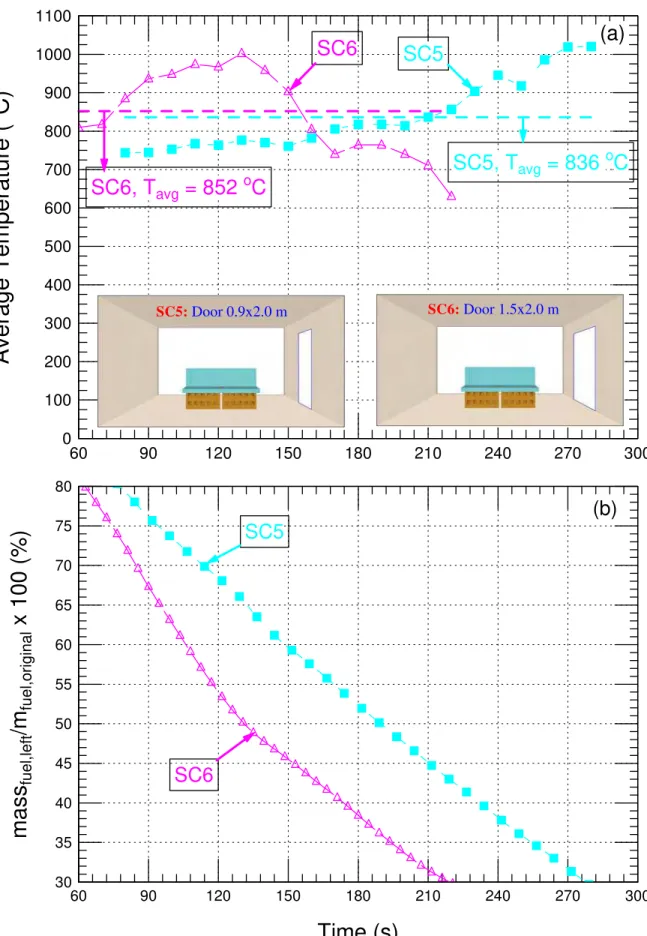
Figure 7 compares the average temperature and mass loss in the case of having only a door with different sizes as in scenarios SC5 and SC6. As shown in this figure, for a given time, the average temperatures within the compartment in these scenarios were different. However, the temperature averaged over the duration of the fully-developed fire in scenario SC6 with a larger door size (852oC) was slightly higher than in scenario SC5 with a smaller door size (836oC). On the other hand, the onset of post-flashover occurred earlier with a shorter period in the scenario with a larger door size. The onset of post-flashover and the duration of the fully-developed fire in scenario SC6 were 63 s and 156 s (from 63 – 219 s), respectively, compared to 77 s and 201 s (from 77 – 278 s) in scenario SC5.
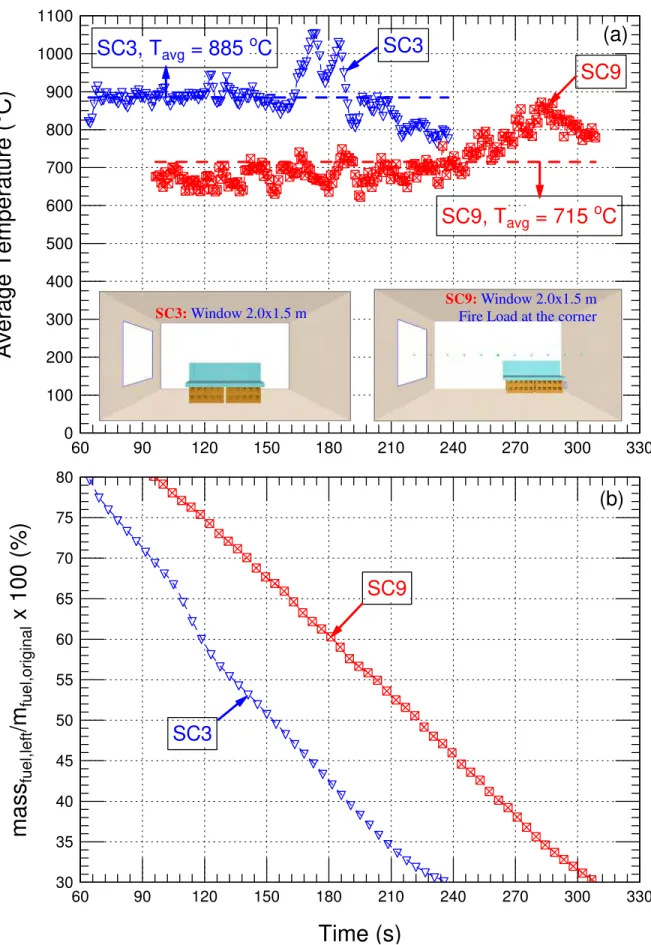
Figure 8 shows the comparisons of the average temperature and mass loss for the case of having two similar ventilation openings but with different fire load locations as in scenarios SC3 and SC9. The temperature averaged over the duration of the fully-developed fire in scenario SC3 with fire load located at the room center (885oC) was 170oC higher than that in scenario SC9 with fire load located at the northeast corner of the room (715oC). The onset of post-flashover in scenario SC3 occurred at 65 s, 30 s earlier than in scenario SC9. Furthermore, the duration of the post-flashover in scenario SC3 (174 s) was 40 s shorter than in scenario SC9 (214 s).
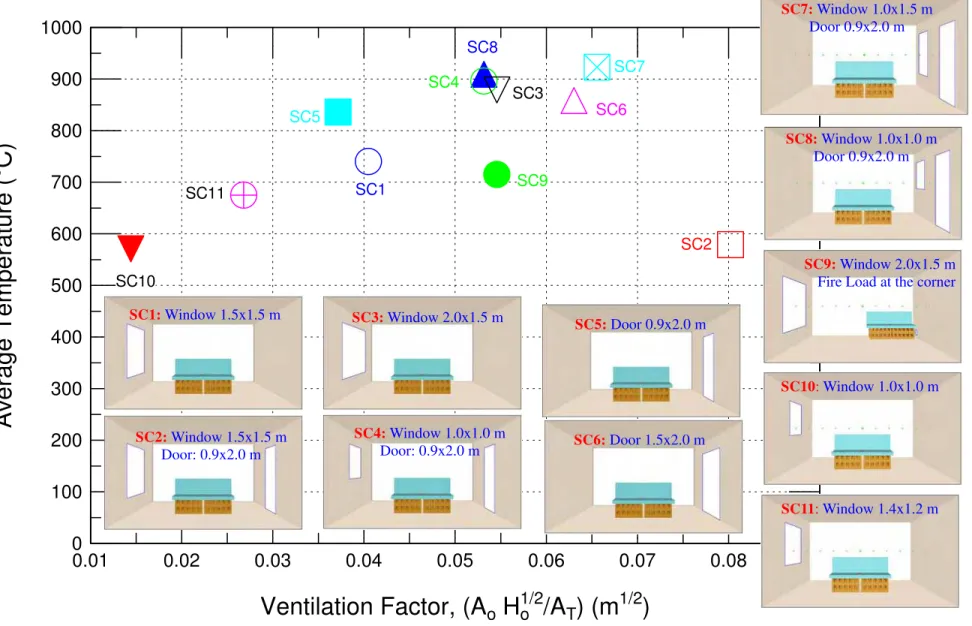
The CFD simulations indicated that in the scenarios with only a window (scenarios SC1, SC3, SC10 and SC11), and door and window facing each other (scenarios SC2 and SC4), the window size had a significant effect on the temperature and both the onset of post-flashover and the duration of the fully-developed fire. However, in the case of having a window and door located in the same wall (scenarios SC7 and SC8), the size of the window did not affect the temperature and both the onset of post-flashover and the duration of the fully-developed fire. In the case of having only a door (scenarios SC5 and SC6), the opening size did not affect the temperature averaged over the period of post-flashover. Moreover, the fire load location (scenarios SC3 and SC9) had a significant effect on the temperature and the onset of post-flashover and its duration. The effect of ventilation factor, Ψ on the temperature averaged over the period of post-flashover of all scenarios was investigated next to identify the ranges of ventilation factors for scenarios with ventilation- and fuel-controlled burnings in the investigated room.
Post-Flashover Temperatures of Different Ventilation Settings
Figure 9 shows the temperatures averaged over the period with a fully-developed fire for all ventilation scenarios. As shown in this figure, a range of ventilation factors, Ψ, between ~0.01 – 0.08 m1/2 were covered. In all ventilation scenarios with the fire load located at the room center, increasing the size of the ventilation openings increased the average temperature within a range of ventilation factor from ~0.01 – ~0.05 m1/2. A further increase in the ventilation factor from ~0.05 – ~0.07 m1/2 did not affect the average temperature. In this range the average temperature was almost constant with a mean value of ~890oC (Figure 9). Accordingly, the range of ventilation factor from ~0.01 – ~0.07 m1/2 represented the case of ventilation-controlled burning in the room. For a ventilation factor greater than ~ 0.07 m1/2, the average temperature decreased with an increase in the ventilation factor (e.g. see SC2 in Figure 9). As a result, a range of ventilation factor >~ 0.07 m1/2 represented the case of fuel-controlled burning in the room.
SUMMARY AND CONCLUSION
Eleven ventilation scenarios were simulated using FDS version 5 in order to identify the proper ventilation scheme for conducting design fire tests in a medium-sized residential room of a size of 4.2 m long, 3.8 m wide and 2.4 m high. These scenarios covered a wide range of ventilation factor,
Ψ
, of ~0.01 – 0.08 m1/2. A fire load that consisted of a polyurethane sofa and two wood cribs underneath it was used in all scenarios. In all scenarios but SC9, the fire load was located at the room center. In scenario SC9, however, the fire load was located at the northeast corner of the room. The ventilation schemes in all scenarios were based on using exterior square/ rectangular opening(s) to represent a window, door, or both with different sizes. In all CFD simulations, it was assumed that the walls and ceiling of the compartment were perfectly insulated.The following observations were made from the CFD results of all ventilation scenarios:
• A range of ventilation factor of ~0.01 – ~0.07 m1/2
was found to represent the case of ventilation-controlled burning in a room of a size of 4.2 m long, 3.8 m wide and 2.4 m high.
• A ventilation factor grater than ~ 0.07 m1/2
was found to represent the case of fuel-controlled burning. • The window size had a significant effect on the fire
characteristics in cases of having a window and door facing each other, and only a window.
• In the case of having a window and door in the same wall, the window size did not affect the fire characteristics.
• In the case of having only a door, the door size had a significant effect on the fire characteristics.
• The location of the fire load had a significant effect on the fire characteristics.
• Because the heat losses through the room boundaries were neglected, the CFD predictions for the temperatures were higher (<+25%) than that obtained using Babrauskas’ correlation (9).
ACKNOWLEDGEMENTS
The authors acknowledge Dr. Gary Lougheed and Dr. Joseph Su for their valuable feedback, comments and suggestions about this paper.
REFERENCES
1. Saber, H. H., Kashef, A., Bwalya, A., Lougheed, G. D., and Sultan, M. A., A Numerical Study on the Effect of Ventilation on Fire Development in a Medium-Sized Residential Room, Research Report # IRC-RR-241, National Research Council of Canada, Ottawa, Canada, February 2008.
2. Bwalya, A., Carpenter, D., Kanabus-Kaminska, M., Lougheed, G., Su, J., Taber, B., Bénichou, N., Kashef, A., McCartney, C., Bounagui, A., and Thomas, R. “Development of A Fuel Package for Use in the Fire Performance of Houses Project” Research Report: IRC-RR-207, March 2006.
3. Taber, B., Bwalya, A., McCartney, C., Bénichou, N., Bounagui, A., Carpenter, D., Crampton, G., Kanabus-Kaminska, M., Kashef, A., Leroux, P., Lougheed, G., Su, J., and Thomas, R. “Fire Scenario Tests in Fire Performance of Houses Test Facility – Data Compilation” Research Report: NRC-IRC-RR-208, March 2006.
4. Saber, H. H., and Kashef, A. “CFD Simulations for Different Fire Ventilation Scenarios in a Room”, 5th NRC Symposium on Computational Fluid Dynamics and Multi-scale Modelling, Ottawa, Canada, January 2008. 5. Saber, H. H., and Kashef, A. “CFD Simulations for
Fully-Developed Fires in a Room under Different Ventilation Conditions”, 16th Annual Conference of the CFD Society of Canada, Saskatoon, Saskatchewan, Canada, June 8 -10, 2008.
6. Hurley, M. J., “Evaluation of Models of Fully Developed Post-flashover Compartment Fires”, Journal of Fire Protection Engineering vol. 15; pp. 173-197, 2005.
7. Walton, W. D., and Thomas, P. H., “Estimating Temperatures in Compartment Fires”, section three, Chapter 6, The SFPE Handbook of Fire Protection Engineering, 3rd Edition, 2002.
8. Babrauskas, V. and Williamson, R. B., “Post-flashover Compartment Fires-Application of a Theoretical Model”, Fire and Materials, vol. 3, no. 1, pp. 1-7, 1979.
9. Babrauskas, V., “A Closed-form Approximation for Post-flashover Compartment Fire Temperatures”, Fire Safety Journal, vol. 4, pp. 63-73, 1981.
10. McGrattan, K., Baum, H., Rehm, R., Hostikka, S., and Floyd, J., “Fire Dynamics Simulator (Version 5) Technical Reference Guide”, NIST Special Publication 1018-5, October 2007.
11. McGrattan, K., Klein, B., Hostikka, S., and Floyd, J., “Fire Dynamics Simulator (Version 5) User’s Guide” NIST Special Publication 1019-5, October 2007.
Table 1 Ventilation conditions for all scenarios (1)
Window Size (m) Door Size (m) Window Location Door Location Scenario
Width Height Width Height Side Center (x,y,z) (m) Side Center (x,y,z) (m)
SC1 1.5 1.5 Closed West (0,1.9,1.25) Closed
SC2 1.5 1.5 0.9 2.0 West (0,1.9,1.25) East (4.2,1.9,1.0)
SC3 2.0 1.5 Closed West (0,1.9,1.25) Closed
SC4 1.0 1.0 0.9 2.0 West (0,1.9,1.5) East (4.2,1.9,1.0)
SC5 Closed 0.9 2.0 Closed East (4.2,1.9,1.0)
SC6 Closed 1.5 2.0 Closed East (4.2,1.9,1.0)
SC7 1.0 1.5 0.9 2.0 East (4.2,2.85,1.25) East (4.2,0.95,1.0)
SC8 1.0 1.0 0.9 2.0 East (4.2,2.85,1.5) East (4.2,0.95,1.0)
SC9* 2.0 1.5 Closed West (0,1.9,1.25) Closed
SC10 1.0 1.0 Closed West (0,1.9,1.0) Closed
SC11 1.4 1.2 Closed West (0,1.9,1.1) Closed
* Fire load was located at northeast corner and separated by a 0.10 m from the east and north walls
SC3:Window 2.0x1.5 m
SC6:Door 1.5x2.0 m
SC9:Window 2.0x1.5 m Fire Load at the corner
SC2:Window 1.5x1.5 m Door 0.9x2.0 m SC5:Door 0.9x2.0 m SC8:Window 1.0x1.0 m Door 0.9x2.0 m SC1:Window 1.5x1.5 m SC4:Window 1.0x1.0 m Door 0.9x2.0 m SC7:Window 1.0x1.5 m Door 0.9x2.0 m 4.2 m 3.8 m 2.4 m SC10:Window 1.0x1.0 m SC11:Window 1.4x1.2 m x y z SC3:Window 2.0x1.5 m SC3:Window 2.0x1.5 m SC6:Door 1.5x2.0 m SC6:Door 1.5x2.0 m SC9:Window 2.0x1.5 m Fire Load at the corner
SC9:Window 2.0x1.5 m Fire Load at the corner
SC2:Window 1.5x1.5 m Door 0.9x2.0 m SC2:Window 1.5x1.5 m Door 0.9x2.0 m SC5:Door 0.9x2.0 m SC5:Door 0.9x2.0 m SC8:Window 1.0x1.0 m Door 0.9x2.0 m SC8:Window 1.0x1.0 m Door 0.9x2.0 m SC1:Window 1.5x1.5 m SC1:Window 1.5x1.5 m SC4:Window 1.0x1.0 m Door 0.9x2.0 m SC4:Window 1.0x1.0 m Door 0.9x2.0 m SC7:Window 1.0x1.5 m Door 0.9x2.0 m SC7:Window 1.0x1.5 m Door 0.9x2.0 m 4.2 m 3.8 m 2.4 m SC10:Window 1.0x1.0 m SC10:Window 1.0x1.0 m SC11:Window 1.4x1.2 m SC11:Window 1.4x1.2 m x y z
0 1000 2000 3000 4000 5000 6000 7000 0 60 120 180 240 300 360 420 480 540 600 Sofa + Wood Wood ONLY
Time (s)
Heat Release R
a
te (
k
W)
at 6 00 s (en d o f b urn ing) (a) (b) (c) (d) (f) (e) (g) at 25 s at 120 sat 236s, sofa completely burned
at 325 s at 400 s at 445 s Sofa + Wood Wood Only 0 1000 2000 3000 4000 5000 6000 7000 0 60 120 180 240 300 360 420 480 540 600 Sofa + Wood Wood ONLY
Time (s)
Heat Release R
a
te (
k
W)
at 6 00 s (en d o f b urn ing) (a) (b) (c) (d) (f) (e) (g) at 25 s at 120 sat 236s, sofa completely burned
at 325 s at 400 s at 445 s Sofa + Wood Wood Only
Figure 2 Heat Release Rate of ventilation scenario SC1 (1.5x1.5 m window)
200 300 400 500 600 700 800 900 1000 200 300 400 500 600 700 800 900 1000 +25% SC10 SC11 SC8 SC7 SC6 SC5 SC4 SC3 SC2 SC1 SC9 +20% -20%
Average temperature based on Babrauskas' correlation (oC)
A v erage tem p e ratu re b a s ed on CF D c a lc ula ti ons ( o C)
Figure 3 Comparison of the average temperature over the period of post-flashover with that obtained using Babrauskas’ correlation (9) for all scenarios
30 35 40 45 50 55 60 65 70 75 80 60 120 180 240 300 360 420
(b)
SC3
SC1
SC11
SC10
Time (s)
ma
ss
fuel,left/m
fue l,or igi nalx 100 (%
)
0 100 200 300 400 500 600 700 800 900 1000 1100 60 120 180 240 300 360 420 480(a)
SC3, T
avg= 885
oC
SC1, T
avg= 740
oC
SC11, T
avg= 675
oC
SC10, T
avg= 577
oC
Average T
e
mperature (
oC)
Figure 4 Comparison of the average temperatures and mass losses during the period of post-flashover for scenarios using a window with different sizes
SC1: Window 1.5x1.5 m SC3: Window 2.0x1.5 m
SC11: Window 1.4x1.2 m SC10: Window 1.0x1.0 m
30 35 40 45 50 55 60 65 70 75 80 60 90 120 150 180 210 240
(b)
SC4
SC2
Time (s)
mass
fue l,left/m
fu el ,o ri gi n alx 100 (%
)
0 100 200 300 400 500 600 700 800 900 1000 60 90 120 150 180 210 240(a)
SC4, T
avg= 896
oC
SC2, T
avg= 579
oC
SC2
SC4
Average Temperat
ure (
oC)
Figure 5 Comparison of the average temperatures and mass losses during the period of post-flashover for scenarios using window and door facing each other
SC2: Window 1.5x1.5 m Door: 0.9x2.0 m
SC4: Window 1.0x1.0 m Door: 0.9x2.0 m
30 35 40 45 50 55 60 65 70 75 80 60 90 120 150 180 210 240
(b)
SC8
SC7
Time (s)
mass
fu el ,l eft/m
fu el ,ori gi nalx
1
00
(%
)
0 100 200 300 400 500 600 700 800 900 1000 1100 1200 60 90 120 150 180 210 240(a)
SC8
SC7
SC8, T
avg= 903
oC
SC7, T
avg= 923
oC
Average Temperature (
oC)
Figure 6 Comparison of the average temperatures and mass losses during the period of post-flashover for scenarios using window and door located in the same wall
SC8: Window 1.0x1.0 m Door 0.9x2.0 m SC7: Window 1.0x1.5 m
30 35 40 45 50 55 60 65 70 75 80 60 90 120 150 180 210 240 270 300
(b)
SC5
SC6
Time (s)
ma
ss
fu el, lef t/m
fu el, o ri ginalx 100 (%)
0 100 200 300 400 500 600 700 800 900 1000 1100 60 90 120 150 180 210 240 270 300SC6, T
avg= 852
oC
SC5, T
avg= 836
oC
(a)
SC6
SC5
Average Temperature (
oC)
Figure 7 Comparison of the average temperatures and mass losses during the period of post-flashover for scenarios using door with different sizes
30 35 40 45 50 55 60 65 70 75 80 60 90 120 150 180 210 240 270 300 330
SC9
SC3
(b)
Time (s)
mass
fuel ,left/m
fuel ,or ig inalx 100 (
%
)
0 100 200 300 400 500 600 700 800 900 1000 1100 60 90 120 150 180 210 240 270 300 330SC9, T
avg= 715
oC
SC3, T
avg= 885
oC
SC3
SC9
(a)
Average Temperature (
oC)
Figure 8 Comparison of the average temperatures and mass losses during the period of post-flashover for scenarios with different fire load locations
SC3: Window 2.0x1.5 m
SC9: Window 2.0x1.5 m Fire Load at the corner
0
100
200
300
400
500
600
700
800
900
1000
0.01
0.02
0.03
0.04
0.05
0.06
0.07
0.08
0.09
SC11 SC10 SC9 SC8 SC7 SC6 SC5 SC4 SC3 SC2 SC1Ventilation Factor, (A
oH
o1/2/A
T) (m
1/2)
Av
erage Temperature (
oC)
Figure 9 Average temperature of all ventilation scenarios over the period of post-flashover
SC9: Window 2.0x1.5 m Fire Load at the corner SC8: Window 1.0x1.0 m Door 0.9x2.0 m SC7: Window 1.0x1.5 m Door 0.9x2.0 m SC11: Window 1.4x1.2 m SC10: Window 1.0x1.0 m SC3: Window 2.0x1.5 m SC4: Window 1.0x1.0 m Door: 0.9x2.0 m SC5: Door 0.9x2.0 m SC6: Door 1.5x2.0 m SC1: Window 1.5x1.5 m SC2: Window 1.5x1.5 m Door: 0.9x2.0 m