Publisher’s version / Version de l'éditeur:
Vous avez des questions? Nous pouvons vous aider. Pour communiquer directement avec un auteur, consultez la première page de la revue dans laquelle son article a été publié afin de trouver ses coordonnées. Si vous n’arrivez pas à les repérer, communiquez avec nous à [email protected].
Questions? Contact the NRC Publications Archive team at
[email protected]. If you wish to email the authors directly, please see the first page of the publication for their contact information.
https://publications-cnrc.canada.ca/fra/droits
L’accès à ce site Web et l’utilisation de son contenu sont assujettis aux conditions présentées dans le site LISEZ CES CONDITIONS ATTENTIVEMENT AVANT D’UTILISER CE SITE WEB.
Balkan Light 2008 [Proceedings], pp. 242-252, 2008-10-07
READ THESE TERMS AND CONDITIONS CAREFULLY BEFORE USING THIS WEBSITE. https://nrc-publications.canada.ca/eng/copyright
NRC Publications Archive Record / Notice des Archives des publications du CNRC :
https://nrc-publications.canada.ca/eng/view/object/?id=624bb7cf-3e0e-4478-b193-2665fb491ae9 https://publications-cnrc.canada.ca/fra/voir/objet/?id=624bb7cf-3e0e-4478-b193-2665fb491ae9
NRC Publications Archive
Archives des publications du CNRC
This publication could be one of several versions: author’s original, accepted manuscript or the publisher’s version. / La version de cette publication peut être l’une des suivantes : la version prépublication de l’auteur, la version acceptée du manuscrit ou la version de l’éditeur.
Access and use of this website and the material on it are subject to the Terms and Conditions set forth at
View size and office luminance effects on employee satisfaction
http://irc.nrc-cnrc.gc.ca
V i e w s i z e a n d o f f i c e l u m i n a n c e e f f e c t s o n
e m p l o y e e s a t i s f a c t i o n
N R C C - 5 0 8 5 2
C e t e g e n , D . ; V e i t c h , J . A . ; N e w s h a m , G . R .
2 0 0 8 - 1 0 - 2 7
A version of this document is published in / Une version de ce document se trouve dans:
Balkan Light 2008, Ljubljana, Slovenia, Oct. 7-10, 2008, .pp 242-252
l
The material in this document is covered by the provisions of the Copyright Act, by Canadian laws, policies, regulations and international agreements. Such provisions serve to identify the information source and, in specific instances, to prohibit reproduction of materials without written permission. For more information visit http://laws.justice.gc.ca/en/showtdm/cs/C-42
Les renseignements dans ce document sont protégés par la Loi sur le droit d'auteur, par les lois, les politiques et les règlements du Canada et des accords internationaux. Ces dispositions permettent d'identifier la source de l'information et, dans certains cas, d'interdire la copie de documents sans permission écrite. Pour obtenir de plus amples renseignements : http://lois.justice.gc.ca/fr/showtdm/cs/C-42
Please cite as: Cetegen, D., Veitch, J. A., & Newsham, G. R. (2008). View size and office luminance effects on employee satisfaction. Proceedings of Balkan Light 2008, Ljubljana, Slovenia, October 7-10, 2008 (pp. 243-252).
Maribor, Slovenia: Lighting Engineering Society of Slovenia.
© 2008, Her Majesty in Right of Canada. National Research Council of Canada, Ottawa, ON K1A 0R6
VIEW SIZE AND OFFICE LUMINANCE EFFECTS ON EMPLOYEE SATISFACTION Duygu Cetegen1, Jennifer A. Veitch2 & Guy R. Newsham2
Summary
In this parametric study, the influence of office design variables on occupant satisfaction was examined, using high dynamic range (HDR) images as stimuli. The setting was an open plan office with cubicles defined by modular systems furniture. Photographs were taken of the view afforded to the occupant sitting in the second row in from the window. Accessible window area varied depending on combinations of panel height, panel material (opaque or semitransparent) and window blind condition. Twelve HDR images taken from the viewpoint of this occupant were displayed on a special HDR computer monitor at realistic luminance levels (average luminance range: 24-348 cd/m2; for the image with the lowest average luminance, range was 3-82 cd/m2; for the image with the highest average luminance, range was 5-2608 cd/m2). Thirty-six participants viewed each image for 30 seconds with the instruction to imagine it as their own workplace, and then rated their satisfaction with the image on eight scales. Satisfaction with amount of view, visual comfort, pleasantness and spaciousness increased with both image luminance and view size, although most of the curves were non-linear.
1. INTRODUCTION
Windows in workspaces provide daylight in the space, increase the general level of luminance, and provide a view to the outside. Occupants may derive from these effects knowledge of the weather and time of day, relief from feelings of monotony or boredom, a change of visual focus, restoration of depleted attention processes, increased job satisfaction, decreased intention to quit and improved general well-being (Farley & Veitch, 2001; Leather et al, 1998). Having access to a window is now considered as a health and well-being issue (Leather et al., 1998). In some European countries (e.g., Denmark, Germany, the Netherlands, and Norway) all workplaces must provide window access to all occupants; however, such regulations do not exist in North America, where this study was conducted.
Previous studies show that any view is preferred to having no view, and a landscape view is preferred over an urban view (Farley & Veitch, 2001, Tuaycharoen & Tregenza, 2005). Markus (1967) examined the preferred view by the occupants in a study of 400 workers working in large open plan offices on different levels of a 12 storey building. The further the employees were positioned from the windows, the less satisfied they were with the view. Heerwagen and Orians (1986) found that people without windows were more likely to decorate their offices with landscape posters than with other scenes.
Ne’eman and Hopkinson (1970), found that adequate window size depended on participants’ distance from the window, window height and angle of view; and type of view also affected the desired window size. Participants wished to have the full picture, so if they were close to outside objects they chose wider windows than the windows they chose for more distant outdoor scenes. Among types of window glass, those glass types that provided the a clear view of distant objects were rated as being more pleasant and adequate.
Speed of recovery from heart attacks and the length of hospitalization for depression have both been shown to be beneficially affected by the amount of sunlight in the hospital room (Beauchemin & Hays, 1996, 1998). These studies controlled for obvious confounding effects of illness severity, age, and the like. Similarly, but without overt physical illness, Leather et al. (1998) found that symptoms of strain were lower among employees with larger patches of sunlight in their offices.
Several studies have shown that workers satisfied with their indoor environments are more satisfied with their jobs (Carlopio, 1996; Wells, 2000). Windows are important contributors to overall environmental satisfaction (Veitch et al., 2005), as is satisfaction with lighting. Employees are more satisfied with lighting when a window is
1
Istanbul Technical University, Dept. of Electrical Engineering, Istanbul, Turkey.
2
Cetegen, Veitch & Newsham — Balkan Light 2008
present in the workstation; but being one row away from the window can be better for overall environmental satisfaction because it provides daylight access without risk of thermal discomfort (Veitch et al., 2005).
Although some countries mandate window access for all employees, others do not. Even where window access is required, there is room for additional knowledge concerning the relationship between view area and satisfaction, and the influence of overall luminance. In this parametric study, the influence of office design variables on occupant satisfaction was examined. Participants looked at and provided judgements of high-dynamic-range (HDR) images of the view towards the window from the second row of cubicles in an open-plan office under varying conditions of panel height and material, and of window blind orientation. One goal of the study was to derive design guidance for offices furnished with modular systems furniture ("cubicles") such as are typical in North America.
This study tested the hypotheses that:
• As the view size for occupants in the second row of cubicles increases, ratings for pleasantness, satisfaction with view and satisfaction with visual comfort increase.
• As the average luminance of the view from the second row of cubicles increases, pleasantness, satisfaction with view and satisfaction with visual comfort increase.
2. METHODS AND PROCEDURE 2.1 Participants
Forty-three participants (25 women and 18 men, ages 18-65 years) employed at a Canadian government research agency volunteered to participate in this experiment. Data from 36 participants are reported here (data from seven individuals were excluded from analysis as a result of a screening process not described here). Fourteen of them were male and 22 were female; they ranged in age from 18 to 65. Employees who had participated in previous lighting experiments were excluded from the recruitment pool. Recruitment was arranged via internal e-mail. Participants were required to meet the following criteria: between 18 – 65 years of age and have self-reported normal to corrected-to-normal vision. Depending on the participant’s availability, one to four participants participated per day. Each participant partook in the experiment alone. One experimenter assisted the participants in the room where images were displayed on the HDR display.
2.2 Materials 2.2.1 Stimuli
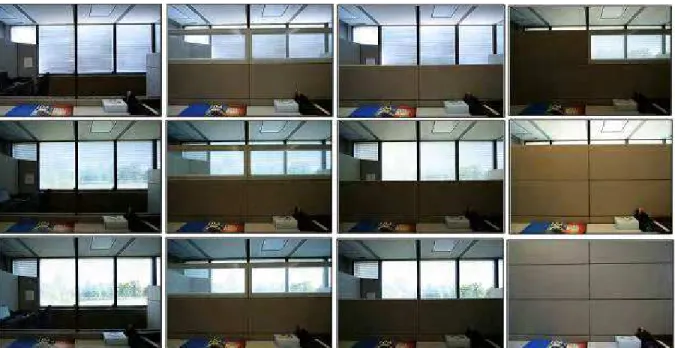
Participants saw HDR images of various combinations of office settings displayed on an HDR display (Whitehead et al., 2005) (Figure 1). This full experiment had a 3 X 3 X 2 (Panel X Blind X Neighbour) factorial design, plus three additional panel configurations with no neighbour making a total of 21 images. For this paper we will consider only the 12 images with no neighbour visible. There were three panel heights:
• no visible panel (desk+),
• one fabric-covered panel (seated privacy) above the desk and
• two panels above the desk (seated privacy+). The second panel was made of glass covered by a film of dots. This choice of panels lets daylight pass yet provides more privacy than plain glass.
The workstation was near an external window which was covered with blinds in one of three orientations: closed, tilted (partially closed) or horizontal (open).
In addition to these nine images from the full factorial experiment design, three scenes were added: • standing privacy (two levels of fabric panels);
• hybrid (two panels with one glass and one fabric stacked on the second level); and, • three levels of fabric panels.
Cetegen, Veitch & Newsham — Balkan Light 2008
These images are given in Figure 1. Table 1 shows the relative view size (%), average luminance (cd/m2) and log(Lmax/Lmin) of the scenes.
2.2.2 HDR Images of an Open-Plan Office
The participants did not see the real spaces but HDR images of these spaces displayed on an HDR display, which can display images at realistic luminances. This method was validated in a previous study and it also has the advantage of ensuring control over daylight for all scenes (Newsham et al, in press). Conducting this study using real spaces would have included the confounding effects of fluctuating daylight.
Images of an open plan office were taken from the viewpoint of an employee sitting in the second row of cubicles from the window. All images in this experiment were captured with a Canon EOS Digital Rebel XT camera mounted on a tripod at seated head height and fitted with a wide-angle lens (Canon EFS10-22mm). The angle of view was 74o vertical and 97o horizontal; image resolution was 1728 x 1152 pixels. The camera was connected to a computer and images were captured using remote shooting software. All bracketed images were taken from the same location. The camera was used in the manual mode and exposure of images was changed only by varying the shutter speed (exposure time). Images were taken using shutter speeds of 2 to 1/500s (2s-1s-1/2s-1/4s…1/500s) by halving the shutter speed as the exposure became shorter. The aperture size was set to f/4, ISO was set to 100.
Figure 1. Images rated by the participants; in the first column, panel height:desk+, blinds: closed, tilted and horizontal respectively; in the second column, panel height: seated privacy+, blinds: closed, tilted and horizontal respectively; in the third column, panel height: seated privacy, blinds: closed, tilted and horizontal respectively; in the fourth column, panel height: hybrid, standing privacy and three layers respectively, blinds: tilted.
A set of images were combined into HDR images using the software Photosphere (Ward, 2005). One calibration point was selected in each scene. For that point, luminance of the real space (measured using a Gigahertz Optic LDM-9810 luminance meter) was divided by luminance obtained from the software Photosphere and this ratio was set as calibration factor. The calibration factor was then related to all pixel luminance values in the image. After that the images were displayed on the HDR display, and the display brightness and gamma were fine-tuned to generate the best overall match across all measurement points. The aim was to match onscreen luminance with the luminance in the real scene. Figure 2 shows the measuring points for scene desk+hor (panel height: desk+ and blinds: horizontal). Figure 3 shows the steps taken in this study.
For the 12 images considered in this paper, we created three ways to characterize the lighting and view conditions. We calculated the relative view size as the % of total pixels that represented a see-through glazed area relative to the most open scene (panel height: desk+, blind: horizontal, considered as 100%); obviously, scenes with closed blinds had the smallest view size. We used a Prometric digital luminance camera system to measure the
Cetegen, Veitch & Newsham — Balkan Light 2008
luminances of each image on the HDR display, providing average luminance Lave (cd/m2), and log(Lmax/Lmin)
luminance values for each of the 12 images considered here. We chose these variables based on prior research (Loe et al., 1994; Newsham & Veitch, 2001). These values were somewhat intercorrelated: images with a high proportion of view tended to have higher average luminance (r2= 0.89) and a higher log (Lmax/Lmin) (r2 = 0.86).
Table 1. Relative view size (%), average luminance (cd/m2) and log(Lmax/Lmin) of the scenes, images in
the order as in Figure 1
Panel Desk+ Seated Privacy+ Seated Privacy Hybrid
Blinds Closed Closed Closed Tilted
View size 0 0 0 22
Lave (cd/m2) 56 49 56 108
log(Lmax/Lmin) 2.11 2.39 2.45 2.32
Panel Desk+ Seated Privacy+ Seated Privacy Standing Privacy
Blinds Tilted Tilted Tilted Tilted
View size (%) 54 30 43 3
Lave (cd/m2) 163 70 197 51
log(Lmax/Lmin) 2.59 2.28 2.43 2.19
Panel Desk+ Seated Privacy+ Seated Privacy Three Layers
Blinds Horizontal Horizontal Horizontal Tilted
View size (%) 100 54 81 0
Lave (cd/m2) 258 108 237 24.4
log(Lmax/Lmin) 2.73 2.4 2.54 1.46
Figure 2. Measuring points for the scene desk+hor (desk+ panel height and horizontal blinds).
2.2.3 Dependent Measures
During the experiment, participants rated each HDR image on seven scales. The scales rated were: too much light-too little light; unpleasant-pleasant; spacious-cramped; tense-calm; exciting-boring; satisfaction with amount of privacy; satisfaction with the amount of view; and, satisfaction with the amount of visual comfort. Prior to starting their ratings, participants were given the dictionary definitions of the adjectives that were used in the questionnaire. The definitions were put on a separate writing board on the desk next to the display and were accessible during the entire experiment.
2.3 Procedure
On the day of the experiment each participant was informed about the experiment and then asked to sign a consent form. Brief instructions were given on how to proceed through the experiment. Participants were then led to the two-cubicle windowless open-plan office where the image evaluation took place. They sat facing an HDR
Cetegen, Veitch & Newsham — Balkan Light 2008
monitor in one cubicle while the experimenter ran the experiment from the other side of the panel (behind the HDR display). The lighting in the laboratory provided luminance on the furniture panel behind the display of around 100 cd/m2. Each participant observed all 21 HDR images displayed in one of six predetermined random orders. We ensured that two images with the same partition height and blind position (with or without model present) did not come one after the other. For adaptation purposes, before the first image and in between each image a blank white image was displayed for 30 seconds. A luminance of 109 cd/m2 was chosen for this scene to be similar to the average luminance of all images. When an image appeared on the screen, the participants had 30 seconds to become accustomed to the scene. Then the experimenter invited the participants to complete the rating scales for that scene using a pen to mark answers in a paper booklet. When the participants finished the ratings, they informed the experimenter so that the experimenter could move on to the next blank screen and then to the following image. The participants were asked to keep their attention on the screen when it was blank. The whole procedure took about an hour.
3. RESULTS
3.1. Analysis Strategy
For this paper we examined specific trends that prior investigations led us to expect would be of interest. We plotted selected combinations of image characteristics and mean ratings and examined the trends they revealed. More detailed statistical analyses of the data for all 21 images will be presented elsewhere. Here, we present plots of Lave in relation to mean ratings for the amount of light, pleasantness, satisfaction with the amount of view and
satisfaction with visual comfort; log(Lmax/Lmin) in relation to ratings for unpleasant-pleasant, cramped-spacious,
tense-calm, boring-exciting and satisfaction with the visual comfort; and the relative view size in relation to the amount of light, pleasantness, satisfaction with the amount of view and satisfaction with visual comfort. Support for
the hypotheses would be shown by an increase in mean ratings, as the amount of view, average luminance, and
log(Lmax/Lmin) of the scenes increase.
3.2 Effects of Average Luminance
All scales in this study have 7 points, with higher values indicating more positive ratings. Figure 4 shows the results for plots against the average image luminance, Lave. As expected, mean ratings for the amount of light
increase as the average luminance for the scenes increases. However, the best-fitting curves are not linear. All
Prior to taking images On the day of taking images On the day of experiments After taking images Extensive Luminance measurements
prior to taking photographs and deciding from which points to collect data
Displaying images on the HDR display and adjusting gamma and brightness values
Taking images of the HDR images displayed on the HDR display using a luminance camera to get mean
luminance of each image Doing Luminance Measurements
Taking sequence of images
Calculating mean luminance fo
determining the luminance of the blank scr r all images and
een
Doing Luminance Measurements
Preparing random orders to display images
Making calibrated High Dynamic Images using Photosphere
Displaying images in a random or participants
der to be rated by
Figure 3. Flowchart of steps taken in the study.
Cetegen, Veitch & Newsham — Balkan Light 2008
graphs in Figure 4 show that the increase in ratings is faster for scenes with luminances of 24 to 90cd/m2. There is a more slow increase between luminances 175-348 cd/m2. The effect is clearest and strongest for ratings of pleasantness and satisfaction with the amount of view, and smallest for the satisfaction with visual comfort.
Figure 4. Mean ratings for the seven-scale questionnaire for semantic differentials too little light-too much light, unpleasant-pleasant, satisfaction with the amount of view and satisfaction with visual comfort, 1 stands for very unsatisfied and 7 stands for very satisfied.
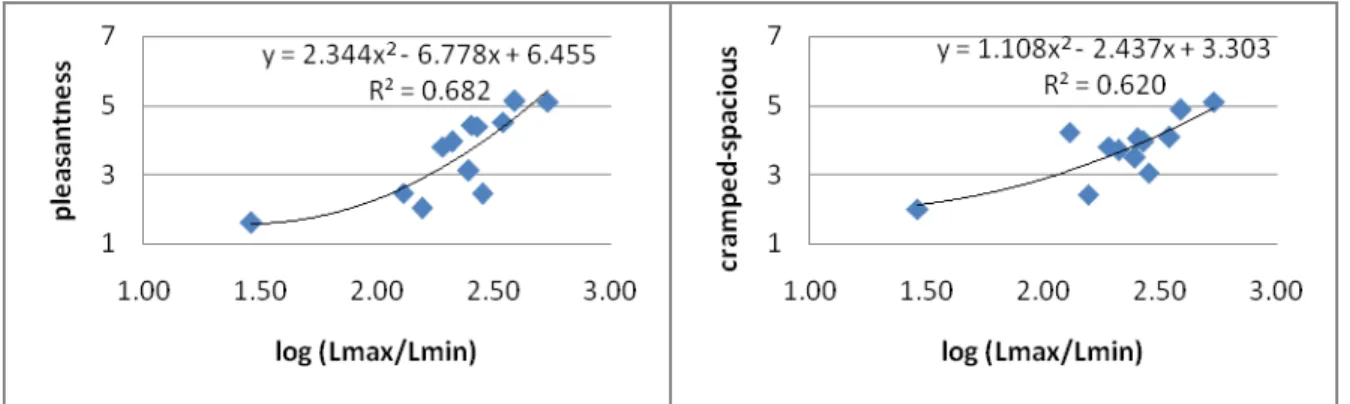
3.3 Effects of Luminance Variability
The plots for log(Lmax/Lmin) showed the expected positive slopes (Figure 5 and 6). Of the five dependent
measures, only one (tense-calm) showed a linear best fit; for the others there was a relatively flat slope for values less than 2, and then steeper increases in mean ratings up to the maximum value of 2.73. Effect size (explained variance) is somewhat lower for this predictor than it was for Lave.
Figure 5. Mean ratings for the seven-scale questionnaire for semantic differentials unpleasant-pleasant and cramped-spacious, in terms of log(Lmax/Lmin);Lmax is the maximum luminance of the image and Lmin is the
minimum luminance of the corresponding scene.
Cetegen, Veitch & Newsham — Balkan Light 2008
Figure 6. Mean ratings for the Likert item satisfaction with visual comfort and semantic differential tense-calm and boring-exciting, in terms of log(Lmax/Lmin), 1 stands for very
unsatisfied and 7 stands for very satisfied.
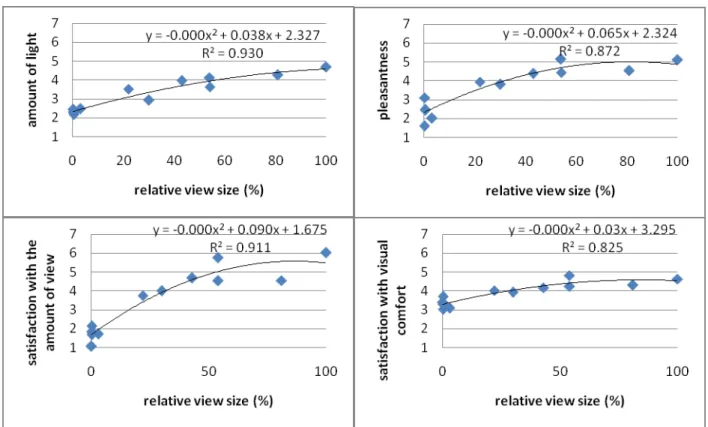
3.4 Effects of View Size
Figure 7 shows the curves with respect to relative view size. The trends are positive, as expected, but not linear. There is a flattening around 50-60% of the relative view. The largest effect sizes are for the ratings of pleasantness and satisfaction with view.
Figure 7. Mean ratings for the amount of light, pleasantness, satisfaction with the amount of view and satisfaction with visual comfort, 1 stands for very unsatisfied and 7 stands for very satisfied.
Cetegen, Veitch & Newsham — Balkan Light 2008
4. CONCLUSIONS
Previous research has established that viewing HDR images on an HDR monitor can result in judgements of space appearance and satisfaction that are similar to judgements of the real space, particularly when there is daylight (Newsham et al., in press). In the present study, variations on average image luminance, luminance variability, and relative view influenced all of the ratings of space appearance for which hypotheses were made, and all of the effects were in the positive direction. The results show that as the view size increases, ratings for pleasantness, satisfaction with view and satisfaction with visual comfort increase. As the average luminance of the scenes increases, pleasantness, satisfaction with view and satisfaction with visual comfort increase.
Almost all of these curves are non-linear, indicating that there are limits to the increases. In particular, there is less increase for all ratings with average luminances above ~ 175 cd/m2. Whether there may be a higher value at which these judgements would begin to decline is not known. Visual comfort curves are all flatter than the others because luminances of all the scenes are within the visual comfort limits.No scenes have dark or very bright patches.
Newsham et al. (2004, in press) found that participants were sensitive to manipulations of luminances in the image, which is one of the findings of this experiment. Newsham et al. (2004) also found that participants preferred attractive spaces that were bright but not glaring, and having a degree of uniformity, not being too uniform. Bright ceilings were a common preference. In our experiment, tilted and horizontal blinds not only increased the amount of view, but also provided a brighter ceiling and a bright but not glaring scene with some degree of non uniformity and these scenes had higher ratings than scenes with closed blinds.
Our results may provide some guidance to designers seeking to improve indoor environment quality for office occupants. It is clear that providing some access to an outside view is positive, but that this access does not necessarily imply the absence of panels or shading devices.
REFERENCES
Beauchemin, K. M., & Hays, P. (1996). Sunny hospital rooms expedite recovery from severe and refractory depressions. Journal of Affective Disorders, 40(1-2), 49-51.
Beauchemin, K. M., & Hays, P. (1998). Dying in the dark: sunshine, gender and outcomes in myocardial infarction.
Journal of the Royal Society of Medicine, 91(7), 352-354.
Carlopio, J. R. (1996). Construct validity of a physical work environment satisfaction questionnaire. Journal of
Occupational Health Psychology, 1, 330-344.
Farley, K. M. J., & Veitch, J. A. (2001). A room with a view: A review of the effects of windows on work and
well-being (IRC-RR-136). NRC Institute for Research in Construction, Ottawa, Canada.Downloaded July 8, 2008, from
http://irc.nrc-cnrc.gc.ca/fulltext/rr/rr136/.
Heerwagen, J. H., & Orians, G. H. (1986). Adaptations to windowlessness: A study of the use of visual décor in windowed and windowless offices. Environment and Behavior, 18(5), 623-639.
Leather, P., Pyrgas, M., Beale, D., & Lawrence, C. (1998). Windows in the workplace: Sunlight, view, and occupational stress. Environment and Behavior, 30(6), 739-762.
Loe, D. L., Mansfield, K. P., & Rowlands, E. (1994). Appearance of lit environment and its relevance in lighting design: Experimental study. Lighting Research and Technology, 26, 119-133.
Markus T. A. (1967). The function of windows: A reappraisal. Building Science, 2, 97-121.
Ne’eman, E., & Hopkinson, R. G. (1970). Critical minimum acceptable window size: a study of window design and provision of view. Lighting Research and Technology, 2(1), 17-27.
Newsham G. R, Cetegen D, Veitch J. A, & Whitehead L. (in press). Comparing lighting quality evaluations of real scenes with those from High Dynamic Range and conventional Images. ACM Transactions on Applied Perception, in press.
Newsham, G. R., & Veitch, J. A. (2001). Lighting quality recommendations for VDT offices: A new method of derivation. Lighting Research and Technology, 33, 97-116.
Cetegen, Veitch & Newsham — Balkan Light 2008
Page 9
Newsham, G. R., Marchand R. G., Veitch, J. A. (2004). Preferred surface luminances in offices, by evolution.,
Journal of the Illuminating Engineering Society33(1), 14-29. Downloaded July 10, 2008, from http://irc.nrc-cnrc.gc.ca/fulltext/nrcc46976.
Tuaycharoen N, & Tregenza P. R, (2005). Discomfort glare from interesting images. Lighting Research &
Technology, 37, 329-41.
Veitch, J. A., Geerts, J., Charles, K. E., Newsham, G. R., & Marquardt, C. J. G. (2005). Satisfaction with lighting in open-plan offices: COPE field findings. Proceedings of Lux Europa 2005 (pp. 414-417). Berlin, Germany: Deutsche Lichttechnische Gesellschaft e. V. (LiTG). Downloaded July 8, 2008, from http://irc.nrc-cnrc.gc.ca/fulltext/nrcc48164.
Ward, G. (2005). Photosphere (Version 1.4.2). [Computer program]. Albany, CA: Anyhere Software. http://www.anyhere.com (Accessed 2008-Jul-18).
Wells, M. M. (2000). Office clutter or meaningful personal displays: The role of office personalization in employee and organizational well-being. Journal of Environmental Psychology, 20, 239-255.
Whitehead, L., Ward, G., Stuerzlinger, W., & Seetzen, H. (2005). High dynamic range display devices. U.S. Patent
No. 6,891,672. Washington, D.C.: U.S. Patent and Trademark Office.
ACKNOWLEDGEMENTS
This study forms part of the first author’s PhD dissertation at Istanbul Technical University. The investigation was supported by the National Research Council Canada Institute for Research in Construction, Haworth, Inc. (NRC Project No. 44-B3242) and the University of British Columbia (UBC) Structured Surface Physics Laboratory (NRC Project No. 44-B3238). We are grateful to Jeff Reuschel and Jay Brand (Haworth), Lorne Whitehead (UBC), and Morad Atif (NRC-IRC) for their support, and to Michelle Mossman (UBC), Helge Seetzen and David Tan (Brightside Technologies), Greg Ward (Anyhere Software), and Sandra Mancini (NRC-IRC) for their assistance. Authors’ addresses
Duygu Cetegen
ITU Electrical and Electronics Faculty, Electrical Engineering Department, Maslak, Istanbul, Turkey [email protected]
Jennifer A. Veitch and Guy R. Newsham
NRC Institute for Research in Construction (NRC-IRC), 1200 Montreal Road, M-24, Ottawa, Canada K1A 0R6 t +1-613-993-9671 / t +1-613-993-9607 / f +1-613-954-3733