Publisher’s version / Version de l'éditeur:
Water Management, 160, June 2, pp. 83-88, 2007-06-01
READ THESE TERMS AND CONDITIONS CAREFULLY BEFORE USING THIS WEBSITE.
https://nrc-publications.canada.ca/eng/copyright
Vous avez des questions? Nous pouvons vous aider. Pour communiquer directement avec un auteur, consultez la
première page de la revue dans laquelle son article a été publié afin de trouver ses coordonnées. Si vous n’arrivez pas à les repérer, communiquez avec nous à PublicationsArchive-ArchivesPublications@nrc-cnrc.gc.ca.
Questions? Contact the NRC Publications Archive team at
PublicationsArchive-ArchivesPublications@nrc-cnrc.gc.ca. If you wish to email the authors directly, please see the first page of the publication for their contact information.
NRC Publications Archive
Archives des publications du CNRC
This publication could be one of several versions: author’s original, accepted manuscript or the publisher’s version. / La version de cette publication peut être l’une des suivantes : la version prépublication de l’auteur, la version acceptée du manuscrit ou la version de l’éditeur.
For the publisher’s version, please access the DOI link below./ Pour consulter la version de l’éditeur, utilisez le lien DOI ci-dessous.
https://doi.org/10.1680/wama.2007.160.2.83
Access and use of this website and the material on it are subject to the Terms and Conditions set forth at
Estimating time to failure of cast-iron water mains
Rajani, B. B.; Tesfamariam, S.
https://publications-cnrc.canada.ca/fra/droits
L’accès à ce site Web et l’utilisation de son contenu sont assujettis aux conditions présentées dans le site LISEZ CES CONDITIONS ATTENTIVEMENT AVANT D’UTILISER CE SITE WEB.
NRC Publications Record / Notice d'Archives des publications de CNRC:
https://nrc-publications.canada.ca/eng/view/object/?id=aedfeba6-7855-41ba-a3bd-2da8fad17e39 https://publications-cnrc.canada.ca/fra/voir/objet/?id=aedfeba6-7855-41ba-a3bd-2da8fad17e39
http://irc.nrc-cnrc.gc.ca
E s t i m a t i n g t i m e t o f a i l u r e o f c a s t - i r o n w a t e r
m a i n s
N R C C - 4 9 6 7 6
R a j a n i , B . ; T e s f a m a r i a m , S .
A version of this document is published in / Une version de ce document se trouve dans: Water Management, v. 160, no. 2, June 2007, pp. 83-88 doi:
10.1680/wama.2007.160.2.83
The material in this document is covered by the provisions of the Copyright Act, by Canadian laws, policies, regulations and international agreements. Such provisions serve to identify the information source and, in specific instances, to prohibit reproduction of materials without written permission. For more information visit http://laws.justice.gc.ca/en/showtdm/cs/C-42
Les renseignements dans ce document sont protégés par la Loi sur le droit d'auteur, par les lois, les politiques et les règlements du Canada et des accords internationaux. Ces dispositions permettent d'identifier la source de l'information et, dans certains cas, d'interdire la copie de documents sans permission écrite. Pour obtenir de plus amples renseignements : http://lois.justice.gc.ca/fr/showtdm/cs/C-42
Submitted: January 14, 2006 Accepted: October 5, 2006
ESTIMATING TIME TO FAILURE OF AGEING CAST IRON
WATER MAINS UNDER UNCERTAINTIES
Balvant Rajani
Institute for Research in Construction, National Research Council Canada, Ottawa, Ontario Canada K1A 0R6
Tel: (613)-993-3810; Fax: (613)-954-5984 e-mail: Balvant.Rajani@nrc-cnrc.gc.ca
and
Solomon Tesfamariam
Institute for Research in Construction, National Research Council Canada, Ottawa, Ontario Canada K1A 0R6
Tel: (613)-993-2448; Fax: (613)-954-5984 e-mail: Solomon.Tesfamariam@nrc-cnrc.gc.ca
Number of words: 4900 Number of tables: 2 Number of figures: 5
Keywords: Water mains, corrosion models, pipe-soil interaction model, factor of safety, time to failure, sensitivity analysis.
ABSTRACT
Water distribution networks form essential components of water supply systems in most urban centres. Water mains buried in the soil/backfill are exposed to different deleterious reactions and as a result, their design factors of safety may significantly degrade with time, leading to structural failure.
In most cases, a combination of circumstances leads to the failure of a pipe. Factors contributing to pipe failure include operational conditions, design parameters, external loads (traffic, frost, etc.), internal loads (operating and surge pressures), temperature changes, loss of bedding support, pipe properties and condition, and corrosion pit geometry. These are recorded rarely, if at all and it is therefore very difficult to ascertain the precise causes of failure. Even if all this information were available, any attempt to estimate the pipe condition state would involve considerable uncertainty due to large spatial and temporal variability that is inherent in this information. Estimation of time to failure is further exacerbated by the uncertainties in determining future corrosion rates.
In this paper, corrosion models and a previously developed analytical model based on Winkler-type pipe-soil interaction are used to estimate time to failure. Since available data are insufficient to establish credible probability distributions, uncertainties in the input data/parameters are handled using possibility theory and fuzzy arithmetic. Sensitivity analyses are carried out to identify the critical data/parameters that merit further investigation.
1 INTRODUCTION
The deterioration of aging water mains (pipes) is of increasing concern to all stakeholders, namely, water utilities (owners) as well as their customers. Their ability to deliver safe potable water without major interruptions is paramount. It is estimated that the financial costs to water utilities (public or private owners) for their repair and replacement exceeds $1 billion annually in Canada alone. The implementation of a proactive asset management strategy is essential to maintain water distribution networks that are both reliable and safe, given the limited availability of financial resources. In the past few years, different non-destructive techniques (NDT) have become available ([1], [2]) to measure remaining wall thickness, corrosion pits (ductile iron) or graphitization depths (cast iron) in pipes. Results obtained from these NDT measurements have to be incorporated within a broad decision support tool to assess condition state, determine time to failure and remaining service life for each inspected pipe and subsequently establish proactive management strategies.
In most cases, a combination of circumstances leads to the failure of a pipe. Factors contributing to pipe failure include operational conditions, design parameters, external loads (traffic, frost, etc.), internal loads (operating and surge pressures), temperature changes, loss of bedding support, pipe properties and condition, and corrosion pit geometry. This information is recorded rarely, if at all and it is therefore very difficult to ascertain the precise causes of failure. Even if all this information were available, any attempt to estimate the pipe condition state would involve considerable uncertainty due to large spatial and temporal variability that is inherent in this information. Estimation of time to failure is further exacerbated by the uncertainties in determining future corrosion rates. Rajani et al. [3] and Rajani and Tesfamariam [4] have developed a Winkler-type pipe-soil interaction (WPSI) model that accounts for most of the factors identified earlier as the predominant contributors to pipe failure. Tesfamariam et al. [5] have recently transformed these models into a possibilistic framework to incorporate the uncertainties discussed earlier. This paper describes further development of this fuzzy based model to integrate corrosion models with the remaining wall thickness or pit geometry measurements and estimate the time to failure. The development described here is a step to estimating remaining service life of one pipe length with several corrosion pits of significant depths observed at the time of inspection.
Existing physical deterministic models for pipe-soil interaction provide point estimates for the factor of safety (FS) and time to failure of pipes. These models also do not allow the identification of predominant contributory factors that explain a specific failure mode that accounts for the uncertainties identified earlier. Therefore, the models need to be further developed to include uncertainties in order that the ‘probability’ or ‘possibility’ of pipe failure can be quantified. Possible approaches are Monte Carlo simulations, first order reliability methods, probability bound analysis (random sets) and possibilistic analysis using fuzzy arithmetic. In this paper, a possibilistic approach using fuzzy arithmetic is pursued to include uncertainties in the operational factors, the input data and the model parameters. Sensitivity analysis using rank-correlation coefficients is carried out to identify and evaluate the contributions of critical factors/parameters to the factor of safety. This paper reveals that the growth rate of a single corrosion pit on cast iron mains is nearly always more detrimental to thin (small diameter) than to thick (large diameter) pipes if all other data or properties remain unchanged.
2 PIPE-SOIL INTERACTION MODELS
Rajani and Tesfamariam [4] recently developed a Winkler-type pipe-soil interaction model that accounts for the unsupported length (likely to develop as a result of prolonged leakage or wash out) and soil elasto-plasticity. Axial, flexural and circumferential stress responses obtained from these models were consolidated with the previously reported ([3], [6]) responses, to establish an overall behaviour of buried water mains under the influence of earth and live loads, water pressure, temperature differential, unsupported length and pipe-soil interaction. Tesfamariam et al. [5] fuzzified these WPSI models to account for (a) uncertainties present in the input data and model parameters, and (b) failure modes using well accepted failure criteria for cast iron to determine the fuzzy factor of safety. Only sufficient details on the developed model and failure criteria for cast iron are given here to illustrate the extension of the model to include corrosion analysis of cast iron mains.
In general, the stress components due to external loads ( ), internal pressure ( ),
temperature differential ( ) and longitudinal bending ( ) that contribute to the total axial stress ( ) are, w x σ pi x σ T x σ f x σ a x σ (1) σxa =σxw +σxPi +σTx +σxf
Similarly, the total hoop stress ( ) has contributions from external loads ( ), internal
pressure ( ), temperature differential ( ) and longitudinal bending ( ),
Total θ σ w θ σ i p θ σ T θ σ f θ σ (2) p xf T P w f T P w Total σ σ i σ σ σ σ i σ ν σ σθ = θ + θ + θ + θ = θ + θ + θ −
where is the Poisson’s ratio for the pipe material. The thermal axial ( ) and hoop ( )
stresses in p ν T x σ T θ σ (1) and (2) are a consequence of temperature differential (ΔT) between the inside of the pipe and the surrounding soil. Each of the stress components in (1) and (2) can be estimated using solutions provided in the above-cited references. It should be noted that the calculations of these stresses are applicable independent of pipe size.
3 FAILURE THEORIES
In-service water mains or pipes are subjected to continuous deleterious reactions that undermine their resistance, and this coupled with internal and external loads degrade the design factor of safety (FS). Consequently, the time to failure is significantly reduced if existing stresses on structurally deteriorated pipe exceed the expected or admissible design loads or stresses. The structural FS of a deteriorating pipe diminishes ([4], [7]) as corrosion or graphitization pits initiate randomly and subsequently grow over time, even though external
and internal loads may not have changed significantly between time of installation and just prior to time of failure. Pipe failure is defined as an event in which the FS falls below a critical value, FScr, (usually set to 1), i.e.,FS<FScr. Cast iron, a brittle material, typically
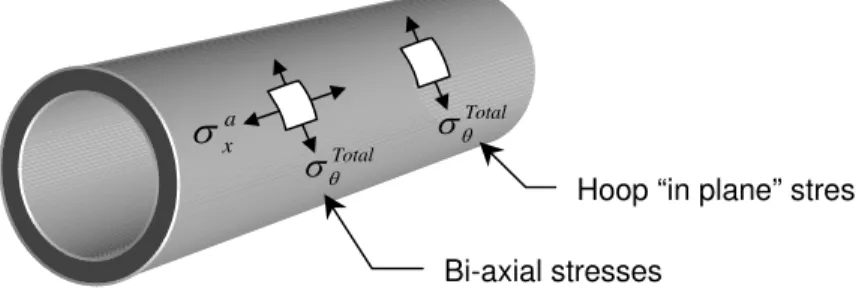
fails through facture at strains of 0.5%, rather than through yielding. Therefore, its failure is dictated by its ultimate strength. In contrast, yield strength is used to describe failure of ductile materials like those in ductile iron mains. Two specific failure criteria (theories) are applicable to cast iron, namely, in-plane (ip) and bi-axial distortion energy (de) [5]. Only the distortion energy criterion is discussed here since the predominant stresses on small diameter mains are biaxial as opposed to in-plane stresses in large diameter mains.
The existence of bi-axial stresses requires the use of cast iron fracture criteria that consider both hoop and axial stresses. The failure criterion proposed by Coffin [8] and Fisher [9] and later modified by Mair [10] was selected for its robustness and simplicity. These researchers investigated the response of cast iron in the presence of graphite flakes. Typically, the ferrite-graphite matrix transmits the load when the cast iron is in compression; however, the ferrite-graphite flakes act as stress raisers when subjected to tension. Consequently the ultimate tensile strength of a cast iron pipe is substantially lower than its ultimate compressive strength. Mair [10], based on his experimental work and that of Coffin [8] and Fisher [9], arrived at the conclusion that the cast iron failure criterion is best represented by the distortion energy theory developed by von Mises. This theory states that, failure by yielding or fracture occurs when the distortion energy per unit volume in a state of combined stress at any point in the body becomes equal to (or exceeds) that associated with yielding or fracture in a simple tension test ([6]). The distortion energy failure criterion for bi-axial stresses (Fig. 1) written in terms of the distortion energy factor of safety, FSde, is as follows:
de u
i FS
Kσ =σ / for σ1 andσ2 > 0 (tension)
(3)
(
)
2 2 2 2 1 2 1 K ( u /FSde)Kσ − σ σ +σ = σ for σ1 >0andσ2 <0 (tension - compression)
where K is a stress concentration factor (K = 3 for σi(i=1,2)) in tension; (K = 1 for ) 2 , 1 (i= i
σ in compression), σi are the principal ( and ) stresses. The stress
concentration factor, K represents an aggregate reduction in tensile strength in the presence of carbon flakes, which act as stress raisers. It should therefore not be confused with a factor typically used to calculate stresses in the presence of defects with specific geometry, although it has the same connotation.
a x σ Total θ σ 5
The ultimate strength of cast iron referred to in (3) is pertinent to cast iron that has no defects or corrosion (or graphitization) pits. The size of corrosion pits diminishes the intrinsic material strength of cast iron to the so-called residual ultimate strength (σur)in accordance with fracture mechanics theory ([11]) as follows,
(4) σur =αKq β
(
d/t an)
swhere α and s are constants used in the fracture toughness equations; is a provisional
fracture toughness (MPa√m); d is corrosion pit depth (mm); t is pipe wall thickness (mm); is lateral dimension (mm) of a pit = Ld (multiplier L can be judged to have a value in the range of 1-5 in the absence of data); β is the geometric factor for a double-edged notched
tensile specimen, , and a
q K n a
( )
1 / 1 b t d a =β 1 and b1 are constants for determining the geometric
factor. Rajani et al. [11] established fracture toughness and other related parameters (Kq, d, a1,
b1) based on limited experimental tests conducted on cast iron specimens taken from pipe
samples.
4 CORROSION ESTIMATES
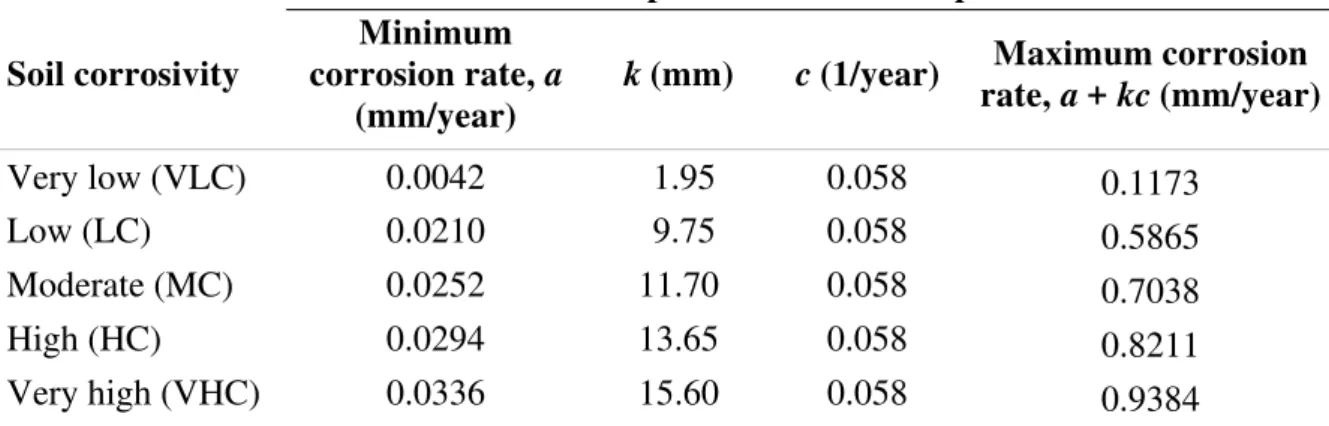
The loss of pipe wall thickness due to corrosion can be relatively uniform or localized. The rate of wall thickness loss has been the subject of debate, where it has been assumed to be constant or otherwise ([12], [13]). The rate of corrosion in uncoated cast iron pipes is generally higher at early age than in later years. There is evidence to suggest that corrosion is a self-inhibiting process, whereby as it proceeds, the protective properties of its products (generally iron oxides) reduce the corrosion rate over time [12]. Proposed models ([11], [14], [15], [16]) to predict pit depth growth varies between linear, power and exponential functions. The two-phase (in the first phase a rapid exponential pit growth and in the second a slow linear growth) model proposed by Rajani et al. [11] is used here to estimate time to failure since it accommodates the self-inhibiting process discussed earlier:
(5) (1 )
τ
τ k e c
a
d = + − − for pit depth
τ
c
kce a
d& = + − for pitting rate
where τ represents time. The constant combination of a + kc represents the maximum
corrosion rate and the constant a corresponds to the minimum (usually terminal) corrosion rate. The constant c can be viewed as an ‘inhibition’ factor. Metal and soil corrosivity (properties) will dictate the values of constants a, c, and k. Values for constants a, c, and k were selected based on observations that through (full penetration) corrosion pits in small
diameter cast iron mains can occur as early as 40 years (in very high corrosivity soils) and as late as 100 to 120 years or never (in very low corrosivity soils) as depicted in Fig. 2. The plots in Fig.2 are bounded between very low (VLC) and very high (VHC) soil corrosivity, and the corresponding parameters are summarized in Table 1. Wall thickness range is typically between 11.2 and 15.2 mm (0.44” and 0.6”) for 150 to 200 mm (6” to 8”) cast iron mains that operate at pressures between 345 and 690 kPa (50 and 100 psi).
5 UNCERTAINTY ANALYSIS AND ITS INTEGRATION WITH PIPE-SOIL INTERACTION MODELS, MATERIAL FAILURE THEORIES AND CORROSION
Complex models often involve input data or parameters with uncertainties, which are best represented by random variables with known or assumed probability distributions or ranges of values based on experience and engineering judgement ([17]). Different uncertainty analysis techniques have been used to study the reliability of cast iron pipes. Ahammed and Melchers (1994) [12] used the first order reliability method (FORM) to incorporate uncertainties in the input parameters. Sadiq et al. (2004) [21] used Monte Carlo (MC) simulations to develop a hazard function of time to failure. Both MC simulations and FORM methods assume that the model parameters are random variables that can be represented by probability distributions. Such distributions are best derived from statistical sample data that adequately represent the populations of interest. Unfortunately, such statistical samples are rarely available for most buried pipe infrastructure and especially data on corrosion that have been obtained through observations for long periods of time.
In this paper, fuzzy numbers are used to represent uncertainties, since the fuzzy set theory is able to deal effectively with epistemic uncertainties that encompass subjectivity and vagueness and allows approximate reasoning. The theory also has the intrinsic ability to propagate uncertainties through the model. Uncertainty analysis in this paper is performed using fuzzy arithmetic (also referred to as possibilistic analysis, as this synergism was first proposed by Zadeh in 1978 [18]). Uncertainty in possibility theory is represented by dual
measures, possibility denoted by Πand necessity denoted by Ν . These dual measures can be interpreted within the Dempster-Shafer framework as plausibility and belief (certainty or
surety) [19]. A complete discussion on why and how fuzzy set theory is used to incorporate uncertainties in the pipe-soil interaction model is explained in [5].
Corrosion models together with information about soil corrosivity derived either from soil properties [21] or past experience (Table 1) can be used to estimate the growth rate of corrosion pits. The pit depth (da) obtained from NDT inspection (at current time, τa) and
known or assumed soil corrosivity can be used to estimate the corrosion initiation time (τi)
using equation (5). Of course, the estimated time (τi) cannot exceed pipe age, however if it
does, it means that the assessed soil corrosivity is on the low side of what the current pit depth indicates and consequently, higher soil corrosivity has to be specified. Low soil corrosivity for the same pit depth will result in an earlier time for the initiation of corrosion as shown in Fig. 3.
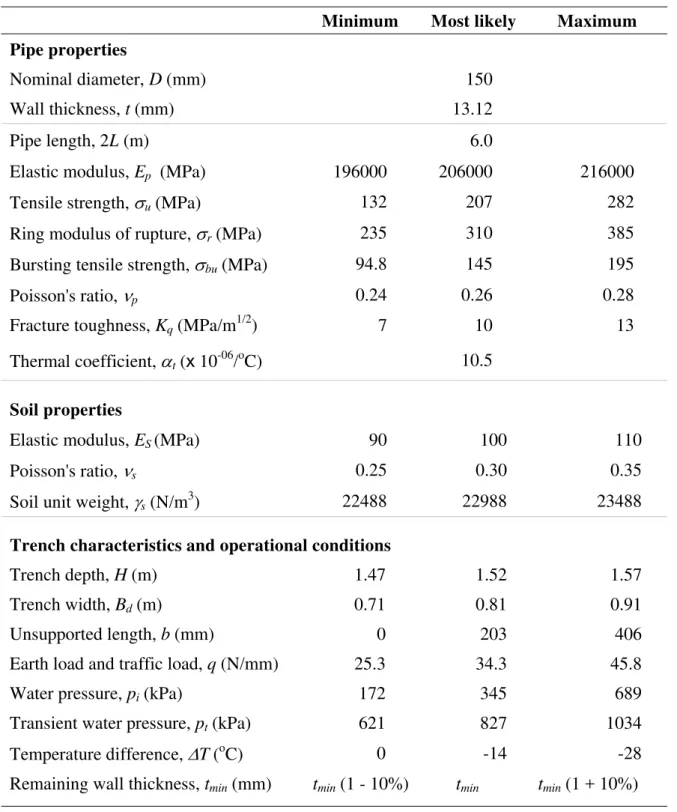
The solutions for each of the stress components (1) and (2) together with failure theory criterion as well as expression (5) that describes pit growth were evaluated using fuzzy arithmetic to obtain realistic ranges of values for factors of safety. The data/parameters required for the pipe-soil interaction models discussed in the previous section can be grouped into four broad categories (Table 2): pipe properties (geometry and material); soil properties (unit weight, Poisson’s ratio, internal friction, etc.) and trench characteristics (trench depth, trench width); traffic type and operational conditions (internal pressure, transient pressure, temperature variation, unsupported length, etc.) and soil corrosivity. The uncertainties in each of the data/parameters were expressed in terms of triangular fuzzy numbers (TFNs - lower and upper bounds and most likely values), based on available data, best engineering judgment and experience. ‘Crisp’ (point) values were used for properties known with certainty.
Thus the time to failure τf for a specific pipe with a known remaining wall thickness at the
current time τa, and installed at time (τo) can be obtained using the following time marching
scheme:
1. Estimate the time (τi) a corrosion pit initiated using the pit depth (da) from NDT
inspection and assess soil corrosivity.
2. Obtain pit depth (dτ) at time (τ) from equation (5) for all τ ≥ τa.
3. Determine the fuzzy factor of safety (FS) that corresponds to the pit depth (dτ) found in the previous step.
4. Compute the possibility and necessity measures
5. Repeat steps 2 to 4 for each time increment until the specified Π or Ν is reached, i.e., for the hypothesis FS<FScr. The time when this occurs is defined as time to failure (τf).
6 SENSITIVITY ANALYSES
Two types of sensitivity analyses are described in this paper. The first type considers how the calculated fuzzy factors of safety (FSde) decrease with growth of corrosion pit depth and the
increase in unsupported bedding length in a 75 year old 150 mm (6”) diameter cast iron main embedded in a moderately (Fig. 4a) corrosive (MC) environment (Tables 1 and 2). The pipe was assumed to have a single pit with a remaining wall thickness of 0.75t when inspected. It
is also assumed that the leak and consequent loss of bedding initiate when the pit depth ≥ 0.75t and increases to a maximum of five times pipe diameter (D) when the pit has fully penetrated pipe wall thickness. At any given time, τ, a TFN (shaded area) in Fig. 4a shows in grey scale how the membership to [minimum, most likely, maximum] fuzzy factors of safety changes with time as the pit depth grows and unsupported bedding length increases, i.e., dark and light regions represent highest and lowest memberships of 1 and 0, respectively. The long tail (positively skewed) in the TFN of the factor of safety at early times to failure, i.e., with low loss of wall thickness (no corrosion) and full bedding support, diminishes as the wall thickness and unsupported length increase. In accordance with the central limit theorem (Melchers 1987), the product of a large number of random variables approaches lognormal distribution, irrespective of the individual distributions of the random variables. The observed
TFNs demonstrate an analogous behaviour in the possibilistic analysis described here. The
long tail in the membership for fuzzy factor of safety indicates that in a new pipe most input/parameters play a significant role in the determination of the safety of the pipe at the design stage. However, as the pipe deteriorates, corrosion plays a dominant role as indicated by the short tails of the TFNs representing FS at late times to failure. The fuzzy factor of safety decreases noticeably as the remaining wall thickness decreases.
Possibility (Π) and necessity (Ν ) measures for a fuzzy FS with respect to the ‘critical’ factor of safety, assumed here as FScr = 1, were computed as explained in [5]. Figure 3b shows how
necessity, i.e., surety, of failure increases with time for various soil corrosivity levels. Time to failure ranges between 25 to 80 years (from the time when pit depth is 0.25t) for a 75 year-old cast iron main with a current pit depth of 0.25t and buried in very high (VHC) to moderately (MC) corrosive soils, respectively. At first glance Fig. 4b may suggest that the necessity (Ν ) (certainty or surety) at a specific time to failure, say, 50 years, for a pipe buried in moderately corrosive soil is 0.42, a crisp value rather than an interval. However, when Ν > 1, the possibility measure has already reached unity, i.e., Π = 1. Therefore, within the framework of possibility theory, the true probability of failure at 50 years is between the interval 0.42 and 1. The second type of sensitivity analysis is not restricted to assessing the influence of specific variables but is broad in that it assesses the outcome of variability in any of the input data/parameters ([22]). This type of analysis also serves to identify the important uncertainties in order to prioritize additional data collection efforts. A Monte Carlo type simulation procedure with the rank correlation method was employed for the sensitivity analysis of the second type. This procedure was applied in the context of fuzzy input data generated
randomly (1000 iterations) using the α-cut concept of fuzzy sets. The α-cut can be used to form a fuzzy confidence band, which can be viewed as a possibilistic confidence interval analogous to the probabilistic confidence interval. Details on implementing α-cut based Monte Carlo simulation are provided in [5].
A sensitivity analysis was conducted on a cast iron pipe with the same characteristics as for the first analysis, except that the time frame considered was within 10 ± 2.5 years following inspection. The sensitivity of FS to each of the input parameters is shown in the form of tornado graphs in Fig. 5 (distortional energy failure criteria). Tornado graphs facilitate the visualization of the positive or negative influences (% contribution) on the factor of safety, as a consequence of an increase in one specific input parameter. As expected, Fig. 5 shows that the factor of safety increases with an increase in fracture toughness Kq, which contributes to
the increase in pipe structural resistance. On the other hand, an increase of unsupported length (b), and external loads (q) leads to a reduction in the factor of safety. However, the maximum corrosion-pitting rate (a + kc) is the largest contributor towards the decrease in FS.
The sensitivity analyses also show that some variables, e.g., minimum corrosion pitting rate (a), soil modulus of elasticity (Es), internal (pi) and transient (pt) pressures, and temperature
differential (ΔT), have very low to insignificant influences on the structural factor of safety of small diameter buried pipes. Temperature differential (ΔT) becomes a significant contributor to the decrease in FS when the unsupported length (b) is small (b = 1D) but not when it is large, i.e., b = 3D. It can also be argued that some of these factors could be expressed as point estimates without compromising the accuracy of the results; consequently no effort should be invested in obtaining more precise values for these factors.
7 CONCLUSIONS
A previously developed pipe-soil interaction model was combined with failure theories and corrosion models to determine time to failure with uncertainties represented as triangular fuzzy numbers. The fuzzification of the mechanistic pipe-soil interaction and corrosion models combined with possibility theory provides a systematic approach to incorporating and propagating uncertainties and vagueness throughout the solution process.
The sensitivity analyses clearly show that the long-term performance of buried cast iron is dictated by pit growth rate, unsupported length, fracture toughness and temperature differential. These sensitivity analyses strongly suggest that reducing pit depth (graphitization) growth by using effective corrosion control can be an effective way to decelerate breakage growth rate. This observation corroborates the experience of utilities and
corrosion engineers. The proposed methodology is a viable approach to practically determining time to failure of cast iron mains under different soil conditions.
The decision to renew or replace specific pipe segments or the whole pipe will depend on the corrosion or pit growth rate(s), density of the corrosion pits along the pipe length, economics (costs of repair, renewal or replacement, discount factor, etc), hydraulics considerations and how internal pipe condition affects water quality. The proposed approach is a step towards the formulation of a method to facilitate the decision-making process of when to repair, renew or replace individual pipe lengths based on their current condition state. The possibilistic analysis allows the designer/owner/operator to decide the level of risk that is acceptable on the basis of structural integrity and thus define different repair and maintenance strategies at different risk tolerances.
References
[1] Hartman, W.F. and Karlson, K. Condition assessment of water mains using remote field technology. Infra 2002, Montreal, Quebec, Canada, 2002.
[2] Rajani, B. and Kleiner, Y. Non-destructive inspection techniques to determine structural distress indicators in water mains. Workshop on Evaluation and Control of Water Loss
in Urban Water Networks, Valencia, Spain, 2004, 1-20.
[3] Rajani, B., Zhan, C. and Kuraoka, S. Pipe-soil interaction analysis for jointed water mains. Canadian Geotechnical Journal, 1996, 33, 393-404.
[4] Rajani, B. and Tesfamariam, S. Uncoupled axial, flexural, and circumferential pipe-soil interaction analyses of jointed water mains. Canadian Geotechnical Journal, 2004, 41, 997-1010.
[5] Tesfamariam, S., Rajani, B. and Sadiq, R. Possibilistic Approach for Consideration of Uncertainties to Estimate Structural Capacity of Ageing Cast Iron Water Mains.
Canadian Journal of Civil Engineering, 2006, in press.
[6] Ugural, A.C. and Fenster, S.K. Advanced Strength and Applied Elasticity. Elsevier, New York, N.Y., 1987.
[7] Rajani, B. and Makar, J. A methodology to estimate remaining service life of grey cast iron water mains. Canadian Journal Civil Engineering, 2000, 27, 1259-1272.
[8] Coffin, L.F. The flow and fracture of a brittle material. Journal of Applied Mechanics, 1950, 181, 233-248.
[9] Fisher, J.C. A criterion for the failure of cast iron. American Society of Testing
Materials, 1952, 181, 74-75.
[10] Mair, W.M. Fracture criteria for cast iron under biaxial stresses. Journal of Strain
Analysis, 1968, 3, 4, 254-263.
[11] Rajani, B., Makar, J., McDonald, S., Zhan, C., Kuraoka, S., Jen, C-K., and Viens, M. Investigation of grey cast iron water mains to develop a methodology for estimating service life. American Water Works Association Research Foundation, Denver, CO. 2000.
[12] Ahammed, M. and Melchers, R.E. Reliability of underground pipelines subject to corrosion. Journal of Transportation Engineering, ASCE, 1994, 120, 6, 989-1002. [13] Romanov, H. Underground corrosion. NBS Circular 579, National Bureau of Standards,
Washington D.C., 1957
[14] Kucera, V. and Mattson, E. Atmospheric corrosion, Corrosion mechanics. F. Mansfeld, Ed., Mercel Dekker, Inc., New York, NY., 1987
[15] Rossum, J.R. Prediction of pitting rates in ferrous metals from soil parameters. Journal
of American Water Works Association, 1969, 61, 305-310.
[16] Sheikh, A.K., Boah, J.K. and Hensen, D.A. Statistical modelling of pitting corrosion and pipeline reliability. Corrosion, 1990, 46, 3, 190-197.
[17] Ross, T. Fuzzy logic with engineering applications (2nd edition), John Wiley & Sons, New York, NY., 2004
[18] Zadeh, L. Fuzzy sets as a basis for a theory of possibility. Fuzzy sets and Systems, 1978, 1, 3-28.
[19] Alim, S. Application of Dempster–Shafer theory for interpretation of seismic parameters. Journal of Structural Engineering, ASCE, 1988, 114, 9, 2070-2084. [20] Sadiq, R., Rajani, B. and Kleiner, Y. Probabilistic risk analysis for corrosion associated
failures in grey cast iron water mains. Reliability Engineering & System Safety, 2004, 86, 1, 1-10.
[21] Najjaran, H., Sadiq R., and Rajani, B. Fuzzy Expert System to Assess Corrosivity of Cast/Ductile Iron Pipes from Backfill Properties. Computer-Aided Civil and
Infrastructure Engineering, 2006, 21, 1, 66-77.
[22] Melchers, R. E. Structural reliability: analysis and prediction. John Wiley & Sons, New York. 1987
[23] Cullen, A.C. and Frey, H.C. Probabilistic Techniques in Exposure Assessment: a Handbook—for Dealing with Variability and Uncertainty in Models and Inputs. Plenum Press, New York, 1999.
Table 1 Corrosion parameters for two-phase model.
Corrosion parameters for two-phase model Soil corrosivity
Minimum corrosion rate, a
(mm/year)
k (mm) c (1/year) Maximum corrosion
rate, a + kc (mm/year) Very low (VLC) 0.0042 1.95 0.058 0.1173 Low (LC) 0.0210 9.75 0.058 0.5865 Moderate (MC) 0.0252 11.70 0.058 0.7038 High (HC) 0.0294 13.65 0.058 0.8211 Very high (VHC) 0.0336 15.60 0.058 0.9384 14
Table 2 Input parameters for pipe, soil and operational conditions for 150 mm diameter cast iron mains.
Minimum Most likely Maximum
Pipe properties
Nominal diameter, D (mm) 150
Wall thickness, t (mm) 13.12
Pipe length, 2L (m) 6.0
Elastic modulus, Ep (MPa) 196000 206000 216000
Tensile strength, σu (MPa) 132 207 282
Ring modulus of rupture, σr (MPa) 235 310 385
Bursting tensile strength, σbu (MPa) 94.8 145 195
Poisson's ratio, νp 0.24 0.26 0.28
Fracture toughness, Kq (MPa/m1/2) 7 10 13
Thermal coefficient, αt (x 10-06/oC) 10.5
Soil properties
Elastic modulus, ES (MPa) 90 100 110
Poisson's ratio, νs 0.25 0.30 0.35
Soil unit weight, γs(N/m3) 22488 22988 23488
Trench characteristics and operational conditions
Trench depth, H (m) 1.47 1.52 1.57
Trench width, BBd(m) 0.71 0.81 0.91
Unsupported length, b (mm) 0 203 406
Earth load and traffic load, q (N/mm) 25.3 34.3 45.8
Water pressure, pi(kPa) 172 345 689
Transient water pressure, pt(kPa) 621 827 1034
Temperature difference, ΔT (oC) 0 -14 -28
Remaining wall thickness, tmin(mm) tmin (1 - 10%) tmin tmin (1 + 10%)
List of figures
Fig. 1 Schematic illustrations of bi-axial and hoop (in-plane) stresses
Fig. 2 Assumed (a) pit growth and (b) pit corrosion rates for soils with different corrosivity.
Fig. 3 Schematics of pit growth in a very high and low corrosivity soils.
Fig. 4 (a) Declining factor of safety with time for cast iron mains in moderately corrosive (MC) soils, (b) Variation of necessity with time for mains in soils with different corrosivity.
Fig. 5 Sensitivity of factor of safety (distortion energy criterion) to input variables for 75 year old 150 mm diameter cast iron main buried in moderately corrosive soils with remaining wall thickness of 0.75t.
Fig. 1 a x
σ
Total θ σ Total θ σHoop “in plane” stress Bi-axial stresses
0 5 10 15 20 0 30 60 90 120
E
x
te
rn
a
l co
rro
sio
n
pi
t de
pt
h
(m
m)
Exposure period (years)
HC VHC MC LC VLC (a) 0 0.2 0.4 0.6 0.8 1 0 30 60 90 120E
x
te
rna
l c
o
rro
si
on
pi
t r
a
te
(
m
m/
y
ear
)
Exposure period (years)
HC VHC MC LC VLC (b) Fig. 20 4 8 12 16 0 50 100 150 200
Ex
te
rn
al
c
o
rr
o
s
io
n
pi
t de
pt
h
(
mm
)
Exposure period (years)
Low soil corrosivity Very high soil corrosivity D = 200 mm (8") D = 150 mm (6") Pit detected at age 75 years Corrosion initiated 28 years ago (τ a) (τ i) (τ o) Fig. 3FScr= 1
Most likely value
Time to failure (years)
Factor of s a fety, FS de (b) 0 0.5 1 0 25 50 75 100
Nec
es
s
it
y, N
Time to failure (years)
VHC HC MC LC VLC (b) Fig. 4
-50 -25 0 25 50
Rupture modulus, Burst tensile strength, Fracture toughness, Soil elastic modulus, Unsupported length, Internal pressure, Transient pressure, Earth and traffic loads, Temperature variation, Max corrosion rate, Min corrosion rate,
b = 3D, d = 0.50t b = 1D, d = 0.25t
Percent contribution to variability of FS
de (%) a a + kc