HAL Id: hal-01189628
https://hal.archives-ouvertes.fr/hal-01189628
Submitted on 31 May 2020
HAL is a multi-disciplinary open access
archive for the deposit and dissemination of
sci-entific research documents, whether they are
pub-lished or not. The documents may come from
teaching and research institutions in France or
abroad, or from public or private research centers.
L’archive ouverte pluridisciplinaire HAL, est
destinée au dépôt et à la diffusion de documents
scientifiques de niveau recherche, publiés ou non,
émanant des établissements d’enseignement et de
recherche français ou étrangers, des laboratoires
publics ou privés.
Temperature response of parameters of a biochemically
based model of photosynthesis. II. A review of
experimental data
B.E. Medlyn, Erwin Dreyer, D. Ellsworth, M. Forstreuter, P.C. Harley,
M.U.F. Kirschbaum, Xavier Le Roux, Pierre Montpied, J. Strassemeyer, A.
Walcroft, et al.
To cite this version:
B.E. Medlyn, Erwin Dreyer, D. Ellsworth, M. Forstreuter, P.C. Harley, et al.. Temperature response
of parameters of a biochemically based model of photosynthesis. II. A review of experimental data.
Plant, Cell and Environment, Wiley, 2002, 25 (9), pp.1167-1179. �10.1046/j.1365-3040.2002.00891.x�.
�hal-01189628�
Plant, Cell and Environment (2002) 25, 1167–1179
© 2002 Blackwell Publishing Ltd 1167
Blackwell Science, LtdOxford, UK PCEPlant, Cell and Environment0016-8025Blackwell Science Ltd 2002 25
891
Temperature response of photosynthetic parameters – review B. E. Medlyn et al.
10.1046/j.0016-8025.2002.00891.x Original Article11671179BEES SGML
Correspondence: Belinda E. Medlyn, School of Biological, Earth and Environmental Science, University of New South Wales, UNSW Sydney 2052, Australia. Fax:+61 (0)29385 1558;
e-mail: B.Medlyn@unsw.edu.au
Temperature response of parameters of a biochemically
based model of photosynthesis. II. A review of
experimental data
B. E. MEDLYN1,2, E. DREYER3, D. ELLSWORTH4, M. FORSTREUTER5, P. C. HARLEY6, M. U. F. KIRSCHBAUM7, X. LE ROUX8,9,
P. MONTPIED3, J. STRASSEMEYER5, A. WALCROFT8,10, K. WANG11 & D. LOUSTAU1
1INRA Pierroton, Laboratoire d'Ecophysiologie et Nutrition, 33611 Gazinet Cedex, France, 2School of Biological, Earth and
Environmental Science, University of NSW, Sydney 2052, Australia, 3UMR INRA UHP, Ecologie et Ecophysiologie Forestières,
54280 Champenoux, France, 4School of Natural Resources and Environment, University of Michigan, Ann Arbor, MI 48109,
USA, 5Institut für Ökologie, Technische Universität Berlin, Königin-Luise-Str.22, D-100 Berlin 33, Germany, 6Atmospheric
Chemistry Division, NCAR, Boulder, CO 80307–3000, USA, 7CSIRO Forestry and Forest Products, PO Box E4008, Kingston
ACT 2604, Australia, 8UMR PIAF (INRA/University Blaise Pascal), 234 avenue du Brezet, 63039 Clermont Ferrand, France, 9UMR 5557 Ecologie Microbienne, 43 bd du 11 novembre 1918, 69622 Villeurbanne, France, 10Manaaki Whenua – Landcare
Research, Private Bag 11 052, Palmerston North, New Zealand and 11Faculty of Forestry, University of Joensuu, PO Box 111,
Joensuu, Finland
ABSTRACT
The temperature dependence of C3 photosynthesis is
known to vary with growth environment and with species. In an attempt to quantify this variability, a commonly used biochemically based photosynthesis model was parameter-ized from 19 gas exchange studies on tree and crop species. The parameter values obtained described the shape and amplitude of the temperature responses of the maximum rate of Rubisco activity (Vcmax) and the potential rate of
electron transport (Jmax). Original data sets were used for
this review, as it is shown that derived values of Vcmax and its
temperature response depend strongly on assumptions made in derivation. Values of Jmax and Vcmax at 25°°°°C varied
considerably among species but were strongly correlated, with an average Jmax:Vcmax ratio of 1·67. Two species grown
in cold climates, however, had lower ratios. In all studies, the Jmax:Vcmax ratio declined strongly with measurement
temperature. The relative temperature responses of Jmax
and Vcmax were relatively constant among tree species.
Acti-vation energies averaged 50 kJ mol−−−−1 for J
max and 65 kJ
mol−−−−1 for V
cmax, and for most species temperature optima
averaged 33°°°°C for Jmax and 40°°°°C for Vcmax. However, the
cold climate tree species had low temperature optima for both Jmax(19°°°°C) and Vcmax (29°°°°C), suggesting acclimation
of both processes to growth temperature. Crop species had somewhat different temperature responses, with higher activation energies for both Jmax and Vcmax, implying
nar-rower peaks in the temperature response for these species. The results thus suggest that both growth environment and
plant type can influence the photosynthetic response to temperature. Based on these results, several suggestions are made to improve modelling of temperature responses.
Key-words: electron transport; model parameters; photosynthesis; ribulose-1,5-bisphosphate carboxylase-oxygenase; ribulose-1,5-bisphosphate regeneration; tem-perature acclimation.
INTRODUCTION
Many of the models used to study effects of global change on plant function and growth incorporate the Farquhar, von Caemmerer & Berry (1980) model of C3 photosynthesis
(e.g. Cramer et al. 2001). This model is particularly useful in this context because it represents mechanistically the effects of elevated atmospheric [CO2], a major factor in
glo-bal change, on photosynthesis. The model has two major parameters, the potential rate of electron transport (Jmax)
and the maximum rate of ribulose-1,5-bisphosphate car-boxylase-oxygenase (Rubisco) activity (Vcmax). There is now
a large database of values of Jmax and Vcmax (Wullschleger
1993) and the effects of elevated [CO2] on these parameters
(Medlyn et al. 1999). The model also has the potential to accurately represent the effects of elevated temperature, a second major factor in global change that directly affects plant growth. However, as many modellers are aware, there is a dearth of information regarding the temperature responses of Jmax and Vcmax (Leuning 1997).
We know that these temperature responses are likely to vary, because the temperature response of photosynthesis itself varies with genotype and environmental conditions, and may acclimate to changes in growth temperature (Slatyer & Morrow 1977; Berry & Björkman 1980). To date, however, there has been a fairly limited number of studies
1168 B. E. Medlyn et al.
Plant, Cell and Environment
examining temperature responses in the context of the Far-quhar model (Leuning 1997). The limited amount of infor-mation available can result in possibly inappropriate parameter choices. The database of temperature responses of model parameters has the potential to expand in the near future, given recent improvements in temperature control in commercially available gas exchange systems. However, there is a second obstacle to identifying variation in these responses between species, which is that parameter values obtained from data can differ according to the method used to derive them, as is shown below. Direct comparison of parameter values between different studies can therefore be misleading. Wullschleger (1993) solved this problem when compiling a database of Jmax and Vcmax by deriving all
parameter values himself directly from A–Ci curves, thus
ensuring consistency between parameters.
The aim of this study was to improve modelling of pho-tosynthetic temperature responses by compiling and com-paring existing information on the temperature response of the parameters of the Farquhar et al. (1980) model of pho-tosynthesis. Few studies have compared variation of these parameters among species, so a broad understanding of temperature responses and their relationship to species characteristics and growth environment is lacking. We adopted the approach of Wullschleger (1993), using consis-tent methods to derive model parameters from the original data sets. Some 19 data sets were obtained. In order to draw some generalizations from these data sets, we attempted to link variation in the parameters between data sets to ecological factors such as functional type and growth environment.
METHODS
Data
Estimates of the parameters Jmax and Vcmax may be
obtained in several ways including gas exchange (Kirsch-baum & Farquhar 1984; Harley, Tenhunen & Lange 1986), in vitro methods (Badger & Collatz 1977; Armond, Schreiber & Björkman 1978) or chlorophyll fluorescence (Niinemets, Oja & Kull 1999). In order to ensure that responses were comparable, we chose only to include gas exchange data. In this method, values of Jmax and Vcmax are
obtained from the response of photosynthesis under high light (A) to intercellular CO2 (Ci). A family of A–Ci curves
at different temperatures will thus give the temperature response of the two parameters Jmax and Vcmax. Obtaining
such a family of curves is very time-consuming and hence several authors have attempted to estimate the tempera-ture responses of Jmax and Vcmax using reduced data sets
(e.g. Hikosaka, Murakami & Hirose 1999; Wohlfahrt et al. 1999). We attempted to include some of these studies here, but we found that such shortcuts considerably reduced the accuracy of the parameter values, and therefore decided against their inclusion.
We required the original A–Ci curves from each study,
for reasons illustrated below. However, in two cases the
original data were no longer available (Kirschbaum & Far-quhar 1984; Harley et al. 1992). Temperature responses from these two studies have been extensively used in mod-elling, so we thought it important to include them in the comparison. Therefore, in these two cases, typical A–Ci
curves were reconstructed from reported parameter values and the model was re-fitted to these curves. Statistical information on parameters obtained in this way is neces-sarily missing. Details of all data sets used are given in Table 1.
In most cases, temperature responses were obtained by applying temperature control to leaves for the duration of the gas exchange measurements. In contrast, in the exper-iments carried out by Dreyer et al. (2001) and Robakowski, Montpied & Dreyer (2002) (Table 1), temperature changes were applied to the whole seedlings for the night preceding the measurements. This procedure could potentially have modified the temperature response, as there is evidence that the thermal properties of photosystem II (PSII) and of electron transport may begin to acclimate after even a few hours at a given temperature (e.g. Havaux 1993). The results presented below, however, do not appear to indicate any difference between the experiments carried out by this group and other experiments.
Model
Overview of the Farquhar et al. (1980) model of
photosynthesis
Farquhar et al. (1980) proposed that net leaf photosynthe-sis, An, could be modelled as the minimum of two limiting
rates:
(1) Ac is the rate of photosynthesis when Rubisco activity is
limiting and Aj the rate when ribulose-1,5-bisphosphate
(RuBP)-regeneration is limiting. Rd is the rate of
mitochon-drial respiration. Rubisco-limited photosynthesis is given by:
(2)
where Vcmax is the maximum rate of Rubisco activity, Ci and
Oi are the intercellular concentrations of CO2 and O2,
respectively, Kc and Ko are the Michaelis–Menten
coeffi-cients of Rubisco activity for CO2 and O2, respectively, and
Γ* is the CO2 compensation point in the absence of
mito-chondrial respiration. This formulation of the model assumes that the cell-wall conductance, the conductance between the intercellular space and the site of carboxyla-tion, is negligible. Some authors have argued that this con-ductance is significant and may vary with leaf temperature (e.g. Makino, Nakano & Mae 1994). For most species con-sidered here, we did not have access to appropriate data to evaluate the cell-wall conductance and hence were obliged to use the form of the model given above.
An=min
(
A Ac, j)
-Rd A V C C K O K c cmax i i c i 0 =(
-)
+ ÊË + ˆ¯ È ÎÍ ˘ ˚˙ G * 1Ta
b
le
1
.
Details of experimental data sets used
Species Common name A uthor Measurement T Plants P oints Growth T Growth conditions Age of plants Notes
Crops Glycine max
Soybean
Harley
, W
eber & Gates
(1985) 20,25,30,35,40 3 4 8 2 5 GH – T seedlings O2 varied also Gossypium hirsutum Cotton Harley et al . (1992) 18,26,29,35 2 2 9 GH – T seedlings Raw data unavailable
Deciduous trees Acer pseudoplatanus
Sycamore Dreyer et al . (2001) 10,18,25,32,36,40 5 2 8 1 6 N (F rance) seedlings Betula pendula Silver birch W ang (unpub .) 5,10,22,26,32 4 2 0 1 4 O TC (F inland) seedlings Betula pendula Silver birch Dreyer et al . (2001) 10,18,25,32,40 5 2 5 1 7 N (F rance) seedlings F agus sylvatica Common beech Dreyer et al. (2001) 10,18,25,32,40 5 2 5 1 7 N (F rance) seedlings F agus sylvatica Common beech Strassemeyer & F orstreuter (1997) 19,23,26,30,35 7 2 8 2 0 ME (Germany) seedlings F raxinus excelsior Ash Dreyer et al. (2001) 10,18,25,32,36,40 5 3 0 1 6 N (F rance) seedlings Juglans regia W alnut Dreyer et al. (2001) 10,18,25,32,40 5 2 5 1 7 N (F rance) seedlings Prunus persica Peach W alcroft et al. (2002) 10,20,25,32,37 5 1 9 1 9 GH (F rance) 2 year Quercus petraea Sessile oak Dreyer et al. (2001) 10,18,25,32,36,40 5 2 5 1 6 N (F rance) seedlings Quercus robur English oak Dreyer et al. (2001) 10,18,25,32,36,40 5 3 0 1 6 N (F rance) seedlings Quercus robur English oak Strassemeyer & F orstreuter (unpub .) 15,21,26,30,36 8 2 9 2 0 ME (Germany) seedlings
Evergreen trees Abies alba
Silver fir Robakowski et al. (2002) 10,18,26,32,36,40 5 2 8 2 5 N (F rance) seedlings Eucalyptus paucifl ora Snowgum Kirschbaum & F arquhar (1984) 15–35 1 2 0 GH – T seedlings Raw data unavailable Pinus pinaster Maritime pine Medlyn et al. (2002) 15,20,25,30,35 6 2 7 2 4 fi eld (F rance) 30 year Local provenance , A ugust Pinus radiata Radiata pine W alcroft et al. (1997) 8,15,20,25,30 3 1 4 2 4 GH (NZ) seedlings T wo fertilization treatments Pinus sylvestris Scots pine W ang , K ellomaki &Laitinen (1996) 6,11,21,26,31 4 1 8 1 4 O TC (F inland) 20–25 year Pinus taeda Loblolly pine
Ellsworth & Klimas
(submitted) 15,28,35 5 1 4 2 4 F A CE (N . Carolina) 12 year June and A ugust combined P
oints is the total number of data points used.
Growth
T
is the mean temperature in the month preceding the measurements
. Growth conditions: GH, greenhouse; GH – T , temperature-controlled greenhouse; N , nursery; O T C
, open-top chamber (control treatment);
ME,
mini-ecosystem (control treatment);
F A CE, fre e-air CO 2
1170 B. E. Medlyn et al.
The rate of photosynthesis when RuBP regeneration is limiting is given by:
(3) where J is the rate of electron transport. J is related to incident photosynthetically active photon flux density, Q, by:
(4) where Jmax is the potential rate of electron transport, θ is the
curvature of the light response curve and α is the quantum yield of electron transport. The value of α was fixed at 0·3 mol electrons mol−1photon, based on an average C3
pho-tosynthetic quantum yield of 0·093 and a leaf absorptance of 0·8 (Long, Postl & Bolharnordenkampf 1993). The value of θ was taken to be 0·90. These parameter values have only a slight effect on the estimated value of Jmax.
The key parameters of the model, which vary among species, are Jmax and Vcmax. It is the temperature
depen-dences of these parameters that we set out to examine. In addition, it is known that the parameters Kc, Ko and Γ*
vary with temperature. These parameters, by contrast, are thought to be intrinsic properties of the Rubisco enzyme and are generally assumed constant among species, thereby minimizing the number of parameters to be fitted (Harley et al. 1986).
T-dependence of K
c, K
o, and
Γ*
The in-vivo temperature dependence of the Michaelis– Menten coefficients of Rubisco, Kc (µmol mol−1) and Ko
(mmol mol−1), was recently measured in transgenic tobacco over the temperature range 10–40°C (Bernacchi et al. 2001) and the following relationships obtained:
(5)
(6) Tk denotes leaf temperature in K and R is the universal gas
constant (8·314 J mol−1K−1). Previous parameterizations of
the photosynthesis model have been based on in vitro determinations of these functions, carried out by Badger & Collatz (1977) and Jordan & Ogren (1984), which are given here for comparison. Badger & Collatz (1977) determined carboxylase and oxygenase activities over the temperature range 5–35°C of Rubisco purified from leaves of Atriplex glabriscula. They obtained the following relations (as given in Farquhar et al. 1980): (7) (8) (9) A J C C j i i = ÊË ˆ¯ ¥
-(
)
+(
)
4 2 G G * * qJ2-(
aQ J+)
J+aQJ =0 max max K T RT c k k = ◊ ( - ) ( ) È ÎÍ ˘ ˚˙ 404 9 79430 298 298 exp K T RT o k k = ◊ ( - ) ( ) È ÎÍ ˘ ˚˙ 278 4 36380 298 298 exp K T RT T c k k C = ( - ) ( ) È ÎÍ ˘ ˚˙(
> ∞)
460 59 536 298 298 15 exp = ( - ) ( ) È ÎÍ ˘ ˚˙(
< ∞)
920 109 700 298 298 15 exp T RT T k k C K T RT o k k = ( - ) ( ) È ÎÍ ˘ ˚˙ 330 35 948 298 298 expJordan & Ogren (1984), working with Rubisco purified from spinach over the temperature range 5–40°C, obtained the following relationships (equations derived by Harley & Baldocchi 1995):
(10)
(11) Figure 1a illustrates the temperature dependence of the
effective Michaelis–Menten coefficient for CO2,
Km= Kc(1+ Oi/Ko), at an intercellular O2 concentration of
210 mmol mol−1, using each of these three sets of equations.
Similarly, the temperature dependence of the CO2
com-pensation point, Γ* (µmol mol−1), was estimated by
Bernac-chi et al. (2001) to be:
(12) Alternative expressions of the temperature dependence of the CO2 compensation point, Γ*, are generally based on
the work of either Badger and colleagues (Badger & Andrews 1974, Badger & Collatz 1977), Jordan & Ogren (1984) or Brooks & Farquhar (1985). These three alterna-tive temperature dependences are illustrated in Fig. 1b. The CO2 compensation point is related to Kc and Ko and to the
maximum oxygenation activity of Rubisco, Vomax(Farquhar
et al. 1980):
(13) Badger & Andrews (1974) observed that the ratio Vomax/
Vcmax= 0·21, independent of temperature, allowing the
tem-perature dependence of Γ* to be determined from that of Kc and Ko. Jordan & Ogren (1984) studied the CO2
speci-ficity factor τ = KcVomax/(KoVcmax) of Rubisco purified from
spinach and obtained (equation derived by Harley et al. 1992):
(14) Brooks & Farquhar (1985) estimated the CO2
compensa-tion point of spinach in vivo using a gas-exchange technique and obtained the following relation, valid over the range 15–30°C:
(15) They report that this relationship closely resembles that obtained by Jordan & Ogren (1984).
We explored the significance of the differences between these alternative formulations when fitting the parameters Jmax and Vcmax. We found that the parameter Jmax was only
very slightly sensitive to the formulation of either Km or Γ*
(not shown). However, the parameter Vcmax was highly
sen-sitive to the formulation of Km chosen (Fig. 1c). The ratio of
Jmax: Vcmax was thus also highly sensitive to Km (Fig. 1d). This
sensitivity is the reason why we considered it necessary to
K T RT c k k = ◊ ( - ) ( ) È ÎÍ ˘ ˚˙ 274 6 80 500 298 298 exp K T RT o k k = ◊ ( - ) ( ) È ÎÍ ˘ ˚˙ 419 8 14 500 298 298 exp G *= ◊ exp ( - ) ( ) È ÎÍ ˘ ˚˙ 42 75 37 830 298 298 T RT k k G * = ( ) K V O V c omax i o cmax 2K t = ◊ -
(
-)
( ) È ÎÍ ˘ ˚˙ 2 321 29 000 298 298 exp T RT k k G * =42 7 1 68◊ + ◊(
Tk-298)
+ ◊0 0012(
Tk-298)
2use a consistent method to derive all parameters in a con-sistent fashion from original A–Ci curves before comparing
the temperature responses.
In the current work, we chose to use the temperature functions obtained by Bernacchi et al. (2001), because these functions were measured in vivo, without disturbance of the leaf, and are hence more likely to reflect accurately activity within the leaf. When using the temperature depen-dences of Jmax and Vcmax presented below, it is important to
also use the Bernacchi et al. (2001) temperature depen-dences for Kc, Ko and Γ*, because of the sensitivity of the
model to these functions illustrated in Fig. 1.
T-dependence of J
maxand V
cmaxOn reviewing the literature, it is daunting to observe the number of alternative functions that have been used to model the temperature dependences of Jmax and Vcmax
(com-pare, for example, Harley et al. 1986; Long 1991; Harley et al. 1992; Harley & Baldocchi 1995; Lloyd et al. 1995). How-ever, all these equations are actually just alternative expres-sions of two basic functions. The first is the Arrhenius function:
(16) which has parameters k25 (the value at 25°C) and Ea (the
exponential rate of rise of the function). The second is a peaked function (Johnson, Eyring & Williams 1942), which is essentially the Arrhenius equation (Eqn 16) modified by a term that describes how conformational changes in the enzyme at higher temperatures start to negate the on-going benefits that would otherwise come from further increasing temperature. This equation can be written in two equivalent forms: (17) (18) f T k E T RT k a k k ( ) =
(
-)
( ) È ÎÍ ˘ ˚˙ 25 298 298 exp f T k E T RT S H R T S H T R k a k k d k d k ( ) =(
-)
( ) È ÎÍ ˘ ˚˙ + Ê -Ë ˆ¯ + ÊË - ˆ¯ 25 298 298 1 298 298 1 exp exp exp D D or k opt d a k opt k opt d a d k opt k opt f T k H H T T T RT H H H T T T RT ( ) = -( ) Ê Ë Á ˆ¯˜ - - Ê ( - ) Ë Á ˆ¯˜ Ê Ë Á ˆ¯˜ exp exp 1Figure 1. (a) Alternative forms for the response of Km= Kc(1+ Oi/Ko) to leaf temperature. (b) Alternative forms for the response of Γ* to
leaf temperature. (c) Response of Vcmax to leaf temperature obtained by fitting a sample data set using alternative forms for Km. (d) Response of ratio Jmax: Vcmax to leaf temperature obtained by fitting a sample data set using alternative forms for Km. Key: Solid line: data from Badger & Collatz (1977). Dotted line: data from Jordan & Ogren (1984). Dashed line: data from Bernacchi et al. (2001).
1172 B. E. Medlyn et al.
The first form has parameters k25, Ha, Hd and DS, whereas
the second form has parameters kopt, Ha, Hd and Topt. Ha and
Hd are the same between the two forms, whereas DS and
Topt are related by:
(19)
The parameters can be interpreted as follows: k25 and kopt
are the values of Jmax or Vcmax at temperatures 25°C and
Topt, respectively; Ha gives the rate of exponential increase
of the function below the optimum (and is analogous to parameter Ea in the Arrhenius function); Hd describes the
rate of decrease of the function above the optimum; and Topt is the optimum temperature. DS is known as an entropy
factor but is not readily interpreted.
Model fitting
The first step in fitting the model was to obtain a value of Jmax and Vcmax for each individual A–Ci curve. This step
was carried out by fitting Eqns 1, 2, 3 and 4 to each curve using the non-linear regression routine with Gaussian algorithm in SAS (SAS Institute Inc., Cary, NC, USA). The parameter Rd was also fitted but was not used further,
because this parameter was found to be poorly estimated by the model.
Temperature response parameters were then obtained by fitting Eqns 16, 17 and 18 to response curves of Jmax and Vcmax
to leaf temperature, using SigmaPlot (SPSS Inc. Chicago, IL, USA). It was assumed that Jmax and Vcmax at a given
tem-perature could vary between leaves (according to factors such as leaf nitrogen per unit area) but that relative tem-perature responses of the parameters would be constant. This assumption was incorporated in the model by intro-ducing dummy variables li to represent each leaf and putting:
(20) in Eqns 16, 17 and 18 (Kleinbaum et al. 1998). Here, li= 1 for
leaf i and 0 otherwise, and ki is the value of k25 or kopt for
leaf i. Reported values of the parameters k25 and kopt are
mean and standard deviation of values of ki.
The Arrhenius model is a subset of the peaked model (compare Eqns 16 and 17). Therefore, an F-test was used to determine whether the peaked model gave a significantly better fit to data than the Arrhenius model (Kleinbaum et al. 1998). As others have found, the four-parameter peaked model was often over-parameterized, i.e. there was insuffi-cient data to determine all parameters (Harley et al. 1992; Dreyer et al. 2001). Hence, this model was also fitted under the assumption that Hd= 200 kJ mol−1, and an F-test used to
determine whether Hd was significantly different from this
value.
Implied temperature response of photosynthesis
We wanted to identify the implications for photosynthesis of differences in the temperature responses of model
T H S R H H H opt d a d a =
-(
)
È ÎÍ ˘ ˚˙ D ln k=Â
il ki iparameters. To do so, Eqns 1, 2, 3 and 4 were used to cal-culate a typical temperature response of net photosynthesis from the derived parameter values. This calculation was made by assuming standard ambient environmental condi-tions for light-saturated photosynthesis: an atmospheric [CO2] concentration of 350µmol mol−1, a constant Ci: Ca
ratio of 0·7, and a value for J of 0·9Jmax. Leaf respiration was
modelled for all species using a base rate of 0·01 Vcmax and
a Q10 of 2.
RESULTS
Temperature response of V
cmaxFitted parameters of the temperature response of Vcmax are
given in Table 2. In most cases, the peaked function (Eqn 17) with Hd fixed at 200 kJ mol−1 gave a significantly better
fit to the data than the Arrhenius function (Eqn 16). In no case, however, did relaxing the constraint on Hd
signifi-cantly improve the fit to the data. Species for which no peak in the temperature response of Vcmax was discernible
were Fraxinus excelsior, Prunus persica, Pinus taeda and Pinus radiata. Note, however, that measurements on P. radiata did not go above 30°C (Table 1), and that peak val-ues close to 40°C (maximal measurement temperature) are statistically difficult to estimate (e.g. for F. excelsior); in all cases a peak may well occur above the highest measure-ment temperature.
Values of k25, the maximum rate of Rubisco activity at
25°C, varied across data sets by a factor of three. Some of this variation is probably caused by variations in leaf nitro-gen content between data sets. Values were highest for crop species, but were comparable for coniferous and deciduous species. Note that all rates are expressed on a one-sided leaf area basis.
The activation energy Ha was generally in the range 60–
80 kJ mol−1, implying a similarity in the temperature
responses of Vcmax across data sets. Two data sets had values
of Ha slightly below this range (F. excelsior and fertilized P.
radiata) whereas another two had values of Ha
consider-ably above this range (Gossypium hirsutum and Juglans regia).
The optimum temperature for Vcmax, Topt, was
undeter-mined for those experiments where the peaked function was not a significantly better fit than the Arrhenius func-tion. Among the other experiments, Topt was generally in
the range 35–41°C, with no clear pattern in the variation, with two exceptions. Betula pendula and Pinus sylvestris, grown in Finland, experienced the lowest growing temper-atures and showed significantly lower values of Topt (27–
29°C).
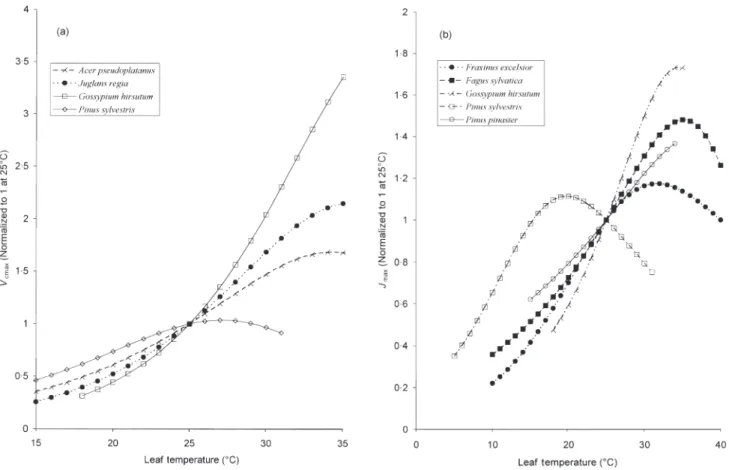
The variability in the temperature response of Vcmax is
illustrated in Fig. 2a, which shows the temperature responses normalized to 1 at 25°C. Most of the tempera-ture responses lie between the two curves shown for Juglans regia and Acer pseudoplatanus. The exceptions are cotton, Gossypium hirsutum, which has a much steeper Vcmax–T response owing to its high value of Ha, and the
Ta
b
le
2
.
Parameters of the temperature response of
Vcmax Species Arrhenius model Peaked model k25 ( µ mol m − 2s − 1) Ea ( kJ mol − 1) r 2 k25 ( µ mol m − 2s − 1) kopt ( µ mol m − 2s − 1) Ha ( kJ mol − 1) Hd ( kJ mol − 1) Topt ( °C) r 2 P
Crops Glycine max
97·76 (9·15) 54·08 (3·86) 0·87 93·89 (8·34) 277·50 (24·66) 69·50 (24·37) 200·00 41·89 (9·92) 0·88 0·05 Gossypium hirsutum 91·48 93·59 (4·50) 1·00 90·22 399·26 116·38 200·00 40·60 1·00
Deciduous trees Acer pseudoplatanus
72·96 (8·66) 33·92 (7·19) 0·66 78·16 (11·01) 136·28 (19·20) 75·88 (23·93) 200·00 34·95 (1·21) 0·86 0·00 Betula pendula O T C 85·07 (3·65) 37·19 (4·98) 0·87 101·90 (3·85) 114·82 (4·34) 63·75 (11·44) 200·00 29·28 (0·59) 0·97 0·00 Betula pendula GH 68·85 (14·19) 50·60 (3·86) 0·94 69·09 (14·72) 177·31 (37·78) 77·02 (18·76) 200·00 39·20 (3·76) 0·97 0·00 F agus sylvatica GH 60·95 (5·48) 41·38 (4·31) 0·89 63·83 (5·17) 133·13 (10·78) 72·36 (15·34) 200·00 37·36 (0·87) 0·97 0·00 F agus sylvatica ME 27·21 (3·41) 46·81 (3·53) 0·92 27·51 (2·93) 49·25 (5·24) 65·40 (19·48) 200·00 36·16 (3·63) 0·95 0·00 F raxinus excelsior 77·97 (9·65) 50·61 (3·60) 0·93 78·43 (9·60) 235·89 (28·88) 54·58 (13·11) 200·00 45·52 (36·87) 0·93 0·47 Juglans regia 62·10 (10·24) 43·98 (6·21) 0·83 63·98 (10·62) 146·39 (24·30) 104·58 (23·56) 200·00 36·05 (0·45) 0·97 0·00 Prunus persica 65·50 (3·88) 73·74 (3·28) 0·99 66·16 (3·91) 464·59 (27·49) 75·14 (23·38) 200·00 50·86 (396·99) 0·99 1·00 Quercus petraea 79·50 (8·55) 56·28 (2·79) 0·98 79·11 (8·10) 244·53 (25·04) 67·72 (9·40) 200·00 42·77 (6·96) 0·99 0·01 Quercus robur GH 89·99 (11·98) 55·50 (3·45) 0·96 89·71 (11·92) 295·01 (39·19) 61·77 (13·57) 200·00 44·87 (25·44) 0·96 0·26 Quercus robur ME 40·83 (12·28) 46·26 (3·11) 0·97 42·32 (13·42) 84·97 (26·94) 57·59 (12·22) 200·00 38·76 (10·69) 0·97 0·06
Evergreen trees Abies alba
41·64 (5·15) 35·16 (3·97) 0·86 43·50 (5·33) 78·11 (9·56) 60·02 (9·88) 200·00 36·81 (0·65) 0·95 0·00 Eucalyptus paucifl ora 87·73 51·56 (2·09) 0·99 90·42 175·81 60·79 (4·93) 200·00 37·83 (3·54) 1·00 Pinus pinaster 89·98 (5·01) 62·22 (2·76) 0·99 92·42 (4·65) 213·30 (10·77) 74·16 (11·17) 200·00 38·34 (7·36) 0·99 0·01 Pinus radiata fert. 97·01 (4·46) 49·07 (3·73) 0·96 99·15 (4·71) 174·33 (8·33) 51·32 (19·21) 200·00 37·74 (152·04) 0·96 0·77 Pinus radiata unfert. 83·57 (17·5) 61·31 (3·71) 0·98 85·86 (17·7) 171·59 (35·81) 64·78 (21·32) 200·00 37·68 (125·99) 0·98 0·69 Pinus sylvestris 53·99 (7·22) 35·53 (5·93) 0·81 67·33 (9·72) 70·75 (10·21) 69·83 (12·56) 200·00 27·56 (0·61) 0·96 0·00 Pinus taeda 57·05 (9·33) 60·88 (3·68) 0·98 57·66 (9·43) 340·45 (55·63) 61·21 (304·11) 200·00 53·30 (47033) 0·98 1·00 V alues of k25 and kopt
are expressed on a one-sided leaf area basis
. Standard deviations of
k25
and
kopt
, and standard errors of other parameters
, are given in parentheses
.
P
, probability that
the peaked model is not a signifi
cantly better fit to the data than the
Arrhenius model.
O
T
C
, open top chamber experiment;
GH,
gr
eenhouse experiment;
ME,
1174 B. E. Medlyn et al.
Finnish plants, B. pendula and P. sylvestris, which have a much lower optimal temperature for Vcmax.
Temperature response of J
maxThe peaked function (Eqn 17) described the temperature response of Jmax significantly better than the Arrhenius
function (Eqn 16) for all experiments other than P. radiata and P. taeda. Parameters for the peaked function are given in Table 3.
Values of the activation energy Ha were in general
high-est for crop species (80–90 kJ mol−1), intermediate for
deciduous species (40–60 kJ mol−1) and lowest for conifer-ous species (30–40 kJ mol−1). The major exceptions to this pattern were again the cold-climate trees from Finland, B. pendula and P. sylvestris, which both had high values of Ha,
and F. excelsior. Values of Hd were significantly less than
200 kJ mol−1 for these three species and for soybean. The optimal temperature for Jmax is generally in the
range 30–38°C, with no clear pattern among species, with the exception again of the Finnish plants. Betula pendula and P. sylvestris had much lower optimal temperatures for Jmax of about 20°C.
The variability in the temperature response of Jmax is
illustrated in Fig. 2b. The two Finnish species have similar responses, with low optimal temperatures. The other coni-fers have responses resembling that of P. pinaster, with a
relatively low slope owing to low values of Ha. Deciduous
tree responses generally lie between those of F. excelsior and F. sylvatica. Crop species responses are steeper again, as illustrated by the G. hirsutum response.
Ratio of J
max: V
cmaxFigure 3 shows the relationship between values of Jmax and
Vcmax at 25°C. Most of the data points fall close to a straight
line with a slope of 1·67. The major exceptions to this pat-tern are soybean, with a ratio of 2·4, and the two Finnish plants, which both have ratios of about 1. For each experi-ment, a linear function was fitted to the relationship between the Jmax: Vcmax ratio and leaf temperature. There
was a significant negative slope in all cases, ranging from − 0·045 to −0·08, highlighting the difference in activation energies for Jmax and Vcmax.
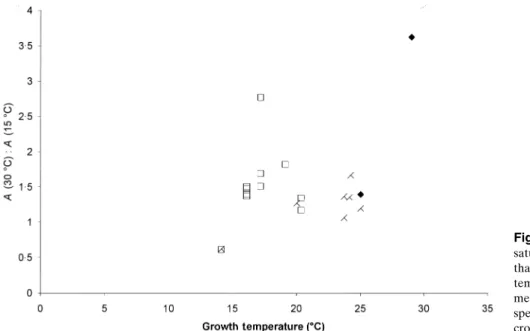
Implications for the temperature response of
light-saturated photosynthesis
The temperature response of photosynthesis was modelled for each data set, under the assumption of a constant Ci: Ca
ratio. From the resulting curves, the optimal temperature for photosynthesis and its rate of increase over the range 15–30°C were calculated, and these are plotted in Figs 4 and 5 against growth temperature. Figure 4 illustrates that
for the majority of broadleaf and coniferous trees, the opti-mal temperature for photosynthesis varies between 23 and 30°C and is largely unrelated to growth temperature. How-ever, the trees grown in cold conditions in Finland had considerably lower optimal temperatures. The optimal tem-peratures for the two crop species, which were grown in warm conditions, were comparable to the highest optimal temperatures obtained for the tree species. The rate of
increase of photosynthesis between 15 and 30°C was also similar for most plants in the survey, ranging from 1·2 to 1·6 (Fig. 5). The exceptions were the Finnish trees, again, for which photosynthesis actually decreased over this temper-ature range, and walnut (J. regia) and cotton (G. hirsutum), which had particularly high rates of increase. From Figs 4 and 5 we can identify three broad classes of implied photo-synthetic temperature response (Fig. 6). Most plants had
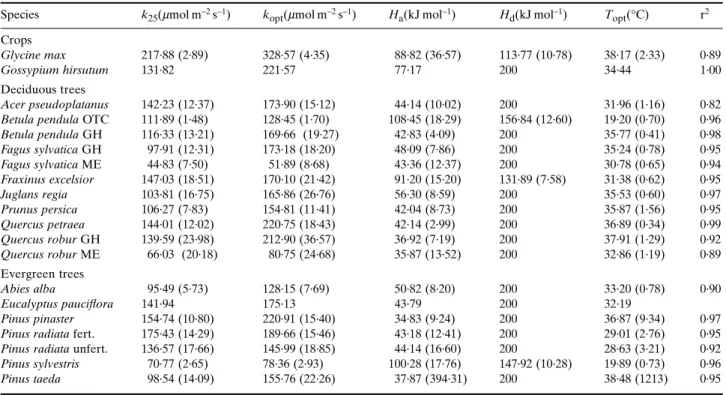
Table 3. Parameters of the temperature response of Jmax
Species k25(µmol m−2s−1) kopt(µmol m−2s−1) Ha(kJ mol−1) Hd(kJ mol−1) Topt(°C) r2
Crops
Glycine max 217·88 (2·89) 328·57 (4·35) 88·82 (36·57) 113·77 (10·78) 38·17 (2·33) 0·89
Gossypium hirsutum 131·82 221·57 77·17 200 34·44 1·00
Deciduous trees
Acer pseudoplatanus 142·23 (12·37) 173·90 (15·12) 44·14 (10·02) 200 31·96 (1·16) 0·82
Betula pendula OTC 111·89 (1·48) 128·45 (1·70) 108·45 (18·29) 156·84 (12·60) 19·20 (0·70) 0·96
Betula pendula GH 116·33 (13·21) 169·66 (19·27) 42·83 (4·09) 200 35·77 (0·41) 0·98 Fagus sylvatica GH 97·91 (12·31) 173·18 (18·20) 48·09 (7·86) 200 35·24 (0·78) 0·95 Fagus sylvatica ME 44·83 (7·50) 51·89 (8·68) 43·36 (12·37) 200 30·78 (0·65) 0·94 Fraxinus excelsior 147·03 (18·51) 170·10 (21·42) 91·20 (15·20) 131·89 (7·58) 31·38 (0·62) 0·95 Juglans regia 103·81 (16·75) 165·86 (26·76) 56·30 (8·59) 200 35·53 (0·60) 0·97 Prunus persica 106·27 (7·83) 154·81 (11·41) 42·04 (8·73) 200 35·87 (1·56) 0·95 Quercus petraea 144·01 (12·02) 220·75 (18·43) 42·14 (2·99) 200 36·89 (0·34) 0·99 Quercus robur GH 139·59 (23·98) 212·90 (36·57) 36·92 (7·19) 200 37·91 (1·29) 0·92 Quercus robur ME 66·03 (20·18) 80·75 (24·68) 35·87 (13·52) 200 32·86 (1·19) 0·89 Evergreen trees Abies alba 95·49 (5·73) 128·15 (7·69) 50·82 (8·20) 200 33·20 (0·78) 0·90 Eucalyptus pauciflora 141·94 175·13 43·79 200 32·19 Pinus pinaster 154·74 (10·80) 220·91 (15·40) 34·83 (9·24) 200 36·87 (9·34) 0·97
Pinus radiata fert. 175·43 (14·29) 189·66 (15·46) 43·18 (12·41) 200 29·01 (2·76) 0·95
Pinus radiata unfert. 136·57 (17·66) 145·99 (18·85) 44·14 (16·60) 200 28·63 (3·21) 0·92
Pinus sylvestris 70·77 (2·65) 78·36 (2·93) 100·28 (17·76) 147·92 (10·28) 19·89 (0·73) 0·96
Pinus taeda 98·54 (14·09) 155·76 (22·26) 37·87 (394·31) 200 38·48 (1213) 0·95
Values of k25 and kopt are expressed on a one-sided leaf area basis. Standard deviations of k25 and kopt, and standard errors of other parameters, are given in parentheses. OTC, open top chamber experiment; GH, greenhouse experiment; ME, mini-ecosystem experiment.
Figure 3. Relationship
between Jmax and Vcmax at
25°C. Filled symbols: crop species; open symbols: broadleaf species; crosses: coniferous species. Fitted regression line has slope of 1·67.
1176 B. E. Medlyn et al.
fairly similar responses, falling between those of A. pseudo-platanus and Q. petraea. The two Finnish trees, B. pendula and P. sylvestris, had distinctly different responses, with much lower optimal temperatures. Finally, cotton (and to a lesser extent J. regia) differed in having a much steeper response curve.
DISCUSSION
The aim of this review was to investigate variability in the temperature responses of the model parameters Jmax and
Vcmax, with a view to improving parameter choice when
modelling photosynthetic processes. The major factors thought to affect these responses are growth temperature
and genotype or species (Berry & Björkman 1980). It has also been suggested that nutrition (Martindale & Leegood 1997) and light availability (Niinemets et al. 1999) may play a role.
We found that the temperature responses of Jmax and
Vcmax obtained in gas exchange experiments were quite
sim-ilar across many of the species included in the review (Tables 2 and 3), a promising finding as it potentially sim-plifies parameter choice. Parameter values obtained by alternative means (in vitro, chlorophyll fluorescence) are included for comparison in Table 4, and generally fall within the range of values reported in Tables 2 and 3. Responses of coniferous and broadleaf trees were broadly similar, with only a slight trend for lower Ha of Jmax in
coni-fers. However, the responses of the two crop species,
par-Figure 4. Modelled optimal
temperature of light-saturated net photosynthesis plotted against mean temperature in month prior to measurements. Filled symbols: crop species; open symbols: broadleaf species; crosses: coniferous species.
Figure 5. Modelled ratio of
light-saturated net photosynthesis at 30°C to that at 15°C, plotted against mean temperature in month prior to measurements. Filled symbols: crop species; open symbols: broadleaf species; crosses: coniferous species.
ticularly cotton, differed from tree species in several aspects including activation energies of both Jmax and Vcmax
and the ratio of Jmax: Vcmax at 25°C, suggesting that
alterna-tive parameter sets are required for modelling these two plant types. This result needs to be clarified by expansion of the database on herbaceous species and crops, however.
It is not possible to draw inferences about acclimation of photosynthesis to growing conditions from such a diverse set of studies, because several alternative explanations are possible for any observed differences, such as differences in experimental protocol or genotypic differences. Neverthe-less some interesting comparisons can be made which can serve as a preliminary basis for generalizations about tem-perature responses in different environments.
For example, we can compare studies on the same spe-cies growing in different environmental conditions. Both Fagus sylvatica and Quercus robur were the subject of two different studies, one with seedlings growing individually in
pots and one with seedlings growing densely in mini-eco-systems. Low foliar nitrogen in the mini-ecosystem studies led to low values of k25 for both Jmax and Vcmax. The relative
temperature response of Vcmax was unchanged, but Topt of
Jmax was lower in the mini-ecosystem experiment. This
result parallels that of Niinemets et al. (1999) who found that the temperature optimum of Jmax was positively
corre-lated with light availability and suggested that the correla-tion was a result of photosynthetic acclimacorrela-tion to microclimate.
There was generally a poor relationship between param-eter values and growth temperature, with the clear excep-tion of the lowest-temperature-grown plants, B. pendula and P. sylvestris, which had distinctly different temperature responses compared to plants of the same genus grown in temperate climates. The low-temperature-grown plants had low optimal temperatures for both Jmax and Vcmax, and low
Jmax: Vcmax ratios. Although not completely comparable, a
Figure 6. Sample responses of
modelled leaf photosynthesis to leaf temperature. Values are normalized to 1 at 25°C.
Parameter
values Material Authors
Vcmax Ea
58·52 Atriplex glabriscula,
purified Rubisco
Badger & Collatz (1977)1
65·33 transgenic Nicotiana tabacum Bernacchi et al. (2001)2
Jmax
Ha Hd Topt
65·01 179·2 33·7 Populus tremula, intact leaves Niinemets et al. (1999)3
54·97 325·5 40·3 Tilia cordata, intact leaves Niinemets et al. (1999)3
37 220 31 barley chloroplasts Nolan & Smillie (1976)1 1in vitro; 2in vivo measurements with transgenic low-Rubisco plants; 3chlorophyll
fluorescence.
Table 4. Comparable parameter values
1178 B. E. Medlyn et al.
study on alpine grasses growing in low temperature envi-ronments (Wohlfahrt et al. 1999) does not show such dra-matic differences in the temperature optima of Jmax and
Vcmax. Further research is required to clearly establish the
effects of growth in a cold climate on the temperature responses of Jmax and Vcmax. No data were available for
trop-ical species; it would be interesting to see how optimal tem-peratures for such species compare with those reported here.
Another key requirement for future research high-lighted by this study is the need for more information on the temperature dependence of Kc and Ko, the Michaelis–
Menten coefficients for Rubisco activity. We have illus-trated the fact that values of Vcmax derived from gas
exchange data depend strongly on the assumed values of Kc
and Ko and hence are not readily comparable between
stud-ies. In the absence of a clear resolution of the temperature dependence of these parameters, it is important, particu-larly when modelling, to ensure that parameter sets are consistent (Medlyn et al. 1999).
It should be noted that photosynthetic rates are deter-mined not only by biochemical processes, but also by sto-matal conductance to CO2. In this study we have omitted to
consider the effects on photosynthesis of possible acclima-tion of stomatal conductance to temperature. (Figs 4–6 were constructed assuming a constant Ci: Ca ratio.) In the
companion paper (Medlyn, Loustau & Delzon 2002), we showed that changes in stomatal conductance could con-tribute considerably to photosynthetic temperature accli-mation. A similar result was found by Ferrar, Slatyer & Vranjic (1989) for Eucalyptus species and Ellsworth (2000) for Pinus taeda. Berry & Björkman (1980) suggested sto-matal acclimation to temperature was uncommon but also noted that information on this topic was scarce. Even with-out acclimation, photosynthetic rates at ambient CO2
con-centration at optimum temperature, and the temperature of optimum photosynthesis itself, can be strongly affected by stomatal responses to temperature and water vapour pres-sure deficits (Kirschbaum & Farquhar 1984). Hence, even with identical photosynthetic parameters, leaves can have different photosynthetic rates under ambient conditions due to different stomatal conductances caused by internal (e.g. water stress) or external (e.g. water vapour pressure deficits) factors. It has also been suggested that changes in the temperature response of cell-wall conductance may be a factor in temperature acclimation (Makino et al. 1994). We were unable to evaluate this possibility owing to lack of data.
CONCLUSION
The primary aim of this review of the temperature responses of model parameters Jmax and Vcmax was to
high-light variability in these responses among species and growth environments in order to improve parameter choice when modelling temperature effects on photosynthesis and growth. In general, it was found that parameters for crop
species, temperate trees, and boreal trees, fell into three dis-tinct groups (see Tables 2 and 3), suggesting that modellers should use a set of parameters from the appropriate group. The limited data analysed here also revealed differences in photosynthetic temperature response parameters among growth environments, suggesting that equations should be chosen, where possible, to be appropriate for given radia-tion and temperature condiradia-tions. However, to better model temperature responses, a greater understanding of the functional significance of differences among broad plant types and growth environments is needed, which will require more careful experimental comparisons of within-versus among-species variation in temperature response parameters.
ACKNOWLEDGMENTS
B.M. acknowledges financial support from the French Insti-tut National de la Recherche Agronomique and the Aus-tralian Research Council. D.E. was supported by funds from the US Department of Energy, Office of Biological and Environmental Research under the Forest-Atmo-sphere Carbon Transfer and Storage (FACTS) project. We thank Georg Wohlfahrt for helpful discussion and Michael Battaglia for insightful comments on the manuscript.
REFERENCES
Armond P.A., Schreiber U. & Björkman O. (1978) Photosynthetic acclimation to temperature in the desert shrub, Larrea
divari-cata. II. Light-harvesting efficiency and electron transport. Plant Physiology 61, 411–415.
Badger M.R. & Andrews T.J. (1974) Effects of CO2, O2 and
tem-perature on a high-affinity form of ribulose diphosphate carbox-ylase-oxygenase from spinach. Biochemical and Biophysical
Research Communications 60, 204–210.
Badger M.R. & Collatz G.J. (1977) Studies on the kinetic mecha-nism of ribulose-1,5-bisphosphate carboxylase and oxygenase reactions, with particular reference to the effect of temperature on kinetic parameters. Carnegie Institute of Washington
Year-book 76, 355–361.
Bernacchi C.J., Singsaas E.L., Pimentel C., Portis A.R. Jr & Long S.P. (2001) Improved temperature response functions for mod-els of Rubisco-limited photosynthesis. Plant, Cell and
Environ-ment 24, 253–260.
Berry J. & Björkman O. (1980) Photosynthetic response and adap-tation to temperature in higher plants. Annual Review of Plant
Physiology 31, 491–543.
Brooks A. & Farquhar G.D. (1985) Effect of temperature on the CO2/O2 specificity of ribulose-1,5-bisphosphate carboxylase/
oxygenase and the rate of respiration in the light: estimates from gas-exchange experiments on spinach. Planta 165, 397–406. Cramer W., Bondeau A., Woodward F.I., et al. (2001) Global
response of terrestrial ecosystem structure and function to CO2
and climate change: results from six dynamic global vegetation models. Global Change Biology 7, 357–373.
Dreyer E., Le Roux X., Montpied P., Daudet F.A. & Masson F. (2001) Temperature response of leaf photosynthetic capacity in
seedlings from seven temperate forest tree species. Tree
Physi-ology 21, 223–232.
Ellsworth D.S. (2000) Seasonal CO2 assimilation and stomatal
lim-itations in a Pinus taeda canopy. Tree Physiology 20, 435–445. Farquhar G.D., von Caemmerer S. & Berry J.A. (1980) A
bio-chemical model of photosynthetic CO2 assimilation on leaves of
C3 species. Planta 149, 78–90.
Ferrar P.J., Slatyer R.O. & Vranjic J.A. (1989) Photosynthetic tem-perature acclimation in Eucalyptus species from diverse habi-tats, and a comparison with Nerium oleander. Australian Journal
of Plant Physiology 16, 199–217.
Harley P.C. & Baldocchi D.D. (1995) Scaling carbon dioxide and water vapour exchange from leaf to canopy in a deciduous for-est. I. Leaf model parameterization. Plant, Cell and
Environ-ment 18, 1146–1156.
Harley P.C., Tenhunen J.D. & Lange O.L. (1986) Use of an ana-lytical model to study limitation on net photosynthesis in
Arbu-tus unedo under field conditions. Oecologia 70, 393–401.
Harley P.C., Thomas R.B., Reynolds J.F. & Strain B.R. (1992) Modelling photosynthesis of cotton grown in elevated CO2.
Plant, Cell and Environment 15, 271–282.
Harley P.C., Weber J.A. & Gates D.M. (1985) Interactive effects of light, leaf temperature, CO2 and O2 on photosynthesis in
soy-bean. Planta 165, 249–263.
Havaux M. (1993) Rapid photosynthetic adaptation to heat stress triggered in potato leaves by moderately elevated temperatures.
Plant, Cell and Environment 16, 461–467.
Hikosaka K., Murakami A. & Hirose T. (1999) Balancing carbox-ylation and regeneration of ribulose-1,5-bisphosphate in leaf photosynthesis: temperature acclimation of an evergreen tree,
Quercus myrsinaefolia. Plant, Cell and Environment 22, 841–
849.
Johnson F., Eyring H. & Williams R. (1942) The nature of enzyme inhibitions in bacterial luminescence: sulphanilamide, urethane, temperature, pressure. Journal of Cell Comparative Physiology
20, 247–268.
Jordan D.B. & Ogren W.L. (1984) The CO2/O2 specficity of
ribu-lose-1,5-bisphosphate carboxylase/oxygenase: dependence on ribulose bisphosphate concentration, pH and temperature.
Planta 161, 308–313.
Kirschbaum M.U.F. & Farquhar G.D. (1984) Temperature depen-dence of whole-leaf photosynthesis in Eucalyptus pauciflora Sieb. ex Spreng. Australian Journal of Plant Physiology 11, 519– 538.
Kleinbaum D.G., Kupper L.L., Muller K.E. & Nizam A. (1998)
Applied Regression Analysis and Other Multivariable Methods.
Duxbury Press, Pacific Grove, CA, USA.
Leuning R. (1997) Scaling to a common temperature improves the correlation between the photosynthesis parameters Jmax and
Vcmax. Journal of Experimental Botany 48, 345–347.
Lloyd J., Grace J., Miranda A.C., Meir P., Wong S.C., Miranda H.S., Wright I.R., Gash J.H.C. & McIntyre J. (1995) A simple calibrated model of Amazon rainforest productivity based on leaf biochemical properties. Plant, Cell and Environment 18, 1129–1145.
Long S.P. (1991) Modification of the response of photosynthetic productivity to rising temperature by atmospheric CO2
concen-trations: has its importance been underestimated? Plant, Cell
and Environment 14, 729–739.
Long S.P., Postl W.F. & Bolharnordenkampf H.R. (1993) Quan-tum yields for uptake of carbon dioxide in C3 vascular plants of
contrasting habitats and taxonomic groupings. Planta 189, 226– 234.
Makino A., Nakano H. & Mae T. (1994) Effects of growth tem-perature on the responses of ribulose-1,5-bisphosphate carbox-ylase, electron transport components, and sucrose synthesis enzymes to leaf nitrogen in rice, and their relationships to pho-tosynthesis. Plant Physiology 105, 1231–1238.
Martindale W. & Leegood R.C. (1997) Acclimation of photosyn-thesis to low temperature in Spinacia oleracea L. II. Effects of nitrogen supply. Journal of Experimental Botany 48, 1873–1880. Medlyn B.E., Badeck F.-W., de Pury D.G.G., et al. (1999) Effects of elevated [CO2] on photosynthesis in European forest species:
a meta-analysis of model parameters. Plant, Cell and
Environ-ment 22, 1475–1495.
Medlyn B.E., Loustau D. & Delzon S. (2002) Temperature response of parameters of a biochemically-based model of photosynthesis. I. Seasonal changes in mature maritime pine (Pinus pinaster Ait.). Plant, Cell and Environment 25, 1155– 1165.
Niinemets U., Oja V. & Kull O. (1999) Shape of leaf photosyn-thetic electron transport versus temperature response curve is not constant along canopy light gradients in temperate decidu-ous trees. Plant, Cell and Environment 22, 1497–1513.
Nolan W.G. & Smillie R.M. (1976) Multi temperature effects on Hill reaction activity of barley chloroplasts. Biochimica
Bio-physica Acta 440, 461–475.
Robakowski P., Montpied P. & Dreyer E. (2002) Temperature response of photosynthesis of silver fir (Abies alba Mill.) seed-lings. Annals of Forest Science 59, 159–166.
Slatyer R.O. & Morrow P.A. (1977) Altitudinal variation in the photosynthetic characteristics of snow gum Eucalyptus
pauci-flora Sieb. ex Spreng. I. Seasonal changes under field conditions
in the Snowy Mountains area of South-eastern Australia.
Aus-tralian Journal of Botany 25, 1–20.
Strassemeyer J. & Forstreuter M. (1997) Parameterization of a leaf gas-exchange model for Fagus sylvatica L. using microcosms grown under ambient and elevated CO2.
Landschaftsentwick-lung and Umweltforschung 107, 61–72.
Walcroft A.S., Le Roux X., Diaz-Espejo A. & Sinoquet H. (2002) Spatial and temporal variability of photosynthetic capacity within a peach tree crown. Tree Physiology in press.
Walcroft A.S., Whitehead D., Silvester W.B. & Kelliher F.M. (1997) The response of photosynthetic model parameters to temperature and nitrogen concentration in Pinus radiata D. Don. Plant, Cell and Environment 20, 1338–1348.
Wang K.-Y., Kellomaki S. & Laitinen K. (1996) Acclimation of photosynthetic parameters in Scots pine after three years expo-sure to elevated temperature and CO2. Agricultural and Forest
Meteorology 82, 195–217.
Wohlfahrt G., Bahn M., Haubner E., Horak I., Michaeler W., Rott-mar K., Tappeiner U. & Cernusca A. (1999) Inter-specific vari-ation of the biochemical limitvari-ation to photosynthesis and related leaf traits of 30 species from mountain grassland ecosystems under different land use. Plant, Cell and Environment 22, 1281– 1296.
Wullschleger (1993) Biochemical limitations to carbon assimilation in C3 plants – a retrospective analysis of A/Ci curves from 109
species. Journal of Experimental Botany 44, 907–920.
Received 8 November 2001; received in revised form 28 March 2002; accepted for publication 2 April 2002