HAL Id: hal-02754084
https://hal.inrae.fr/hal-02754084
Submitted on 3 Jun 2020
HAL is a multi-disciplinary open access
archive for the deposit and dissemination of
sci-entific research documents, whether they are
pub-lished or not. The documents may come from
teaching and research institutions in France or
abroad, or from public or private research centers.
L’archive ouverte pluridisciplinaire HAL, est
destinée au dépôt et à la diffusion de documents
scientifiques de niveau recherche, publiés ou non,
émanant des établissements d’enseignement et de
recherche français ou étrangers, des laboratoires
publics ou privés.
Modelling directional anisotropy of thermal infrared
measurements over a Pine forest canopy
Britta Kurz, Jean-Pierre Lagouarde, Patrick Moreau, Dominique Guyon,
Isabelle Champion, Jérôme Ogée, Frédéric Boudon, Yves Caraglio, Christophe
Godin, Christophe Pradal
To cite this version:
Britta Kurz, Jean-Pierre Lagouarde, Patrick Moreau, Dominique Guyon, Isabelle Champion, et al..
Modelling directional anisotropy of thermal infrared measurements over a Pine forest canopy. 2.
International Symposium on Recent Advances in Quantitative Remote Sensing (RAQRS’II), Sep 2006,
Torrent, Spain. �hal-02754084�
2
ndInternational Symposium ‘Recent Advances in Quantitative Remote Sensing’,
Torrent / Valencia, Espagne, 25-29 septembre 2006
Modeling directional anisotropy of thermal infrared measurements over
a pine forest canopy
Britta Kurz
(1), Jean-Pierre Lagouarde
(1), Patrick Moreau
(1), Dominique Guyon
(1), Isabelle
Champion
(1), Jérôme Ogée
(1), Frederic Boudon
(2), Yves Caraglio
(2), Christophe Godin
(2),
Christophe Pradal
(2)(1)
INRA - EPHYSE, BP 81, 33883 Villenave d’Ornon, France
(2)
CIRAD-INRIA-INRA,UMR AMAP, Boulevard de la Lironde, F34398 Montpellier Cedex 5
Contact: [email protected]
ABSTRACT. Experimental airborne thermal infrared (TIR) measurements performed over a maritime pine
stand in the Landes forest in the southwest of France revealed important hot spot effects and directional anisotropy reaching up to ±2 K in summer conditions. The generalization of such results requires modelling efforts with the scope of different practical applications such as eventual angular correction of large swath satellite data, or assimilation of TIR data in forest growth models. The directional TIR anisotropy model is based on a 3D structural modelling of pine canopies combined with a ray tracing program (POV-ray). The images generated in a given viewing configuration are used to derive the percentages of sunlit and shadowed elements of the canopy; the resulting directional temperature is then computed by weighing their elementary temperatures. In a first step the 3D canopy model itself is validated against gap frequency measurements. The TIR anisotropy modelling approach is validated in a second step prescribing elementary temperatures from ground based measurements and comparing derived directional temperature against airborne data. Finally the coupling with a forest soil-vegetation model MuSICA developed at the laboratory providing the elementary temperatures at different levels inside the canopy and the possibilities opened for assimilating actual TIR satellite data are discussed.
1. INTRODUCTION
Measurements of surface temperature performed in the thermal infrared (TIR) domain display important directional anisotropy and significant ‘hot spot’ effects. These depend on the coupled energy-radiative transfers within the canopies which govern the energy budgets at the different layers inside the canopy and finally the spatial distribution of the temperatures of facets seen by a sensor situated above. The structure of the canopy obviously plays a major role, because it governs the penetration of both radiation and wind, and also because it governs the visibility of the facets of the canopy within the FOV of the sensor. Characterizing the TIR directional anisotropy is important for several purposes:
• access to the surface temperature of the different
canopy layers for improving sensible heat flux estimates
• assimilation of multi-angular remotely sensed
data in the surface models
• correction and normalization of large swath
satellite sensors with the scope of analyzing temporal or spatial variability
• definition of optimal viewing configurations and
recommendations for future TIR spatial systems. Several authors have been experimentally studying TIR directional anisotropy since the 1960s. A review can be found in Paw U (1992). Lagouarde et al. (2000) recently proposed a method based on the use of airborne measurements performed with a thermal camera equipped with wide angle lenses. These authors report characteristic ‘hot spot’ effects over maritime pine stands and illustrate the dependency with the solar position and the structure of stands. Similar experiments performed over urban areas by the same authors (Lagouarde et al., 2004) confirmed the importance of TIR directional anisotropy.
The generalization of experimental results requires models to be developed for practical applications purposes. Several approaches have been proposed. Kimes (1983) and Caselles et al. (1992) built simple geometrical models for row crops (cotton and orange orchards respectively). Kimes (1980) and Prevot et al. (1994) have developed multi-layers models for which resulting directional temperature are estimated from directional gap frequencies derived from leaf area index and leaf angle distribution profiles. All these approaches require temperature profiles within the
canopies to be known a priori. Prevot at al. (1994) proposed a method coupling the multi-layer model with a transfer model providing the surface temperature of elements within the canopy. More recently, approaches based on 3D models have been proposed. Luquet et al. (2003) for instance introduced a 3D model of cotton into a transfer model with the scope of improving the characterization of the water stress from TIR measurements. Guillevic et al. (2003) extended to TIR the DART model developped by Gastellu-Etchegorry et al. (1996).
This paper aims at assessing the potential of a 3D canopy model approach combined with a transfer model for simulating angular anisotropy over a complex maritime pine stand.
2. EXPERIMENTAL DATA
The experimental site is located in the Landes forest
in the southwest of France. It is a large (1.5*106 ha)
nearly pure maritime pine forest displaying a structure of a patchwork of large even-aged stands. Experiments were performed at Le Bray (44°43’N, 0°46’W), an INRA experimental site situated near Bordeaux. Le Bray is a large rectangular 350m x 500m stand, 26 years old, with a 17.6m mean height of trees (in 1996). The density is 518 trees per hectare. The mean spacing between trees is 4.7m. The LAI remains rather constant, about 3.1 in midsummer. The ground cover fraction is estimated to be about 70%. Moreover, it displays a row structure with 4m spacing and a 35° azimuth orientation.
Airborne measurements of surface temperature were performed using a TIR camera INFRAMETRICS
Model 760 (*) placed aboard a small aircraft (CESSNA
180). Details are given in Lagouarde et al. (2000). Measurement performed at two dates (August 17 and September 4, 1995) revealed important TIR directional anisotropy, with a ‘hot spot’ effect in tight relation with solar position. In what follows we focus on the results obtained for September 4 around 14:00 UT. The polar plot of the TIR directional anisotropy is given further (Fig.5).
Detailed measurements of the surface temperatures of sunlit and shadowed facets of the different elements of the canopy (understorey, needles, trunks) were also performed later (August 6 and 27, 1998) at ground level. For this purpose the same TIR camera was used from a tower installed on the site which gives access to the crowns of the trees.
(*)
Trade name and company are given for the benefit of the reader and do not imply any endorsement of the product or company by the authors.
3. MODELLING
3.1 The modelling approach
The approach is based on the use of POV-ray (http://www.povray.org, Persistence of Vision Raytracer), a ray tracing software which creates realistic images (possibly with reflections, shading, perspective…) from tridimensional information of the structure of the studied scene.
For a given sun position (solar azimuth and zenith angles) the images of the pine stand generated by POV-ray varying the observer position (solar azimuth and zenith viewing angles) are analysed to derive the six fractions of the elements present per scene (sunlit crowns, ground and trunks, and shadowed crowns, ground and trunks) (Table I). Directional surface temperatures of the stand can then be estimated by aggregation provided the six temperatures of the elements are known. These can either be directly obtained by measurements at ground level or simulated using a transfer (soil/plant/atmosphere) model.
crowns ground trunks
% sunlit A1,1 A1,2 A1,3
% shadowed A2,1 A2,2 A2,3
TABLE I: Fractions Ai,j of the elements present in
images of the pine stand generated by POV-ray. i is for shadowed or sunlit, j for crowns, ground or trunks.
Ai,j fractions depend on the azimuthal and zenithal
viewing angles θv, and ϕv.
The aggregation of the elementary temperatures for a given viewing direction obeys the conservation of the Stefan-Boltzmann law; the emissivity is assumed to be uniform and the resulting directional surface temperature is:
4 j , i j , i 4 V V j , i V V S( , ) (A ( , )T T θ ϕ =
∑
θ ϕfor i = 1, 2 (shadowed, sunlit), for j = 1, 2, 3 (crown, ground, trunk) 3.2 The 3D pine tree model
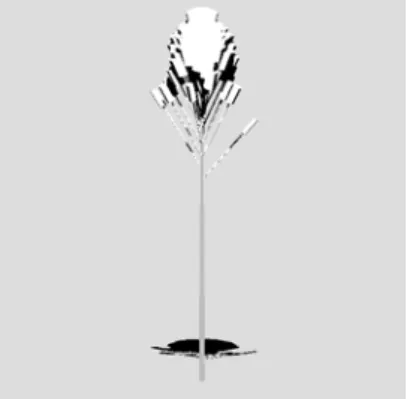
First modelling tests were performed using a very simple tree model. It consists of a trunk with branches of order one only. All higher order branches and shoots are assembled into one single cylinder. The length and diameter of the cylinders are the two parameters to be fit. The other parameters describing the structure of the tree (trunk height and diameter, crown height, number of branches and insertion angle with trunk…) have been determined by a detailed
statistical analysis of the structure of actual trees cut in the studied stand (Champion et al., 2001). Fig. 1 gives an example of image of the modelled tree created with POV-ray.
Figure. 1. 3D POV-ray simulation of a pine tree
3.3 The 3D stand model
The 3D model of the stand is created by assembling trees. The distance between rows is constant. A variability corresponding to the one observed in the stand has been introduced for the spacing of trees on a
Figure 2. Examples of scenes of Le Bray maritime
pine stand simulated with POV-ray for different positions of the observer in the solar principal plane.
row. All the trees have a similar shape, and we only adapted their size (by applying to all dimensions a ratio arbitrarily related to the spacing of trees) to simulate a competition effect and to obtain a more realistic representation of the heterogeneities found in the stand. The parameters of the view point are adapted (observer far enough and the very small field of view (FOV) of the camera) to simulate airborne or satellite observations of the stand (Fig.2).
The validation of the 3D canopy model of the stand has been done by comparing simulated gap frequency in the direction of the sun against measurements performed with a Daemon instrument. Measurements have been performed at different times, during 3 successive days, i.e. for different solar azimuth and zenith angles. The POV-ray simulations of the stand have been done in the same conditions. The fluctuations that are observed on the measured gap frequency curve can be explained by a row effect: in particular, the high values of gap frequency around 13:00 UT correspond to a solar azimuthal angle identical to the row orientation. Despite the attenuation of the row effect by the model, the general agreement is good (Fig. 3). 0 0.05 0.1 0.15 0.2 0.25 0.3 0.35 0.4 6 8 10 12 14 16 18 Time (UT) G a p fr equency Measured (Daemon) 3D modelled
Figure. 3. Comparison of gap frequency retrieved
from direct measurements (Daemon) and from POV-ray simulations.
3.4 The MuSICA model
MuSICA is a multi-layer, multi-leaf model
developed to study the energy, water and CO2
transfers within a pine canopy with a broadleaf understorey vegetation (Ogée et al. 2003). In each vegetation layer, the model distinguishes several types of leaves or needles according to their age (needles only), sun exposure (sunlit or shaded) and water status (wet or dry). At each level in the canopy, the model solves an energy budget for each leaf and therefore computes their surface temperatures. It also estimates litter and soil surface temperatures. The model runs at a half-hourly time step. Sunlit (resp. shaded) crown
temperature was estimated as the leaf-area-weighted mean temperature of all canopy sunlit (resp. shaded) needles and sunlit (resp. shaded) ground temperature was estimated as the leaf-area-weighted mean temperature of all sunlit (resp. shaded) understorey leaves. Litter or soil surface temperature were not considered because understorey vegetation was fully developed during the period of measurements.
4. RESULTS
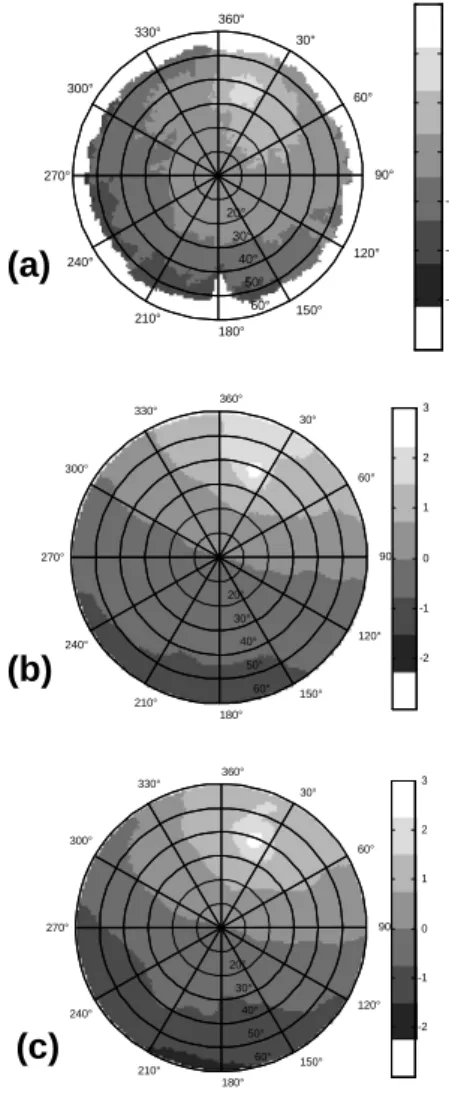
The simulation test is performed on the September
4th airborne data set acquired in the beginning of
afternoon between 12:55 and 13:37 UT. This date has been chosen because of the good quality of data and because it displays important contrasts in anisotropy. Experimental polar plot of anisotropy is displayed in Fig. 5a.
In a first step, directional anisotropy has been simulated using elementary temperatures measured from the tower in 1998 August. The dates for airborne and ground measured data were differing; this inconsistency between dates would obviously be criticisable for practical applications; nevertheless, as they were displaying similar meteorological conditions and water status of trees, we considered they could reasonably be used for a preliminary simulation exercise.
The analysis of several images of different pine shoots, different trunks and different ground samples
(acquired at Le Bray site on August 5 and 6th 1998)
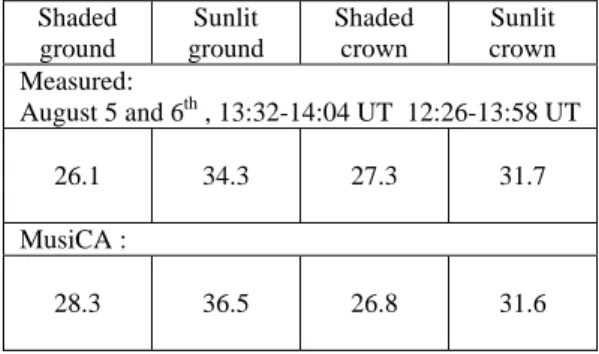
allowed estimating the mean temperature and standard deviation of each component (Fig.4). The temperature of trunks appeared to be very close to that of ground. These two elements were therefore mixed in the simulations (table II). The resulting polar plot of anisotropy is given in Fig. 5 b.
Figure 4. Example of normalized histograms of the
temperatures of sunlit and shadowed crowns and ground between 12:26 and 13:58 UT (August 6, 1998, Le Bray INRA site).
In a second step, the anisotropy has been simulated using elementary surface temperatures provided by MuSICA (Table II). The temperature we considered for the crowns was and averaged value computed for needles mixing the temperatures at the different layers (13.05m, 14.55m, 16.05m and 17.55m) and the 3 ages (1 to 3 years). In this case we considered the MuSICA simulated data at the time of the airborne acquisition. Fig. 5c displays the resulting modelled anisotropy.
20° 30° 40° 50° 60° 30° 60° 90° 120° 150° 180° 210° 240° 270° 300° 330° 360° -3 -2 -1 0 1 2 3
(a)
20° 30° 40° 50° 60° 30° 60° 90° 120° 150° 180° 210° 240° 270° 300° 330° 360° -2 -1 0 1 2 3(b)
20° 30° 40° 50° 60° 30° 60° 90° 120° 150° 180° 210° 240° 270° 300° 330° 360° -2 -1 0 1 2 3 0 0.1 0.2 0.3 0.4 0.5 0.6 0.7 0.8 0.9 1 20 22 24 26 28 30 32 34 36 38 40 Température (°C) N o rm al iz ed f req u e n c y shadowed groud sunlit ground shadowed crown sunlit crown(c)
Figure 5. Polar plots of TIR directional anisotropy
obtained over Le Bray INRA test site by (a) airborne
measurements, September 4th 1995, and simulated
using ground measured (b) and MuSiCA-simulated (c) elementary temperatures. Radial directions correspond to azimuthal viewing directions, concentric circles indicate zenith viewing angles.
Shaded ground Sunlit ground Shaded crown Sunlit crown Measured: August 5 and 6th , 13:32-14:04 UT 12:26-13:58 UT 26.1 34.3 27.3 31.7 MusiCA : 28.3 36.5 26.8 31.6
Table II: Surface temperature (°C) of elements
introduced in the simulations of TIR directional anisotropy.
Figure 5 reveals a satisfactory agreement between airborne measured and simulated TIR directional anisotropy with comparable structure and hot spot visible in all plots. The comparison of the angular variations in the principal plane only (Fig. 6) illustrates the quality of the results. The differences always remain lower than 1°C, and the hot spot is correctly simulated.
Figure 6. Comparison of airborne-measured
directional anisotropy of the surface temperature of a maritime pine stand in the solar principal plane
(September 4th 1995) against simulations performed
using a 3D canopy model combined either with handheld-measured or MuSiCA-simulated elementary temperatures.
5. CONCLUSIONS
This paper demonstrates the interest of simulating TIR directional anisotropy using 3D canopy models of trees and stand. The results appear promising despite the crude 3D model of tree used. In the future more realistic 3D models with a more accurate description of the structure will be introduced for a sake of generality. In particular a model built by Virtual
Plants/AMAP group (CIRAD) will be tested which includes branches up to order 2 (Fig. 7).
Figure. 7. Maritime pine forest 3D model created
by CIRAD Montpellier with AmapSim and PlantGL, rendered with POV-ray (Le Bray site).
The approach will be extensively validated against the whole dataset of TIR airborne measurements in which anisotropy measurements over stands of different ages - and therefore very different structures - are also available (Lagouarde et al., 2000).
The question of the meaning of the elementary temperatures will also require attention. In particular what is a ‘crown surface temperature’? As a matter of fact whatever the direction of observation, the crowns always display a mixture of sunlit needles and shaded ones. In the preliminary tests presented in this paper we introduced the temperature of sunlit needles for the sunlit crowns. Is this always correct? Finally the impact of the assumption of a uniform value of temperature for each class of elements has to be evaluated, and sensitivity tests will be done with an information about the variability of temperatures derived either from MuSICA (needles at different layers, different ages…) or directly from measurements performed with the TIR handheld camera. -3 -2 -1 0 1 2 3 -60 -40 -20 0 20 40 60
zenithal viewing angle
a n is o tr o py ( °C ) airborne measured Tsi MuSiCA Tsi REFERENCES
Caselles, V., Sobrino, J. A., and Coll, C., 1992, A physical model for interpreting the land surface temperature obtained by remote sensors over incomplete canopies. Rem. Sens. Environ., 39, 203-211.
Champion, I., Porte, A., Bert, D., Loustau, D., Guedon, M., Jean-Courdier, F., Lagane, F., Lambrot, C., Lardit, A., Sartore, M., 2001, Tree architecture in remote sensing analytical models: The Bray experiment. Int. Journal of Rem. Sens., 22 (9), 1827-1843.
Gastellu-Etchegorry, J. P., Demarez, V., Pinel, V. and Zagolski, F., 1996, Modeling radiative transfer in heterogeneous 3-D vegetation canopies. Rem.
Sens. Eviron., 59, 461-471.
Guillevic, P., Gastellu-Etchegorry, J. P., Demarty, J., and Prévot, L., 2003, Thermal infrared radiative transfer within three-dimensional vegetation covers. Journal of Geophysical Research, 108(D8), 4248.
Kimes, D. S., 1980, Effects of vegetation canopy structure on remotely sensed canopy temperatures. Rem. Sens. Environ., 10, 165-174. Kimes, D. S., 1983, Remote sensing of row crop
structure and component temperatures using directional radiometric temperatures and inversion techniques. Rem. Sens. Environ., 13, 33-55.
Lagouarde, J.-P., Ballans, H., Moreau, P., Guyon, D., and Coraboeuf, D., 2000, Experimental study of brightness surface temperature angular variations of Maritime Pine (Pinus Pinaster) stands. Rem.
Sens. Environ., 72, 17-34.
Lagouarde, J.-P., Moreau, P., Irvine, M.,. Bonnefond, J.-M.,. Voogt, J. A., and Solliec, F., 2004, Airborne experimental measurements of the angular variations in surface temperature over urban areas: case study of Marseille (France).
Rem. Sens. Environ., 93, 443-462.
Luquet, D., Dauzat, J., Vidal, A., Bégué, A., and Clouvel, P., 2003, 3D simulation of directional temperature variability within a row-cotton crop: toward an improvement of crop water status monitoring using thermal infrared. Precision
Agriculture (Special issue).4, 297-309.
Ogée, J., Brunet, Y., Loustau, D., Bergbier, P., and Delzon, S., 2003, MuSICA, a CO2, water and energy multilayer, multileaf pine forest model: evaluation from hourly to yearly time scales and sensitivity analysis. Global Change Biology, 9, 697 – 717.
Paw U, K. T., 1992, Development of models for thermal infrared radiation above and within plant canopies. ISPRS J. Photogramm. Rem. Sens., 47, 189-203.
Prévot, L., Brunet, Y., Paw U, K. T., and Seguin, B., 1994, Canopy modelling for estimating sensible heat flux from thermal infrared measurements. In
Proc. Thermal Rem. Sens. of the Energy and Water Balance over Vegetation Workshop, La
Londe-les-Maures, Sept. 1993, CEMA-GREF Ed., Montpellier, pp. 17-22.