HAL Id: hal-02315867
https://hal.archives-ouvertes.fr/hal-02315867
Submitted on 14 Oct 2019
HAL is a multi-disciplinary open access
archive for the deposit and dissemination of
sci-entific research documents, whether they are
pub-lished or not. The documents may come from
teaching and research institutions in France or
abroad, or from public or private research centers.
L’archive ouverte pluridisciplinaire HAL, est
destinée au dépôt et à la diffusion de documents
scientifiques de niveau recherche, publiés ou non,
émanant des établissements d’enseignement et de
recherche français ou étrangers, des laboratoires
publics ou privés.
Demonstration of facilitation between microalgae to face
environmental stress
Emna Krichen, Alain Rapaport, Emilie Le Floc'h, Eric Fouilland
To cite this version:
Emna Krichen, Alain Rapaport, Emilie Le Floc'h, Eric Fouilland. Demonstration of facilitation
between microalgae to face environmental stress. Scientific Reports, Nature Publishing Group, 2019,
9 (16076), pp.1-12. �10.1038/s41598-019-52450-9�. �hal-02315867�
Demonstration of facilitation between microalgae to
face environmental stress
Emna Krichen
1,2, Alain Rapaport
2, Emilie Le Floc’h
1, and Eric Fouilland
1,*1UMR MARBEC, Univ. Montpellier, CNRS, IFREMER, IRD, S `ete, France
2UMR MISTEA, Univ. Montpellier, INRA, SupAgro, Montpellier, France
ABSTRACT
Positive interactions such as facilitation play an important role during the biological colonization and species succession in harsh or changing environments. However, the direct evidence of such ecological interaction in microbial communities remains rare. Using common freshwater microalgae isolated from a High Rate Algal Pond HRAP treating wastewaters, we investigated with both experimental and modeling approaches the direct facilitation between two algal strains during the colonization phase. Our results demonstrate that the first colonization by microalgae under a severe chemical condition arose from the rapid growth of pioneer species such as Chlorella sorokiniana, which facilitated the subsequent colonization of low growth specialists such as Scenedesmus pectinatus. The pioneer species rapidly depleted the total available ammonia nitrogen favoring the specialist species initially inhibited by free ammonia toxicity. This latter species ultimately dominated the algal community through competitive exclusion under low nutrient conditions. We show that microbial successions are not only regulated by climatic conditions but also by interactions between species based on the ability to modify their growth conditions. We suggest that facilitation within the aquatic microbial communities is a widespread ecological interaction under a vast range of environmental stress.
Introduction
One of the major challenges in microbial ecology is to understand the dynamics of communities of interacting species. Understanding the biological interactions and the time scales over which they occur is necessary to interpret the results of the directional succession process of communities’ development in the natural environment and artificial ecosystems. In aquatic systems, microalgae are present in natural waters such as oceans, lakes, rivers, and ponds and play a prominent role in the marine and fresh-water ecosystems where they drive major ecosystem processes. Strong similarities exist between marine and
freshwater phytoplankton ecology1when they face similar changes in growth conditions leading to temporal species succession.
Abiotic forcing and biotic interactions can both result in successional trends in phytoplankton. The scientific discussion around the phytoplankton growth periodicity and succession has been dominated by the role of the environmental drivers including
global climatic change (e.g. light, temperature, wind)2–6local hydrological variations7,8biological disturbances such as species
invasion9, and chemical effects such as toxic pollutants, nutrient enrichment, or change in pH (see references6,7,10–12). On the
other hand, the conditions governing phytoplankton growth over the seasonal change in plankton communities have mostly been
discussed in the context of exploitative competition (e.g. Tilman, 1982)13or algae-grazer interactions (e.g. Porter, 1977)14.
The competition for limiting nutrients is an important factor explaining phytoplankton species temporal successions. In marine ecosystems, small-cell diatoms usually grow rapidly in the first stage after a strong nutrient enrichment because of their higher growth rates and are then followed by larger-cell diatoms and dinoflagellates, which are more likely to occur when nutrients are
depleted15,16. Similarly, the seasonal patterns of succession in freshwater ecosystems might be explained by the first occurrence
of invasive small-sized species17, which can be expected to continue to expand until they either run out of nutrient or light
energy or are controlled by zooplankton grazing17,18. These pioneer invasive species can be replaced by other phytoplankton
species more prone to grow under nutrient depletion because of mixotrophy ability or mobility allowing them to exploit patches
of nutrients not available to other microalgae17.
The ability to colonize a specific habitat usually explains the dominance and succession under changes in environmental conditions. For instance, changes in the algal assemblage in natural biofilm communities have been reported in the context of ecological succession that may be related to the population’s tolerance to the physical architecture of the developing mat or the
resource limitations within the mat occurring as the biofilm develops19.
Positive interactions (i. e. facilitation) between organisms can occur when one organism makes the local environment more favorable for another either directly (such as by reducing thermal, water or nutrient stress via shading or through nutritional
biotic mechanism in plant community succession, particularly under harsh environmental conditions including physical or
biotic stresses21and are potentially important in aquatic systems influencing the dynamics of populations and communities19,20.
However, fewer studies have discussed the role of positive interactions in aquatic microbial communities’ organizations. During the biofilm development, it was suggested that early stages of diatoms succession follow the "facilitation" model outlined
by Connell and Slatyer22when the extracellular mucilage production modified the physical biofilm characteristics and then
enhanced the probability of successful immigration of some species more than others23. Similarly, it was suggested that algal
mucilage and stalks within the biofilm facilitate periphyton development by encouraging cell surface adhesion and providing
increased sites for colonization24.
Phytoplankton can substantially change its surrounding conditions of growth by increasing pH due to the uptake of
inorganic carbon during photosynthesis25, decreasing transparency with the increase of biomass concentration26or depleting
key nutrients. Hence, we suggest that this phytoplankton-driven environmental modification can provoke shifts in assemblages of species, thus leading to successions. We suppose that under highly polluted conditions, similar to strongly anthropized ecosystems, an assemblage of typical pioneer species will first develop because of their potential for rapid dispersal and growth. We hypothesize that species showing the fastest growth rates and the strongest stress tolerance to harsh environments will be able to grow under such conditions, making the ecosystem more favorable for species that are more competitive in stable growth conditions through ecological facilitation.
Previous results from a study investigating the biological succession within HRAPs used for wastewater treatment showed the growth of the rapid-growing species Chlorella sp. followed by the slow-growing and grazing-resilient species Scenedesmus
sp.27. Similar successions have been observed in other studies using HRAPs as well28,29. The successional trends of typical
microalgal species growing in HRAPs have generally been interpreted as responses to predation and/or seasonal factors28,30.
Based on the previous observations of dominant species dynamics27, we tested in this study the hypothesis that during the
colonization phase of HRAPs supplemented with wastewaters, Chlorella sp. can modify its habitat and facilitate the growth
conditions for Scenedesmus sp. by reducing the nutrient stress modulated by ammonia toxicity31. We suggest that microbial
successions might not be regulated by climatic conditions only, but also through positive interactions between species facing external chemical stress. We conducted sets of laboratory experiments using the species molecularly identified as C. sorokiniana and S. pectinatus on isolates taken from the HRAP located in northern France during its colonization by Chlorella sp. and
Scenedesmus sp.being both previously identified by microscopy27. The objectives of these experiments were to determine
the inhibiting factor among ammonium ion NH4+, pH and free ammonia NH3and to determine their respective effects on the
growth rates of each species. Then, we used a modeling approach to test the magnitude of facilitation/competition on the two
microalgae and, further, to explain the observed patterns in HRAP continuously supplemented with wastewater27. We also
studied the resilience and succession times, providing informative proxies on the efficiency of the ecological facilitation and the successional trends depending on the initial populations’ densities. Our results supported the theoretical considerations of ecological facilitation between one tolerant and one sensitive organism to a gradient of resource toxicity/bioavailability.
Results and Discussion
Three sets of experiments (denoted SE1, SE2 and SE3) were performed i) to isolate the inhibitory effects of possible external factors such as high nitrogen concentrations or pH and ii) to demonstrate a facilitation interaction between two species. We then show how to exploit the experimental data using a mathematical modeling approach, providing new insights on the facilitation phenomenon.
No direct toxic effect of high NH4+and pH on microalgae growth rates.
Chemical factors such as Total Ammonia Nitrogen TAN and pH can affect the rate and efficiency of photosynthesis of
microalgae32–34. Negative effects of TAN (referring to nitrogen in two distinct forms: NH4+and NH3on algal growth and
physiology might occur and vary significantly within classes of microalgae and within species (see35). The photosynthesis of
different species of marine diatoms was severely inhibited at TAN concentrations in the range of 0.5 to 11 mgN.L−1(see36,37).
At low pH values (< 8), toxicity is likely associated with NH4+, while at alkaline pH values (> 8), cell growth inhibition is
rather due to NH3. During the first set of experiments SE1, the potential toxicity of high NH4+was investigated for the two
isolated algal species (molecularly identified as C. Sorokiniana and S. pectinatus) when pH values were adjusted to 7.5 at 25
◦C. Hence, under such conditions, we ensure that 98% of TAN (ranging from 10 to 110 mgN.L−1) was present as NH+
4 form
(see the relative proportion of NH3and NH4+as a function of pH at 25◦C38). Under this range of concentrations, no significant
difference in the growth rates of S. pectinatus or C. sorokiniana was measured (p > 0.05, ANOVA from ANOCOVA test results
for four observations; see Figure1(a)). Therefore, the NH4+form at such concentrations, typically found in wastewaters, did
not affect the growth rates of both microalgae. Similarly, it was reported that species such as Chlorella are very tolerant to
high TAN concentrations (max. 140 and 250 mgN.L−1stated respectively in Collos and Harrison (2014)35and Tam and Wong
concentrations (> 300 mgN.L−1). Studies performed on S. acuminatus showed that cell growth was inhibited only when
NH4+concentrations were higher than 200 mg.L−1(see reference41). Interestingly, it has been previously reported that algal
photosynthesis of S. obliquus was inhibited at TAN above 28 mgN.L−1if the culture pH exceeded 8.0 (see reference32).
Because pH can vary during algal growth in ecosystems due to the rapid and large CO2consumption of microalgae, this might
directly or indirectly affect algal growth rates. The optimal pH of many freshwater algae is about 8 (see reference42). The
growth of many algal species is inhibited in waters at pH greater than 8 (reduction of productivity of Chaetoceros sp. and
Chlorella sp.by 22 % when pH was raised from 8 to 9), while other species can grow well above pH 8 (e.g. Amphora sp. and
Ankistrodesmus sp.at pH 9 and 10, respectively)43. High pH conditions limit the availability of CO2while HCO−3 dominates,
and then algae cannot efficiently accumulate carbon and require a high supply of carbonates for maintaining photosynthetic
activity42or reducing the affinity to free CO244,45. During the second set of experiments SE2, the direct effect of pH was tested
using pH values ranging from 6 to 9 on algal growth under low initial TAN concentration of about 1 mgN.L−1. As shown in
Figure1(b), the tested pH conditions had no significant effect on the growth rates measured for both species, S. pectinatus and
C. sorokiniana(p > 0.05, ANOVA from ANOCOVA test results for three replicates and three observations). Then, similar to
high values of NH4+, the results did not support the hypothesis of a negative effect of high pH values on the growth rates of
both studied species when cultured in medium containing 1 mgN.L−1) of TAN concentrations. Similarly, Azov and Goldman
(1982)44suggested that pH did not play a role in the magnitude of inhibition but the degree of dissociation of nontoxic NH+
4 to
toxic NH3. In other words, the dissociation of TAN as a function of pH is the main determinant of how much NH3is available
to inhibit photosynthesis. We suggest that NH3concentrations in SE1 and SE2 were likely too low (< 2 mg.L−1) to exhibit
algal growth inhibition. Therefore, the effect of a broader range of NH3concentrations was then tested on both species in the
third set of experiments.
Evidence of species-dependent ammonia effect
NH3is considered the TAN’s most toxic form for aquatic organisms46. The third set of experiments SE3 was then performed
on the same algal isolates (C. Sorokiniana and S. pectinatus) to test their growth under NH3concentrations ranging from 0.56
to 29.42 mgN.L−1. The results for the growth rates of both isolates (represented in Figure1(c)) showed that the growth rates of
C. sorokinianameasured under the different NH3concentrations were similar (p > 0.05, ANOVA from ANOCOVA test results
for three replicates and three observations). However, the growth rates of S. pectinatus were significantly different (p < 0.05,
ANOVAfrom ANOCOVA test results for three replicates and three observations) with an important reduction in growth rates
when NH3exceeded 8.7 mg.L−1. Similarly, early works reported that NH3at concentrations greater than 15 mgN.L−1and
at pH values over 8 inhibited the photosynthesis and growth of S. obliquus31,44. The resistance of C. sorokiniana to very
high NH3concentrations (362 mg.L−1) was previously reported47, suggesting that species can also adapt their metabolism and
becoming more tolerant to high NH3environments over time31,40.
In HRAPs initially supplemented with high TAN concentrations, NH3toxicity is therefore expected to be associated with
elevated pH due to intense photosynthetic activity31and could cause the depletion of microalgae culture or promote replacement
with other tolerant species to face the prevailing stress. This feature should be magnified considerably during the summer as the
conversion between NH4+and NH3is also temperature dependent48.
Evidence of facilitation interaction through a modeling approach
A modeling approach was used to identify the growth characteristics of both studied species to predict their dynamics when
they are growing together. Based on nutrient dynamics monitored in the HRAP27, we assumed that TAN was the sole limiting
substrate driving the algal growth. Moreover, we considered that NH3would have a direct inhibitory effect on cell growth,
whose fraction is given by the following expression:
f(pH, T ) = 1
1 + 10pKa(T )−pH
with pKa(T ) = 0.09018 +T2727.92+273.15 (established within the temperature range of 0◦C− 50◦Cand a pH range of 6.0 to
10.0 (see48).
As a first step, species growth rates were related to external TAN concentrations to calibrate one kinetic model, which could represent satisfactorily most of the data points of the previous test experiments obtained in both SE2 and SE3. The proposed
model was inspired from Aiba-Edward’s model49describing the substrate inhibition at high concentrations and consisting of
a modified version of the Monod equation50, but here it has a slightly different mathematical expression as explained below.
While Monod kinetics assumed that only one nutrient limits the growth of cells, the model we propose here includes that a
expression:
µ (T AN, pH, T ) = ˆµ TAN
k+ TANe
−TAN f(pH,T )
ki (1)
where ˆµ is the maximum growth rate (d−1), k is the affinity to substrate (mg.L−1), kiis the inhibition constant of NH3− N
(mg.L−1) and f (pH, T ) is defined above. This growth function provided a good fit to experimental data describing the growth
kinetics of the two species (see Figure2). The identified kinetic parameters are given in Table1. From the fit of this kinetic
model to data, the species S. pectinatus showed a strong affinity for nitrogen with a greater µˆ
k ratio than that obtained for C.
sorokiniana(see also the comparison of the two species kinetics with a particular focus on low TAN concentrations in Figure
2(b)). In contrast, this latter species has a maximum growth rate (1.10 d−1) much higher than that of S. pectinatus (0.63 d−1).
Consequently, C. sorokiniana would grow well at high TAN concentrations and would also tolerate high NH3concentrations
as reported by its highest inhibition constant (ki= 79.82 mgNH3− N.L−1), while S. pectinatus would grow best at low TAN
concentrations but would show a much faster decline in growth because of its high sensitivity to NH3toxicity represented by a
low ki(2.25 mgNH3− N.L−1). Our results are in accordance with older chemostat experiments comparing S. acutus and C.
minutissimaunder P-limited growth51.
The ecological succession of species presenting Monod- and Haldane-52kind growth functions have already been shown
theoretically53but not yet experimentally. The Monod and Haldane kinetics were fitted to our data (results not shown). Their
graphs closely resemble those given by (1), but with a higher least squares criterion J.
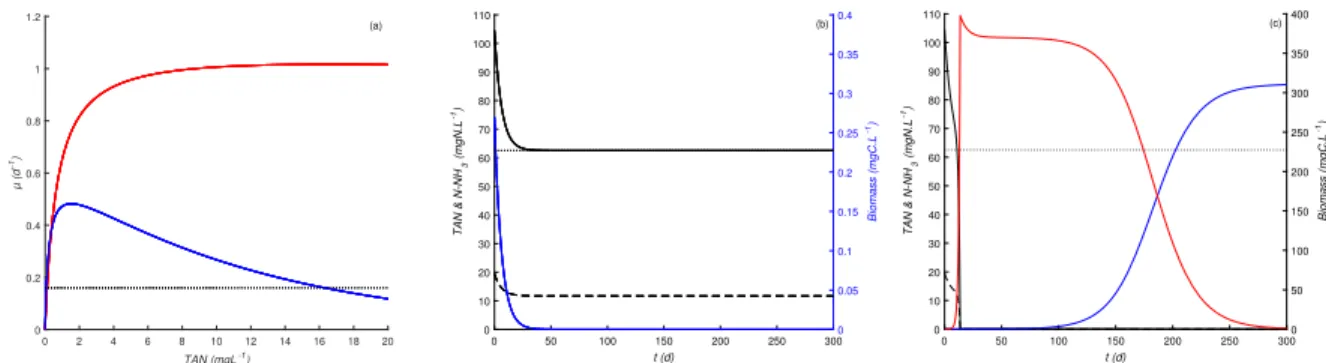
Knowing the growth performances of each species in the laboratory (Figure3(a)), we proposed a predictive model to
explore how the assemblage of the two species might react under a fixed pH (8.6) and temperature (25◦C) in continuous
culture to check if the hypothesis of ecological facilitation is verified. We used the initial conditions of substrate and biomass
and the operational conditions (dilution rate and input substrate concentration) encountered in the previous study on HRAPs27.
The results of our simulations are summarized in Figure3. These simulations revealed that S. pectinatus is unable to grow
and is washed out because of the NH3toxicity when cultivated alone under high TAN and pH conditions (see Figure3(b)).
However, when both microalgae are introduced together under these latter conditions, C. sorokiniana grows rapidly first while
the growth of S. pectinatus is inhibited because of high NH3. The rapid consumption of the nitrogen resource by C. sorkiniana
induces low NH3and less nitrogen availability, favoring the growth of the competitive S. pectinatus but not C. sorokiniana
(see Figure3(c)). Therefore, the ecological facilitation between C. sorokiniana and S. pectinatus would be induced by NH3
toxicity and would explain their succession. These results also support the empirical evidence in plant communities that the balance between facilitation and competition can shift along an environmental gradient, with facilitation being successively
more important in harsh environments20.
Importance of the initial populations densities on the degree of facilitation in simulated HRAP
Using the mathematical approach, we explored the influence of the initial densities of the studied species on some indicators of facilitation degree, which might be useful to further explore the optimization strategies for algal biomass production under high levels of ammonia stress in HRAP. There are different advantages to having a Scenedesmus dominance in an HRAP
supplemented with wastewaters, as this species possesses a high affinity to nitrogen, is strongly resilient to predators54, and its
biomass can be easily harvested55and used for different purposes (e.g. lipid production56). For these reasons, we proposed to
study theoretically some proxies of the facilitation efficiency such as resilience and succession times to provide information on the time required for the development of S. pectinatus in the HRAP under the previously stated operating conditions.
We defined the resilience time as the duration for S. pectinatus to reach its initial biomass value under the presence of the
toxic NH3concentrations. Moreover, because the succession of the two microalgae is required for maintaining S. pectinatus
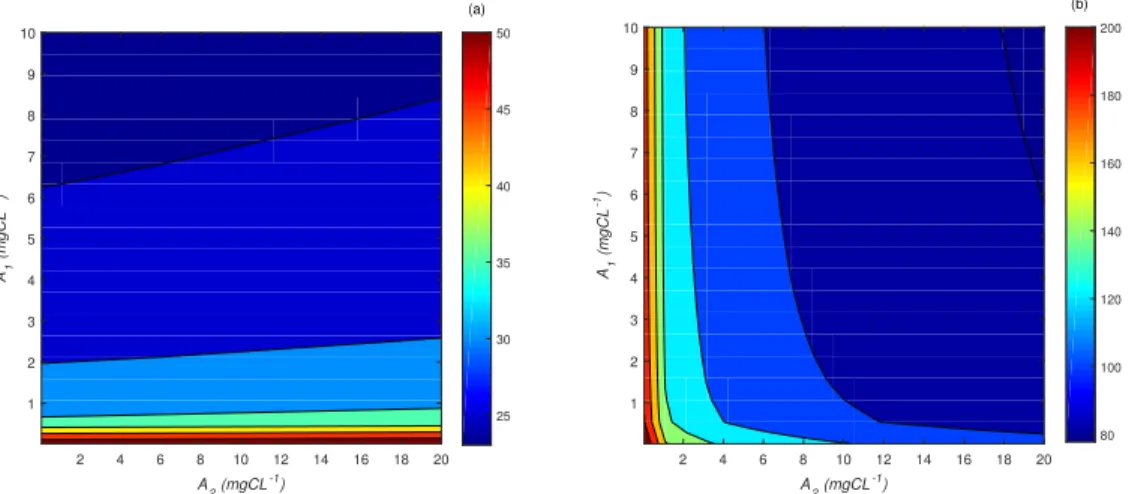
under high nutrient toxic levels, we also defined the succession time as the time for which the two species reach twice the same density level owing to the predominance of S. pectinatus. We plotted the iso-values of the resilience and succession times in
the (A1,A2) plane, where A1, A2are the initial densities of each species (see Figure4). These diagrams allow to see easily for
which pairs of initial densities (A1, A2) one may expect low or high resilience or succession time (the shortest time is in blue,
and the longest one is red). The diagram in Figure4(a) shows that the resilience time is more affected by the initial biomass
concentrations of C. sorokiniana than that of S. pectinatus. This contrasts with the succession time (in Figure4(b)) which is
more sensitive to the initial concentrations of S. pectinatus, especially when C. sorokiniana is initiated at concentrations values
higher than 1 mgC.L−1. Such simulation would be of interest in further control of the diversity within an HRAP supplemented
with wastewaters, especially for managing the periods of dysfunction (e. g. sudden algal crash, variations in wastewaters inflow). For example, it could be suggested to increase the initial concentration of C. sorokiniana (at a concentration higher than 6
mg.L−1) through bioaugmentation to ensure a rapid reduction of NH3toxicity and rapid development of S. pectinatus in a
minimum of 25 days. On the other hand, the time needed for S. pectinatus predominance over C. sorokiniana will depend
the faster the succession would occur (minimum of 80 days). Consequently, our theoretical results depicted with iso-value diagrams showed that the algal resilience and succession times within an intensive algal ecosystem are strongly dependent on the initial populations’ densities that may be used to control algal production processes in HRAPs.
Validation of the ecological facilitation in real HRAP
The dynamics of the biomass of Chlorella sp. and Scenedesmus sp. and the TAN concentrations measured in HRAP operating
from 28 April 2015 to 8 September 2015 in Northern France27were compared to model simulations (see Figure 5) using the
growth functions parameters of C. sorokiniana and S. pectinatus represented in Table1. We made few changes to the initial
model by adding mortality terms and considering different yields parameters values from those determined experimentally (all regarded as unknown constants) thus, still keeping the set of equations as simple as possible. The mortality terms were added to take into account the grazing effect on each algal species in an indirect way given the presence of predators in the HRAP. Changes in yield coefficients was requested knowing that heterotrophic bacteria were also growing in the pond and consuming nitrogen. The estimated parameters of yield and mortality coefficients obtained from the comparison of the model dynamics
with data from HRAP are presented in Table2. Assuming that higher predation pressure corresponds to a higher mortality
coefficient, our results suggest that Chlorella sp. was likely more sensitive to grazing than Scenedesmus sp. known to produce a
grazer-morphological defense according to a previous study54. However, the washout of Chlorella sp. at the system steady-state
is probably not due to high pressure by a high mortality coefficient but rather to competition with Scenedesmus sp. when the
environment becomes depleted of the nitrogen resource, as demonstrated through the previous simulation results in Figure3(c).
We noted that the estimated yields coefficients in laboratory chemostat experiments after three days at steady-state (i. e. 5.9 ± 0.7 gC/gN and 5.0 ± 0.6 gC/gN for C. sorokiniana and S. pectinatus, respectively) were higher than those identified
in the HRAP (see Table2), which may be explained by the presence of denitrifying bacteria producing N2subsequently lost
through degassings27.
In the HRAP, the first bloom of Chlorella sp. happened at high concentrations of NH3and has been replaced later by the
bloom of Scenedesmus sp. (data in Figure5(a)). The distribution of these species was consistent with our experimental and
modeling results on the species C. sorokiniana and S. pectinatus (see Figure3). This validates the importance of facilitation
during the biological colonization of the HRAP under toxic levels of NH3. These results confirmed our initial hypothesis
that the colonization of hypertrophic ecosystems by the stress-tolerant Chlorella sp. is a prerequisite for the development
of the sensitive Scenedesmus sp. to NH3toxicity. Chlorella is usually considered as an invasive phytoplankton or pioneer
species because it maintains fast growth rates and assimilates resources with short generation times, and can dominate over
slower-growing species57,58. In contrast, Scenedesmus is considered an affinity specialist51, and it can dominate in HRAPs
over Chlorella and colonize the HRAP27at low and nontoxic nutrient levels. Therefore, based on the model confrontation to
real data in HRAP, pioneer organisms (here Chlorella) can modify their chemical environment by reducing ammonia toxicity, which can increase the fitness of the growth of sensitive and specialist organisms (here Scenedesmus).
Our study sheds a light on an ecological interaction within aquatic microbial communities that is rarely discussed in the literature, although it may explain ecological successions that occur without any visible external variations of growth conditions
or mortality. Similarly to various types for macro-organisms21, the ability of aquatic microorganisms to drastically modify their
immediate environment would impact the growth of neighbors. Because microalgae can change their light environment when growing (i. e. light attenuation by algal biomass), the growth of photoinhibited algal species can be facilitated by the biomass of
other algal species less sensitive to photoinhibition26. In a similar way, under toxic metal stress, it has been suggested that the
growth of Cd-sensitive microalgal species may be promoted by Cd-tolerant microalgal species reducing Cd in the media to low
levels59. Therefore facilitation within the aquatic microbial communities through the reduction of inhibiting factors is likely to
be a widespread interaction applied for a large range of environmental stress.
Methods
HRAPexperiment
The pre-existing data used in this study were obtained in HRAP of 1.9 m3working volume, continuously fed by pre-treated
wastewaters (after screening and removing grit, sand, and grease) with a constant retention time of 6 days (see27). Algal blooms
occurred naturally in the open pond without any algal inoculation. The period covered by this study was from 28 April 2015 to 8 September 2015. For the present study, we used the data obtained through analytical monitoring that was performed on the influent wastewater and on samples taken from the HRAP. They included water temperature, chemical analyses (TAN and pH), and the algal biomass of the two dominant algal species (Chlorella sp. and Scenedesmus sp., which were identified by microscopy) estimated using cell count from flow cytometry and converted into carbon units.
Microalgae strains, cultivation conditions, and laboratory experiments
One Strain of freshwater microalgae Chlorella sp. and Scenedesmus sp. was isolated from the HRAP samples taken in October
2015. Individual strains were isolated in Z8 media60. The Z8 media was modified to Z8NH
4by replacing all nitrogen forms
with ammonium salt (NH4Cl) as the sole source of nitrogen in the growth medium and by adding the HEPES buffer at 20
mM. The two species were maintained and cultivated under continuous light (100 µEm−2s−1) and temperature (25◦C). We
performed three sets of experiments (SE1, SE2, and SE3) in batch reactors with a working volume of 40 mL. Each set was preceded by a pre-incubation phase in which the two species are preadapted to the fixed cultivation conditions in each set of experiments and providing sufficient fresh volumes for inoculations. The pre-incubations were performed either in continuous
mode (in 2 L photobioreactors stirred at 300 r pm, one-sided illumined at 130 µEm−2s−1, before SE1) or in batch mode (in a
shaken flask at 150 r pm of 200 mL, before SE2 and SE3). All batch experiments (in pre-incubation or in the three-test sets)
were performed in laboratory incubators under a temperature set at 25◦C± 2◦C, an orbital agitation at 150 r pm speed and an
incident light intensity set at 50 µEm−2s−1in SE2 and SE3.
The first pre-incubation in continuous photobioreactors were performed to determine the yield constants and provide sufficient fresh volumes for later inoculation in batch culture. Thus, each strain was growing for about 15 days until the biomass
stabilization, under a constant temperature of 25◦Cand a continuous supply of sterilized medium (C : N : P ratio at about
1 : 34 : 1) at a fixed pH value of 7.5 and a fixed dilution rate (0.25 d−1). After that, the growth of the two species was assessed
in batch cultures (as described above) under different initial TAN concentrations ranging from 10 to 110 mg.L−1 keeping
constant the concentrations of all other medium components. The pH value was maintained at 7.5 in all batch reactors of SE1. In the second set of experiments SE2, prior to the experiment, the two species were pre-incubated in batch cultures for
about 6 days in a sterilized medium of modified Z8NH4with a C : N : P ratio at about 88 : 2 : 1 and a pH set at 7.5. Then, SE2
experiments were performed (as described above) under different pH conditions initially adjusted to 6.0, 6.5, 7.0, 7.5, 8.0,
8.4, 8.7, and 9.0 with NaOH or HCl while using a similar initial concentration of NH4Clof 2 mg.L−1that was supposed to be
nontoxic for both microalgae strains.
Prior SE3, the 6-days pre-incubation of two species was performed in a sterilized medium of modified Z8NH4with a
C: N : P ratio at about 88 : 8 : 1 and a fixed pH value initially set at 8.6 (corresponding to the average value of pH measured in
HRAP). Finally, in SE3, the growth of the two species was assessed in batch cultures under a large range of initial NH4Clfrom
1.2 to 187.7 mg.L−1keeping the pH at 8.6.
DNA isolation, PCR, and sequencing
Genomic DNA was extracted from a 10 mL sample filtered onto a 0.2 µm membrane (PALL Supor 200 PES), using the standard
phenol/chloroform method61. The 18S and ITS rDNA were amplified in PCR reactions using the Pfu polymerase (Promega) with
the primers EAF3 (5’-TCGACAATCTGGTTGATCCTGCCAG-3’) and ITS055R
(5’-CTCCTTGGTCCGTGTTTCAAGACGGG-3’)62. The PCR products were purified using the QIAquick Gel Extraction Kit (Qiagen) and sequenced using two primers
(V4 Forward: 5’-AATTCCAGCTCCAATAGCGTATAT-3’ and ITS Forward: 5’-CCTTTGTACACACCGCCCGTCG-3’) to target specifically the variable V4 region of the 18S rDNA and the ITS region. Sanger sequencing was performed at Eurofins Genomics (GATC services).
Sample analyses
The pH in each culture solution was determined daily (pH meter Symphony SP70P, VWR). For algal biomass estimation, samples were shaken to bring all the cells into suspension and subsamples were daily taken to measure absorbance. In SE1, the growth of algae was measured using optical density OD of the culture with a microplate reader (FLUOSTAR, BMG Labtech) at 650 nm. In SE2 and SE3, cell mass was measured by fluorescence (EX 450 nm, EM 680 nm) and OD at 650 nm, 730 nm, and 680 nm using a microplate reader (CHAMELEON, Hidex). Two different readers have been used due to a technical problem in CHAMELEON after the SE1 period.
In SE2 and SE3, subsamples were collected at the beginning and at the end of each experiment, for nutrient and biomass analysis. Samples were then filtered using i) 0.2 µm Sartorius filters for measuring nutrients in filtrates and ii) pre-combusted AE filters for measuring carbon biomass onto filters. Ammonia nitrogen was measured with a spectrophotometric test kit
(SpectroQuant, Merck Millipore) and orthophosphate phosphorus according to an optimized molybdenum blue method63. After
drying the filters (24 h, 60◦C), the particulate organic carbon representing mainly algal carbon biomass was analysed using an
ANCA mass spectrometer (Europa Scientific).
Data Analysis
We performed the covariance analysis using the "aoctool" function of Matlab to compare significant differences in growth rates µ of algae after 48 h exposure at each tested condition. The technique required the grouped data of logarithm of the biomass ln(x) measured at time t (during the time period 0 to 48 h) for all tested condition. We modelled ln(x) as a linear function of t to determine whether the slope of the line, which represents an estimate of µ, varies among groups. Based on the model fit of
the separate-lines model, the stats output structure from "aoctool" served as input to the multi-compare test "multcompare" function of Matlab, which allows for testing either slopes or intercepts.
Modeling procedures
The first identifications of the growth function parameters for the two species were performed by fitting the proposed kinetic
model (1) to the assessed values of specific growth rate data obtained in SE2 and SE3 for which cultivation conditions are either
identical or different but would not be disruptive of the growth rates except for the initial TAN concentration. The optimal growth parameters were calibrated by the "fmincon" function of Matlab optimization toolbox used in minimizing a mean square
criterion J = ∑ni=1(µiexp− µisim)2, where µiexpand µisimare the normalized experimentally estimated and model generated values
of growth rates at the ithexperimental condition, and n is the total number of estimated growth rates corresponding to the total
number of tested conditions TAN concentrations in SE2 and SE3.
Secondly, we used the identified growth functions on (1) to simulate the following system (2) in order to explore the species
dynamics under a fixed pH (8.6) and temperature (25◦C) in a homogeneous continuous reactor.
˙ A1 = (µ1(N) − D)A1 ˙ A2 = (µ2(N) − D)A2 ˙ N = −1 y1µ1(N)A1− 1 y2µ2(N)A2+ D(Nin− N) (2)
This set of equations gives the variations over the time of both algal biomass of C. sorokiniana and S. pectinatus (in mgC.L−1)
and substrate concentrations (TAN = NH3+ NH4+) (in mgN.L−1), denoted A1(t), A2(t) and N(t), respectively. The growth
functions µ1(N) and µ2(N) depend only on TAN (when T = 25◦Cand pH = 8.6, according to (1) and the parameters presented
in Table 2), as the sole source of nitrogen supplied continuously at the fixed dilution rate D = 0.16 d−1 and the constant
concentration Nin= 62.54 mgN.L−1of wastewater encountered in the studied HRAP. The yield coefficients were taken equal
to y1= 5.93 gC/gN and y2= 4.98 gC/gN for C. sorokiniana and S. pectinatus, respectively. These values were theoretically
calculated from continuous photobioreactors experiments performed at pre-incubation for SE1 and given by yi=
A?i
Nin−Ni?, where
A?and N?are respectively the algal biomass and nitrogen concentrations at steady-state). The system (2) was solved using
"ode23t" differential equation solver using the following initial conditions of substrate and biomass: N0= 104.50 mgN.L−1,
A10= 0.0123 mgC.L−1and A20= 0.2698 mgC.L−1.
Under the same conditions as mentioned above, we theoretically studied the algal resilience and succession times as
proxies of the facilitation efficiency for different initial biomass concentrations (in mgC.L−1) ranging between [0.0123, 10] and
[0.05, 20] for C. sorokiniana and S. pectinatus, respectively. The iso-value diagrams were obtained using the "contourf" plot of Matlab.
Third, we validated the hypothesis of ecological facilitation on real dynamics in HRAP. We used the whole dynamics simulated over the time from the given initial condition until the system was at a quasi steady-stat and we compared data to the
following model equations (3) including terms of mortality m?1and m?2on A1and A2, respectively:
˙ A1 = (µ1(N, pH, T ) − D − m?1)A1 ˙ A2 = (µ2(N, pH, T ) − D − m?2)A2 ˙ N = −1 y?1µ1(N, pH, T )A1− 1 y?2µ2(N, pH, T )A2+ D(Nin− N) (3)
In this new set of equations (3), we considered the variations over the time of Nin, pH, and T implemented into the model
with interpolations performed between the real data points measured over time within the HRAP. We identified the unknown
parameters (m?1, m?2, y?1, and y?2) of the dynamic model using “fmincon” function of Matlab optimization toolbox. The optimal
parameters assuring the best fit to data were constrained to be positive and defined in predefined intervals of boundary values
after 100 consecutive estimations. Mortality constants were estimated within the interval [0, 1] (d−1), while yields coefficients
were supposed to be ranged between i) minimal values theoretically calculated during the period of the dominance of each species in the HRAP (i. e. 1.3 ± 0.1 gC/gN and 0.5 ± 0.2 gC/gN for Chlorella sp. and Scenedesmus sp., respectively) and ii) maximal values identified in our laboratory chemostat experiments after three days at steady-state (i. e. 5.93 ± 0.66 gC/gN and 4.98 ± 0.58 gC/gN for C. sorokiniana and S. pectinatus, respectively). The mean squared error was used as the criterion
function for the model parameters estimation and was calculated as the square root of the variance of the observations (of A1,
References
1. Kilham, P. & Hecky, R. E. Comparative ecology of marine and freshwater phytoplankton 1. Limnol. Oceanogr. 33, 776–795 (1988).
2. Diamant, Q. Hierarchical control of phytoplankton succession by physical factors. Mar. Ecol. Prog. Ser 19, 211–222 (1984).
3. Barbiero, R. P., James, W. F. & Barko, J. W. The effects of disturbance events on phytoplankton community structure in a small temperate reservoir. Freshw. Biol. 42, 503–512 (1999).
4. Grover, J. P. & Chrzanowski, T. H. Seasonal dynamics of phytoplankton in two warm temperate reservoirs: association of taxonomic composition with temperature. J. Plankton Res. 28, 1–17 (2006).
5. Lewandowska, A. & Sommer, U. Climate change and the spring bloom: a mesocosm study on the influence of light and temperature on phytoplankton and mesozooplankton. Mar. Ecol. Prog. Ser. 405, 101–111 (2010).
6. Deng, J. et al. Effects of nutrients, temperature and their interactions on spring phytoplankton community succession in lake taihu, china. PLoS One 9, e113960 (2014).
7. Gaedeke, A. & Sommer, U. The influence of the frequency of periodic disturbances on the maintenance of phytoplankton diversity. Oecologia 71, 25–28 (1986).
8. Nõges, T., Nõges, P. & Laugaste, R. Water level as the mediator between climate change and phytoplankton composition in a large shallow temperate lake. Hydrobiologia 506, 257–263 (2003).
9. Robinson, J. F. & Dickerson, J. E. Does invasion sequence affect community structure? Ecology 68, 587–595 (1987). 10. Havens, K. E. Experimental perturbation of a freshwater plankton community: a test of hypotheses regarding the effects of
stress. Oikos 147–153 (1994).
11. Leibold, M. A. Biodiversity and nutrient enrichment in pond plankton communities. Evol. Ecol. Res. 1, 73–95 (1999). 12. Aneesh, C. N., Haridas, A. & Manilal, V. B. Role of nutrients input pattern on the growth dynamics of common freshwater
microalgal community. Am. J. Plant Sci. 6, 2481 (2015).
13. Tilman, D. Resource competition and community structure (Princeton university press, 1982).
14. Porter, K. G. The plant-animal interface in freshwater ecosystems: microscopic grazers feed differentially on planktonic algae and can influence their community structure and succession in ways that are analogous to the effects of herbivores on terrestrial plant communities. Am. Sci. 65, 159–170 (1977).
15. Margalef, R. Life-forms of phytoplankton as survival alternatives in an unstable environment. Ocean. Acta 1 (1978). 16. Smayda, T. Phytoplankton species succession. The Physiol. Ecol. Phytoplakton.- 493–570 (1980).
17. Anneville, O. et al. Temporal mapping of phytoplankton assemblages in lake geneva: annual and interannual changes in their patterns of succession. Limnol. Oceanogr. 47, 1355–1366 (2002).
18. Reynolds, C. S. Vegetation processes in the pelagic: a model for ecosystem theory, vol. 9 (Ecology Institute Oldendorf, 1997).
19. Johnson, R. E., Tuchman, N. C. & Peterson, C. G. Changes in the vertical microdistribution of diatoms within a developing periphyton mat. J. North Am. Benthol. Soc. 16, 503–519 (1997).
20. Bruno, J. F., Stachowicz, J. J. & Bertness, M. D. Inclusion of facilitation into ecological theory. Trends Ecol. & Evol. 18, 119–125 (2003).
21. Stachowicz, J. J. Mutualism, facilitation, and the structure of ecological communities: positive interactions play a critical, but underappreciated, role in ecological communities by reducing physical or biotic stresses in existing habitats and by creating new habitats on which many species depend. Bioscience 51, 235–246 (2001).
22. Connell, J. H. & Slatyer, R. O. Mechanisms of succession in natural communities and their role in community stability and organization. The Am. Nat. 111, 1119–1144 (1977).
23. Stevenson, R. J. Effects of current and conditions simulating autogenically changing microhabitats on benthic diatom immigration. Ecology 64, 1514–1524 (1983).
24. Roemer, S. C., Hoagland, K. D. & Rosowski, J. R. Development of a freshwater periphyton community as influenced by diatom mucilages. Can. J. Bot. 62, 1799–1813 (1984).
25. Hansen, P. J. Effect of high ph on the growth and survival of marine phytoplankton: implications for species succession.
26. Gerla, D. J., Mooij, W. M. & Huisman, J. Photoinhibition and the assembly of light-limited phytoplankton communities.
Oikos120, 359–368 (2011).
27. Galès, A. et al. Importance of ecological interactions during wastewater treatment using high rate algal ponds under different temperate climates. Algal Res. 40, 101508 (2019).
28. Canovas, S. et al. Seasonal development of phytoplankton and zooplankton in a high-rate algal pond. Water Sci. Technol. 33, 199 (1996).
29. Cho, D.-H. et al. Microalgal diversity fosters stable biomass productivity in open ponds treating wastewater. Sci. Reports 7, 1979 (2017).
30. Schlüter, M., Groeneweg, J. & Soeder, C. J. Impact of rotifer grazing on population dynamics of green microalgae in high-rate ponds. Water Res. 21, 1293–1297 (1987).
31. Abeliovich, A. & Azov, Y. Toxicity of ammonia to algae in sewage oxidation ponds. Appl. Environ. Microbiol. 31, 801–806 (1976).
32. Goldman, J. C., Azov, Y., Riley, C. B. & Dennett, M. R. The effect of ph in intensive microalgal cultures. i. biomass regulation. J. Exp. Mar. Biol. Ecol. 57, 1–13 (1982).
33. Källqvist, T. & Svenson, A. Assessment of ammonia toxicity in tests with the microalga, nephroselmis pyriformis, chlorophyta. Water Res. 37, 477–484 (2003).
34. Wang, J. et al. Ammonium nitrogen tolerant chlorella strain screening and its damaging effects on photosynthesis. Front.
Microbiol.9 (2018).
35. Collos, Y. & Harrison, P. J. Acclimation and toxicity of high ammonium concentrations to unicellular algae. Mar. Pollut.
Bull.80, 8–23 (2014).
36. Natarajan, K. Toxicity of ammonia to marine diatoms. J. (Water Pollut. Control. Fed. R184–R190 (1970).
37. Admiraal, W. Tolerance of estuarine benthic diatoms to high concentrations of ammonia, nitrite ion, nitrate ion and orthophosphate. Mar. Biol. 43, 307–315 (1977).
38. Konig, A., Pearson, H. & Silva, S. A. Ammonia toxicity to algal growth in waste stabilization ponds. Water Sci. Technol. 19, 115–122 (1987).
39. Tam, N. & Wong, Y. Effect of ammonia concentrations on growth of chlorella vulgaris and nitrogen removal from media.
Bioresour. Technol.57, 45–50 (1996).
40. Przytocka-Jusiak, M., Mlynarczyk, A., Kulesza, M. & Mycielski, R. Properties of chlorella vulgaris strain adapted to high concentration of ammonium nitrogen. Acta Microbiol. Polonica 26, 185–197 (1977).
41. Park, J., Jin, H.-F., Lim, B.-R., Park, K.-Y. & Lee, K. Ammonia removal from anaerobic digestion effluent of livestock waste using green alga scenedesmus sp. Bioresour. Technol. 101, 8649–8657 (2010).
42. Kong, Q.-x., Li, L., Martinez, B., Chen, P. & Ruan, R. Culture of microalgae chlamydomonas reinhardtii in wastewater for biomass feedstock production. Appl. Biochem. Biotechnol. 160, 9 (2010).
43. Weissman, J. C., Goebel, R. P. & Benemann, J. R. Photobioreactor design: mixing, carbon utilization, and oxygen accumulation. Biotechnol. Bioeng. 31, 336–344 (1988).
44. Azov, Y. & Goldman, J. C. Free ammonia inhibition of algal photosynthesis in intensive cultures. Appl. Environ. Microbiol. 43, 735–739 (1982).
45. Rotatore, C. & Colman, B. The active uptake of carbon dioxide by the unicellular green algae chlorella saccharophila and c. ellipsoidea. Plant, Cell & Environ. 14, 371–375 (1991).
46. Haywood, G. P. Ammonia toxicity in teleost fishes: a review. Can. Tech. Rep. Fish. Aquat. Sci. 1177, 1–35 (1983). 47. Ogbonna, J. C., Yoshizawa, H. & Tanaka, H. Treatment of high strength organic wastewater by a mixed culture of
photosynthetic microorganisms. J. Appl. Phycol. 12, 277–284 (2000).
48. Emerson, K., Russo, R. C., Lund, R. E. & Thurston, R. V. Aqueous ammonia equilibrium calculations: effect of ph and temperature. J. Fish. Board Can. 32, 2379–2383 (1975).
49. Edwards, V. H. The influence of high substrate concentrations on microbial kinetics. Biotechnol. Bioeng. 12, 679–712 (1970).
51. Sommer, U. Comparison between steady state and non-steady state competition: experiments with natural phytoplankton.
Limnol. Oceanogr.30, 335–346 (1985).
52. Andrews, J. F. A mathematical model for the continuous culture of microorganisms utilizing inhibitory substrates.
Biotechnol. Bioeng.10, 707–723 (1968).
53. Rapaport, A. & Harmand, J. Biological control of the chemostat with nonmonotonic response and different removal rates.
Math. Biosci. Eng.5, 539–547 (2008).
54. Mayeli, S., Nandini, S. & Sarma, S. The efficacy of scenedesmus morphology as a defense mechanism against grazing by selected species of rotifers and cladocerans. Aquatic Ecol. 38, 515–524 (2005).
55. Grima, E. M., Belarbi, E.-H., Fernández, F. A., Medina, A. R. & Chisti, Y. Recovery of microalgal biomass and metabolites: process options and economics. Biotechnol. Adv. 20, 491–515 (2003).
56. Ahmed, A., Jyothi, N. & Ramesh, A. Improved ammonium removal from industrial wastewater through systematic adaptation of wild type chlorella pyrenoidosa. Water Sci. Technol. 75, 182–188 (2016).
57. Elliott, J., Reynolds, C. & Irish, A. An investigation of dominance in phytoplankton using the protech model. Freshw. Biol. 46, 99–108 (2001).
58. Reynolds, C. S. Environmental requirements and habitat preferences of phytoplankton: chance and certainty in species selection. Bot. Mar. 55, 1–17 (2012).
59. Li, S.-P. et al. Effects of species richness on cadmium removal efficiencies of algal microcosms. J. Appl. Ecol. 49, 261–267 (2012).
60. Kotai, J. Instructions for preparation of modified nutrient solution z8 for algae. Nor. Inst. for Water Res. Oslo 11, 5 (1972). 61. Sambrook, J., Fritsch, E. F., Maniatis, T. et al. Molecular cloning: a laboratory manual. Ed. 2 (Cold spring harbor
laboratory press, 1989).
62. Pröschold, T., Marin, B., Schlösser, U. G. & Melkonian, M. Molecular phylogeny and taxonomic revision of chlamy-domonas (chlorophyta). i. emendation of chlamychlamy-domonas ehrenberg and chloromonas gobi, and description of oog-amochlamys gen. nov. and lobochlamys gen. nov. Protist 152, 265–300 (2001).
63. Aminot, A. & Kérouel, R. Hydrologie des écosystèmes marins: paramètres et analyses (Editions Quae, 2004).
Acknowledgements
We thank Elodie Lanouguère for microalgae isolation and cultivation, Ariane Atteia for identifying the microalgal strains, Martine Fortune for ammonia analyses, Patrick Raimbault for carbon content analyses, and Christine Felix for giving helping hand to experiments monitoring. We would also like to thank Bénédicte Fontez for assistance with statistical analyses, and Jérôme Harmand for fruitful comments and discussions during the MODEMIC research school on resource-consumer models (21-25 September 2015).
This work was supported by the ADEME French Agency and the LabEx NUMEV incorporated into the I-Site MUSE funded by the French Research Agency (ANR) that have both funded the PhD grant of the first author. This study was also supported by the PHYCOVER project, which was funded by the French National Agency for Research (ANR-14-CE04-0011).
Author contributions statement
A. R, E. L. F, and E. F participated actively in conceiving the experiments, coordinated the research work, and critically revised the manuscript. E. K designed and conducted laboratory experiments, analyzed data, performed mathematical simulations, and wrote the manuscript.
Additional information
0 20 40 60 80 100 120 TAN (mgNL-1) 0 0.2 0.4 0.6 0.8 1 1.2 µ (d -1) (a) 5 5.5 6 6.5 7 7.5 8 8.5 9 9.5 10 pH 0 0.2 0.4 0.6 0.8 1 1.2 µ (d -1) (b) 0 5 10 15 20 25 30 35 40 NH 3 (mgL -1) -0.4 -0.2 0 0.2 0.4 0.6 0.8 1 1.2 µ (d -1) (c)
Figure 1. Growth rates from multiple comparisons of Matlab tests on growth rate values estimated based on ANOCOVA
analyses for C. sorokiniana (in red) and S. pectinatus (in blue) at different levels of (a) TAN concentrations,
(b) pH conditions, (c) NH3concentrations. 0 20 40 60 80 100 120 140 160 180 200 TAN (mgNL-1) 0 0.5 1 1.5 µ (d -1) 0 1 2 TAN (mgNL-1) 0 0.2 0.4 0.6 0.8 1 µ (d -1) (a) (b)
Figure 2. SE2 and SE3 data sets (full points) compared to the proposed kinetic model for C. sorokiniana (continuous red line)
and S. pectinatus (continuous blue line) in (a), with a focus on low TAN concentrations in (b) (Data points are the mean of 3 duplicate measurements of growth rate).
0 2 4 6 8 10 12 14 16 18 20 TAN (mgL-1) 0 0.2 0.4 0.6 0.8 1 1.2 µ (d -1 ) (a) 0 50 100 150 200 250 300 t (d) 0 10 20 30 40 50 60 70 80 90 100 110 TAN & N-NH 3 (mgN.L -1) 0 0.05 0.1 0.15 0.2 0.25 0.3 0.35 0.4 Biomass (mgC.L -1) (b) 0 50 100 150 200 250 300 t (d) 0 10 20 30 40 50 60 70 80 90 100 110 TAN & N-NH 3 (mgN.L -1) 0 50 100 150 200 250 300 350 400 Biomass (mgC.L -1) (c)
Figure 3. Simulation results obtained under a continuous supply with a high TAN concentration (dotted line in (b) & (c)) at a
fixed dilution rate (dotted line in (a)).
(a) growth functions previously identified for C. Sorokiniana (in solid red line) and S. pectinatus (in solid blue line), (b) dynamics when S. pectinatus is cultivated alone,
(c) dynamics when S. pectinatus and C. Sorokiniana are cultivated together.
In (b) and (c), the biomass variations over time are presented in blue for Scenedesmus sp. and in red for Chlorella sp. while the
2 4 6 8 10 12 14 16 18 20 A 2 (mgCL -1) 1 2 3 4 5 6 7 8 9 10 A1 (mgCL -1) 25 30 35 40 45 50 (a) 2 4 6 8 10 12 14 16 18 20 A 2 (mgCL -1) 1 2 3 4 5 6 7 8 9 10 A1 (mgCL -1) 80 100 120 140 160 180 200 (b)
Figure 4. Isovalue diagrams: resilience time (a) and succession time (b) (in days) depending on the initial biomass densities
of C. sorokiniana (A1) and S. pectinatus (A2) (in mgC.L−1) under a continuous supply of a high nitrogen concentration.
0 50 100 150 t (d) 0 10 20 30 40 50 60 70 80 Biomass (mgC.L -1) (a) 0 50 100 150 t (d) 0 10 20 30 40 50 60 70 80 90 100 110 TAN (mgN.L -1) 0 1 2 3 4 5 6 7 8 9 10 NH 3 -N (mgN.L -1) (b)
Figure 5. HRAP data points compared to the model prediction (in continuous lines) under a continuous supply of wastewater
containing fluctuating concentrations of TAN (dotted black line).
(a) biomass variations over time of Chlorella sp. (in red) & Scenedesmus sp. (in blue),
(b) substrate variations over time of TAN (in black) & NH3(in magenta).
Parameter C. sorokiniana S. pectinatus
ˆ µ (d−1) 1.10 0.63 k(mgN.L−1) 0.68 0.22 ki(mgNH3-N.L−1) 79.82 2.25 ˆ µ k 1.62 2.85
J(least squares criterion) 0.08 0.04
Table 1. Calibration results on SE2 and SE3 growth data obtained in batch cultures.
Parameter C. sorokiniana S. pectinatus
Y?(gC/gN) 2.81 0.30
m?(d−1) 0.58 0.02
J(least squares criterion) 96.72