HAL Id: hal-01483152
https://hal.archives-ouvertes.fr/hal-01483152
Submitted on 19 May 2020
HAL is a multi-disciplinary open access
archive for the deposit and dissemination of
sci-entific research documents, whether they are
pub-lished or not. The documents may come from
teaching and research institutions in France or
abroad, or from public or private research centers.
L’archive ouverte pluridisciplinaire HAL, est
destinée au dépôt et à la diffusion de documents
scientifiques de niveau recherche, publiés ou non,
émanant des établissements d’enseignement et de
recherche français ou étrangers, des laboratoires
publics ou privés.
the European abalone
Bruno Dubief, Flavia L. D. Nunes, Olivier Basuyaux, Christine Paillard
To cite this version:
Bruno Dubief, Flavia L. D. Nunes, Olivier Basuyaux, Christine Paillard. Immune priming and portal
of entry effectors improve response to vibrio infection in a resistant population of the European
abalone. Fish and Shellfish Immunology, Elsevier, 2017, 60, pp.255-264. �10.1016/j.fsi.2016.11.017�.
�hal-01483152�
Please note that this is an author-produced PDF of an article accepted for publication following peer review. The definitive publisher-authenticated version is available on the publisher Web site.
January 2017, Volume 60, Pages 255-264
http://dx.doi.org/10.1016/j.fsi.2016.11.017 http://archimer.ifremer.fr/doc/00357/46800/
Achimer
http://archimer.ifremer.fr
Immune priming and portal of entry effectors improve
response to vibrio infection in a resistant population of the
European abalone
Dubief Bruno 1, *, Nunes Flavia 1, 2, Basuyaux Olivier 3, Paillard Christine 1
1 Laboratoire des Sciences de l'Environment Marin (LEMAR), UMR6539, CNRS/UBO/IRD/Ifremer, Institut Universitaire Européen de la Mer, University of Brest (UBO), Université Européenne de Bretagne (UEB), Place Nicolas Copernic, 29280, Plouzané, France
2 Ifremer Centre de Bretagne, DYNECO, Laboratoire d’Ecologie Benthique Côtière (LEBCO), 29280, Plouzané, France
3 Synergie Mer et Littoral, Centre Expérimental ZAC de Blainville, 50560, Blainville-sur-mer, France * Corresponding author : Bruno Dubief, email address : bruno.dubief@univ-brest.fr
Abstract :
Since 1997, populations of the European abalone Haliotis tuberculata suffer mass mortalities attributed to the bacterium Vibrio harveyi. These mortalities occur at the spawning season, when the abalone immune system is depressed, and when temperatures exceed 17 °C, leading to favorable conditions for V. harveyi proliferation. In order to identify mechanisms of disease resistance, experimental successive infections were carried out on two geographically distinct populations: one that has suffered recurrent mortalities (Saint-Malo) and one that has not been impacted by the disease (Molène). Furthermore, abalone surviving these two successive bacterial challenges and uninfected abalone were used for several post-infection analyses. The Saint-Malo population was found to be resistant to V. harveyi infection, with a survival rate of 95% compared to 51% for Molène. While in vitro quantification of phagocytosis by flow cytometry showed strong inhibition following the first infection, no inhibition of phagocytosis was observed following the second infection for Saint-Malo, suggesting an immune priming effect. Moreover, assays of phagocytosis of GFP-labelled V. harveyi performed two months post-infection show an inhibition of phagocytosis by extracellular products of V. harveyi for uninfected abalone, while no effect was observed for previously infected abalone from Saint-Malo, suggesting that the effects of immune priming may last upwards of two months. Detection of V. harveyi by qPCR showed that a significantly greater number of abalone from the susceptible population were positive for V. harveyi in the gills, indicating that portal of entry effectors may play a role in resistance to the disease. Collectively, these results suggest a potential synergistic effect of gills and haemolymph in the resistance of H. tuberculata against V. harveyi with an important involvement of the gills, the portal of entry of the bacteria.
Please note that this is an author-produced PDF of an article accepted for publication following peer review. The definitive publisher-authenticated version is available on the publisher Web site.
Highlights
► Susceptibility to vibriosis differs between abalone from two distinct populations. ► Immune priming is observed in abalone following a first exposure to V. harveyi. ► The detection of V. harveyi is lower in the gills of resistant abalone. ► The growth rate of V. harveyi was lower in the serum of resistant abalone. ► Both portal of entry and haemolymph effectors may play a role in resistance.
Keywords : Immunity, Haemocyte, Abalone, Disease, Extracellular products, Immune priming, Vibrio
M
A
NUS
C
R
IP
T
A
C
C
E
P
TE
D
30 Key words: 31Immunity; haemocyte; abalone; disease; extracellular products; immune priming; Vibrio harveyi; flow
32
cytometry; resistance; phagocytosis; bacterial growth; qPCR; gill
33
34
1. Introduction
35
In the natural environment, the interaction between pathogens and their hosts has important
36
evolutionary repercussions, influencing genetic diversity of both hosts and pathogens [1,2]. According to the
37
Red Queen hypothesis, each partner of this couple is in constant antagonist coevolution where pathogens
38
evolve new arms to colonize the host, who in turn develop new features to counteract them. In a stable
39
environment, this arms-race can lead to a balance that prevents one taking advantage over the other.
40
However, global change has the potential to disturb this power relationship. Rapid environmental change can
41
favor pathogens that have shorter generation times than hosts, and thus may adapt to new conditions more
42
quickly whereas the hosts are weakened by them. Among new stressors, global warming is an important factor
43
implicated in the emergence of disease [3,4], with adverse consequences for biodiversity. Many pathogenic
44
bacteria grow preferentially in warm seawater, which can lead to an increase in the prevalence of disease with
45
increasing temperature [5,6]. Increasing temperatures can also be detrimental to the immune system of
46
invertebrate hosts thereby facilitating infection by a pathogen. For example, temperature increase leads to a
47
reduction in phagocytosis and phenoloxidase in Haliotis diversicolor infected with Vibrio parahaemolyticus [4].
48
Similarly, temperature increase leads to a reduction in phagocytosis and superoxide dismutase activity, while
49
an increase in total haemocyte count is observed in the hard clam Chamelea gallina [7]. Rising global
50
temperatures can therefore affect both pathogen and host, potentially generating more favorable conditions
51
for disease.
52
The onset of massive mortalities of the European abalone Haliotis tububerculata is a compelling
53
example of the de-stabilizing effects of environmental change on host-pathogen interactions. Since 1997,
54
recurrent abalone mortality events of 50 to 90% have been attributed to the bacterium V. harveyi [8]. Field
55
observations and laboratory studies of the disease etiology point to increasing water temperatures as the main
56
cause of the disease. The first known mortalities were reported between Le Trieux and Saint-Malo, where
M
A
NUS
C
R
IP
T
A
C
C
E
P
TE
D
summer temperatures are among the highest in northern Brittany, France [9]. Subsequent disease outbreaks
58
were limited to areas where summer temperatures exceeded 17.5°C [10]. In support of these field
59
observations, experimental infections showed that V. harveyi was only able to cause death by septicemia when
60
water temperatures exceeded 17°C during the spawning period of H. tuberculata [11]. In addition to
61
temperature, gonadal maturation and spawning of H. tuberculata were found to be linked with immune
62
depression characterized by a decrease in phagocytosis and phenoloxydase activity leading to greater
63
susceptibility to the disease [12]. Other external stressors have also been found to lead to immune depression
64
rendering H. tuberculata susceptible to disease [13]. However, while the combined effects of higher
65
temperature and gametogenesis are required to trigger an infection in H. tuberculata, below 18°C, V. harveyi
66
did not cause mortality in mature abalones [11], showing that temperature remains a key factor for the
67
existence of the disease.
68
Given the rapid increase of sea surface temperatures [14] and the threat that it represents regarding
69
the evolution of host-pathogen interactions, understanding whether and how marine organisms can defend
70
themselves is of great concern. In the case of H. tuberculata infected with V. harveyi, the abalone immune
71
system is rapidly affected by the pathogen, as already in the early stages of disease, phagocytosis, the
72
haemocyte density and the production of reactive oxygen species are negatively impacted [15]. Moreover, V.
73
harveyi can inhibit phagocytosis by inactivating p38 MAP kinase [16], avoiding the host immune system. While 74
V. harveyi appears well-equipped to attack its host, less is known about the potential ability of H. tuberculata to 75
defend itself against V. harveyi, and whether resistance to the disease exists. A successive infection experiment
76
conducted on farmed abalone that aimed to select resistant individuals and identify potential effectors of
77
resistance found that survivors over-expressed several genes implicated in metabolic regulation [17]. Because
78
coping with stress such as gametogenesis and bacterial infection has an energetic cost, resistance to disease
79
may therefore, be associated with individual or populational differences in metabolism and/or energy
80
allocation strategies.
81
In the natural environment, recurrent mortality can select for disease resistance. In the black abalone
82
Haliotis cracherodii, resistance against a rickettsial disease was found in the population of San Nicolas Island,
83
which was historically the most impacted by the disease [18]. With respect to H. tuberculata, contrasting
84
mortalities have been observed in natural populations in France, raising the question of whether resistant
M
A
NUS
C
R
IP
T
A
C
C
E
P
TE
D
populations can be found in areas highly impacted by the disease. Identification of a population tolerant or
86
resistant to the disease could allow resistance factors to be identified.
87
An additional feature of the invertebrate immune system that can lead to an improved response
88
against a pathogen is immune priming. Immune priming is an adaptive response of the immune system which
89
provides protection in a similar way to the immune memory of vertebrates, but via different biologic
90
mechanisms [19]. Invertebrate immune priming has been observed to be either a specific recognition of a
91
pathogen that then leads to a faster and more intensive immune response at a second exposure [19] or a
92
sustained non-specific immune response following a first infection [20]. In certain species, the enhanced
93
immunity stimulated by priming can be transmitted to the next generation, providing an important advantage
94
to the host in the context of emergent diseases [21]. Immune priming, if present in H. tuberculata, could be an
95
important defense against V. harveyi.
96
The main objectives of this study were (1) to examine the existence of a population of H. tuberculata
97
resistant to V. harveyi infection; (2) to compare the immune responses of different natural populations during
98
successive exposures to the pathogen, in order to explain differences in tolerance to the disease and (3) to
99
investigate a potential immune priming response of H. tuberculata against V. harveyi.
100
101
2. Methods
102
2.1 Abalone and bacterial strains 103
In order to identify populations with different susceptibilities to the disease, abalones were sampled in
104
an area that has been recurrently impacted by the disease (Saint-Malo) and in a non-impacted area (Molène).
105
Individuals from the two abalone populations were supplied by local commercial fishermen in May 2014:
Saint-106
Malo (weight 84.5 ± 14.3 g; shell length 83.1 ± 7.6 mm) and Molène (weight 82.5 ± 19.1 g; shell length 84.2 ±
107
4.4 mm). Abalones from the two populations were kept separate, but under the same controlled conditions for
108
approximately five months and fed with Palmaria palmata ad libitum. During this period, the two populations
109
received the same circulating water and the temperature was controlled such that the two populations reached
110
maturity at the same time and as close as possible to the first infection (1300 degree-days). Abalones were
111
transferred to infection tanks two weeks before the start of experimentation (September 2014). The
112
temperature was set to 17°C ten days before experimentation and then increased to 18°C four days before the
M
A
NUS
C
R
IP
T
A
C
C
E
P
TE
D
infection, in order to prevent uncontrolled bacterial proliferation prior to the experiment. Dead abalones were
114
counted and removed twice daily.
115
The bacteria used for the challenge is a virulent strain of Vibrio harveyi (ORM4) isolated from diseased
116
abalone in Normandy, France during an episode of massive mortalities in 1999 [8]. Bacteria were grown in
117
Luria-Bertani Agar supplemented with salt (LBS) at a final concentration of 20g.l-1 during 72 hours at 18°C. Prior
118
to use in the experiment, bacteria were washed with filter-sterilized seawater (FSSW) and quantified by optical
119
density measurements at 490 nm. For the post-infection analyses, a modified mother strain of ORM4 was used:
120
a kanamycin resistant strain, tagged with green fluorescent protein (GFP) [22].
121
122
2.2 Bacterial challenge 123
Abalones were challenged by two successive infections by immersion separated by a period of four
124
weeks including three weeks of rest. They were placed in 100 L tanks in a closed system, supplied with
125
seawater maintained at 18°C with a summer photoperiod (16h day/8h night) for a number of 22 abalones per
126
tank. For each of the two populations, two conditions were performed in triplicate: a control condition with no
127
bacterial exposure and another condition exposed to 104 CFU.ml-1 of V. harveyi during 24 h. After the 24 h
128
exposure, water in all the tanks was renewed at 100%, with subsequent water renewals of 50% taking place
129
each day for the remainder of the infection. A second infection was performed with the surviving abalones 28
130
days after the first exposure, following the same protocol. During the infection periods, abalones were not fed,
131
but feeding with P. palmata resumed during the three-week rest period between the two infections. Dead
132
abalones were counted and removed twice daily. The second infection was followed for one week. After this
133
period, all surviving infected abalones and uninfected (control) abalones were kept for an additional two
134
months at 18°C with a summer photoperiod and fed with P. palmata for post-infection analyses.
135
136
2.3 Sampling of abalone hemolymph and tissues 137
In order to compare the immune response of the two populations at different time intervals of the
138
disease and between the first and the second infection, live abalone were sampled at 1, 3 and 5 days after the
139
first infection and at 0 (just before exposure), 1 and 3 days after the second infection. Particular attention was
140
given to not sample moribund abalones. For the second infection, sampling at 1 day was only possible for the
141
Saint-Malo population because mortality in the Molène population was too high, and the number of animals
M
A
NUS
C
R
IP
T
A
C
C
E
P
TE
D
remaining was insufficient for 3 sampling points. For each sampling time point, three abalones were taken from
143
each replicate tank. Approximately 5 mL of hemolymph was collected from each animal with a sterile syringe.
144
300 µl of hemolymph were used immediately for in vitro phagocytosis and total haemocyte count, 500 µl was
145
frozen at -20°C for the detection of V. harveyi by qPCR. All animals were dissected to collect the gills which
146
were frozen in liquid nitrogen immediately.
147
148
2.4 In vitro phagocytosis index, viability and Total Haemocytes Count (THC) 149
Freshly collected hemolymph was used immediately for quantifying phagocytosis, total haemocyte
150
count (THC) and viability by flow cytometry. Three technical replicates were run for each biological replicate.
151
152
2.4.1 Viability index and THC 153
50 µl was diluted in 150 µl of AASH supplemented with 1% of Sybr Green fluorescent dye and 1% of
154
propidium iodide fluorescent dye in a 96-well round-bottom plate. After 20 min incubation at room
155
temperature, the plate was analyzed by flow cytometry. While Sybr Green binds to all nucleic acids present in
156
the sample, and is measured by green fluorescence, propidium iodide can bind only to dead cells that have
157
suffered loss in membrane integrity and is measured by red fluorescence. The THC value was obtained by the
158
number of events showing a green fluorescence divided by the flow rate. The viability index was determined as
159
the percentage of haemocytes which did not show red fluorescence.
160
161
2.4.2 Phagocytosis index using fluorescent beads 162
50 µl of hemolymph was diluted in 100 µl of FSSW and distributed in a 96-well round-bottom plate.
163
Haemocytes were allowed to adhere for 15 min, followed by the addition of 50 µl of 2.00 µm fluorescent beads
164
diluted 1:100 in distilled water (Fluoresbrite YG Microspheres, Polysciences) [12]. After 1 h incubation at 18°C,
165
the supernatant was removed and 50 µl of trypsin (2.5 mg.ml-1) in an anti-aggregating solution (AASH: 1.5%
166
EDTA, 6.25 g L NaCl, in 0.1 M phosphate buffer, pH 7.4) was added to detach the cells from the bottom of the
167
wells. After 10 min of shaking at the maximum speed on a Titramax 100 plate shaker (Heidolph), 150 µl of AASH
168
was added and the plate was analyzed by flow cytometry with the Guava EasyCyte Plus (Merck Millepore).
169
Beads were identified by their green fluorescence and the phagocytosis index was defined as the percentage of
170
haemocytes phagocyting three or more beads.
M
A
NUS
C
R
IP
T
A
C
C
E
P
TE
D
1722.4.3 Detection of V. harveyi in hemolymph and gills by real-time quantitative PCR 173
DNA was extracted from 500 µl total hemolymph, and from 30 mg of gill tissue using the QIAamp DNA
174
mini kit (QIAgen) according to the manufacturer’s protocol. Hemolymph samples were centrifuged at 10 000g
175
for 10 min. Pellets containing bacteria and haemocytes were digested during 2 h with ATL buffer supplemented
176
with 20 µl proteinase K. Frozen gills were ground with a MM400 mixer mill (RETSCH) and kept frozen using
177
liquid nitrogen. After all subsequent steps of the standard protocol, the columns were eluted twice, first with
178
150 µl of DNase free water, then with 50 µl. In order to quantify V. harveyi in hemolymph, a standard curve was
179
obtained with 10-fold serial dilution in FSSW of V. harveyi bacterial culture, ranging from 108 to 0 CFU. In order
180
to obtain a standard curve for gill tissue, bacterial culture was mixed with uninfected gill tissue homogenate in
181
order to extract DNA under the same conditions as infected gill tissue. A 10-fold serial dilution of bacterial
182
culture from 107 to 0 CFU were added to an uninfected abalone gill homogenate of 30 mg.ml-1. Bacteria
183
concentration was estimated using a Malassez counting chamber under light microscopy.
184
The concentration of V. harveyi was quantified by qPCR using the LightCycler 480 Probes Master
185
chemistry on a LightCycler 480 thermocycler (Roche). Amplification of the V. harveyi tox-R gene was done with
186
the following specific primers: ToxR F1 CCA-CTG-CTG-AGA-CAA-AAG-CA and ToxR R1
GTG-ATT-CTG-CAG-GGT-187
TGG-TT. Fluorescent visualization of amplification was done using a tox-R probe dually labeled with the Texas
188
Red 5’ reporter dye and the BHQ-2 downstream 3’ quencher dye: CAG-CCG-TCG-AAC-AAG-CAC-CG [23]. Each
189
PCR reaction was run in triplicate, containing 5 µl of DNA, 600 nM of each primer, 200 nM of probes and 7.5 µl
190
of master mix, for a final volume of 15 µl. Thermal cycling consisted of an initial pre-incubation step at 95°C for
191
10 min, followed by 45 cycles of denaturation at 95°C for 10 s, annealing and extension at 58°C for 1 min and 30
192
s, the fluorescence reading at each cycle at 72°C for 1 second.The thresholds were set using LightCycler 480
193
software V 1.5 (Roche). The primer efficiency was determined by the slope of the standard curves using the
194 equation E = 10(-1/slope). 195 196 2.5 Post-infection analyses 197
Abalones surviving the experimental infections (from the Saint-Malo population) and uninfected
198
(control) abalones (from both Saint-Malo and Molène) were used for several additional analyses. No survivors
199
remained for the Molène population after two successive bacterial challenges. Additional analyses included: (1)
M
A
NUS
C
R
IP
T
A
C
C
E
P
TE
D
3D microscopy of intracellular uptake of V. harveyi by abalone haemocytes, (2) impact of extracellular products
201
of V. harveyi on phagocytosis, and (3) the impact of abalone serum on bacterial growth. To minimize stress
202
each individual was sampled for hemolymph only once.
203
204
2.5.1 3D Microscopy of phagocytosis 205
Because the methods in flow cytometry used here cannot distinguish whether bacteria are adhered to
206
the surface of a haemocyte or are internalized into the haemocyte, intracellular uptake of V. harveyi by abalone
207
haemocytes was confirmed by 3-dimensional fluorescence microscopy for abalone from both Saint-Malo and
208
Molène. Freshly collected hemolymph was diluted ten times in FSSW (100µl) and allowed to adhere for 15 min
209
on a glass slide. The supernatant was removed and replaced by a GFP V. harveyi suspension [22] to obtain a
210
50:1 bacteria to haemocyte ratio. After 1h of incubation at 18°C, the supernatant was removed and glass slides
211
were washed twice with Phosphate Buffered Saline (PBS) pH 7.4 before being fixed for 10 min with 3.7%
212
formalin in PBS. After two washing steps with PBS, glass slides were covered by 100 µl of a dilution of
213
methanolic stock solution of rhodamine-phalloidin R415 (Invitrogen) with PBS for 20 min, in order to label the
214
actin of cytoskeleton, washed again in PBS, and covered with 100 µl of 4 ́, 6-diamidino-2 ́-phenylindole,
215
dihydrochloride (DAPI) at 0.1 µg.ml-1 (Thermo Scientific) for 5 min, to label the nucleus. Finally, the slides were
216
washed with PBS before observation. Slides were observed on an Axio Observer Z1 complemented by the 3D
217
Vivatome module (Carl Zeiss AG). Lasers were used at ʎex 494nm ± 20 for GFP (ʎem 436 ± 40), ʎex 406 nm ±15 for 218
DAPI (ʎem 457 ± 50), and ʎex 575 nm ± 25 for rhodamine-phalloidin (ʎem 628 ± 40). In order to obtain a 3-219
dimensional image, series of 14 optical cross-sections of 0.8µm were collected and compiled. The images were
220
processed with the AxioVision V 4.8 software (Carl Zeiss AG).
221
222
2.5.2 Impact of extracellular products of V. harveyi on phagocytosis of GFP-labelled bacteria 223
Bacterial extracellular products (ECPs) were produced by the cellophane overlay method [24]. Luria
224
Bertani agar plates were covered with sterile cellophane films, and then 2 ml of approximately 109 V. harveyi
225
culture was transferred to the top of the cellophane and incubated at 18°C for 72h. The bacteria and their ECPs
226
were recovered by successive rinsing with 4 ml of FSSW. The ECP/bacteria suspension was centrifuged at 10000
227
g for 30 min, and the supernatant containing ECPs was recovered and filtered at 0.2 µm. ECP concentration
228
was measured by the Bradford method [25], with serum albumin as the standard. Phagocytosis of GFP-labelled
M
A
NUS
C
R
IP
T
A
C
C
E
P
TE
D
V. harveyi was measured in the presence of two concentrations of ECPs: 15 and 30 µg.ml-1, and a positive
230
control of FSSW containing no ECPs (0 µg.ml-1). Flow cytometry was performed on the Guava EasyCyte Plus
231
(Merck Millepore). Phagocytosis values were represented by the mean of green fluorescence following the
232
protocol described in Pichon et al. (2013), using 1 hour incubation.
233
234
2.5.3 Impact of abalone serum on bacteria growth 235
The ability of V. harveyi to grow in the serum of abalone from Molène and from Saint-Malo was tested
236
using two strains: the virulent ORM4 and the non-virulent strain LMG 7890 [16]. For each abalone population, 1
237
ml of hemolymph from 5 individuals was pooled, and then centrifuged at 200 g for 10 min in order to recover
238
only the serum, followed by filter-sterilization at 0.2 µm. Measurements of both ORM4 and LMG 7890 growth
239
were done in 100-well flat-bottom plates with a computer-controlled incubator/reader/shaker, the Bioscreen C
240
MBR. 150 µl of serum and 50 µl of bacteria suspension in LBS (4·104 cells.ml-1) were pipetted into each well. In
241
order to have a stable control against which to compare bacterial growth in the serum of abalone from Molène
242
and Saint-Malo, a positive control of growth was performed for both strains by adding 50 µl of bacteria
243
suspension with 150 µl of LBS. A negative control was performed by adding 50 µl of sterile LBS with 150 µl of
244
serum. Each condition was performed in triplicate. The plate was incubated at 18°C for 42 hours and the
245
absorbance at 492 nm was measured at intervals of 30 min. The bacterial concentration was calculated with
246
the following formula: 6 · 10ଽ
× ܱܦ + 2 · 10଼ [22]. The maximum growth rate for each condition was obtained
247
by calculating the slope of the bacterial exponential growth phase from a plot of the natural logarithm of
248
bacterial abundance versus incubation time.
249
250
2.6 Statistical analysis 251
The survival rate of infected and uninfected abalone from Saint-Malo and Molène was computed with
252
a Kaplan-Meier estimate followed by a log-rank test in the R “survival” package[27]. Phagocytosis and THC data
253
were fitted on a linear mixed effects model with the factor tanks as random effect, followed by a pairwise
254
comparison of the least-squares means between uninfected and infected treatments. The effects of ECP on
255
phagocytosis for each population were estimated by a 2-way nested ANOVA. As the hemolymph of each
256
individual was used to quantify phagocytosis under three concentrations of ECPs (conditions 0, 15 and 30
257
µg.ml-1), individuals were considered as repeated factors. Then pairwise comparisons of the least-squares
M
A
NUS
C
R
IP
T
A
C
C
E
P
TE
D
means between ECP treatments were performed. Finally, a logistic regression model was used to investigate
259
the link between the phagocytosis index and the probability of abalone to be positive for V. harveyi; and to
260
evaluate if there were differences in the probability of being positive for V. harveyi for abalone originating from
261
Saint-Malo or Molène. In all tests, at the significance threshold was set to α = P < 0.05. All statistical analyses
262
were performed using the software R (version 3.2.3)[28].
263
264
3. Results
265
266
3.1 Differential survival of abalone following V. harveyi infection in Saint-Malo and Molène 267
The survival of abalones was measured in order to observe differences in resistance to infection with
268
V. harveyi between the two populations. Indeed, during the first infection, the population of Molène suffered 269
great mortalities whereas the population of Saint-Malo exhibited very little mortality. After the last observed
270
mortality (24 days after the first exposure), the survival rate was 0.512 for Molène and 0.953 for Saint-Malo
271
(Fig. 1). Survival for the Saint-Malo population was not significantly different from the uninfected controls
272
(P=0.765). The log-rank test showed a significant difference in survival between the two infected populations
273
(P<0.001). Survival was quantified only until 7 days after the second exposure, and by this time point no
274
additional mortality was observed.
M
A
NUS
C
R
IP
T
A
C
C
E
P
TE
D
276 2773.2 THC and Viability during the successive infections 278
Total haemocyte count (THC) and haemocyte viability were measured for individuals from Saint-Malo
279
and Molène. Whereas no significant differences in THC were observed in abalones from Saint-Malo across all
280
time points, abalones from Molène exhibited a significant increase in THC after 24h of exposure (Fig. 2). A slight
281
decrease of THC was observed during the second infection for abalones from Saint-Malo but was not significant
282
(P=0.0947). No change was detected in the viability of haemocytes during the successive infections in both
283
populations. The mean of haemocyte viability was 98.44±0.09% across all individuals measured.
284
Fig. 1 : Kaplan-Meier survival rate following the first exposure of the two populations to 104 bacteria/mL during 24 hours at 18°C
M
A
NUS
C
R
IP
T
A
C
C
E
P
TE
D
285 2863.3 Phagocytosis index during the successive infections 287
A significant decrease in the phagocytosis index was observed 1 day after the first exposure to V.
288
harveyi, of 36% for Molène and 40% for Saint-Malo, relative to the uninfected abalone (Fig. 3). By 2 days, the 289
phagocytosis index of infected abalones recovered to the level of the uninfected controls and remained at the
290
level of the controls until 5 days post-infection. Just prior to the second exposure, no significant difference in
291
the phagocytosis index was observed between infected abalone and uninfected controls for the two
292
populations. During the second infection, no reduction in phagocytosis was observed in the infected abalones
293
from Saint-Malo and the level of phagocytosis was not significantly different than that of uninfected controls
294
until the end of the experiment. In contrast, abalone from Molène showed a significant decrease in
295
phagocytosis 5 days after the second exposure. (Fig. 3)
296
Fig. 2: Total haemocytes count (THC) during the two exposures of (A) Saint-Malo and (B) Molène. Red
dots indicate the exposures. ND indicates that no data is available.* indicates values that are significantly different from the control for a pairwise comparison of the least-squares means (p < 0.05).
M
A
NUS
C
R
IP
T
A
C
C
E
P
TE
D
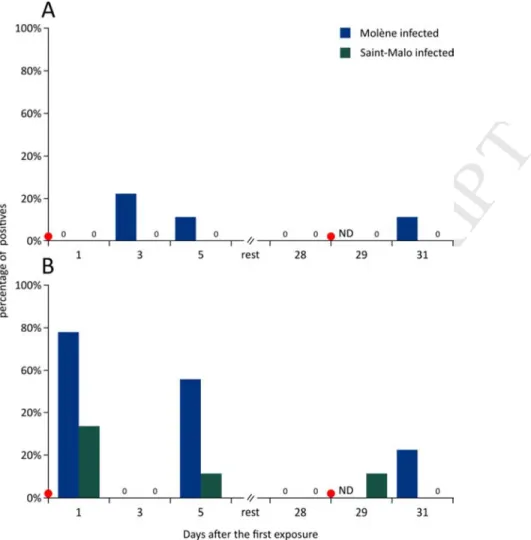
297 2983.4 Detection of V. harveyi in hemolymph and gills by qPCR 299
The sensitivity threshold of qPCR was estimated to be 7.5·102 bacteria/ml of hemolymph and 2.5·102
300
bacteria/30 mg of tissue for gills. V. harveyi was detected in the gills of 20 individuals and in the hemolymph of
301
7 individuals (fig. 4). The concentration of bacteria was in the range of 5.51·102 ±57 bacteria/30 mg of gills and
302
6.4·103 ± 2.02·103 bacteria/ml of hemolymph. One individual showed 1.8·104 bacteria/ml of hemolymph, which
303
explains the high standard deviation for this compartment (the average without this outlier individual was
304
4.52·103 ± 7.23·102 bacteria/ml of hemolymph). As the concentration of V. harveyi was near the detection
305
threshold for most samples from which V. harveyi was detected, the detection results were treated as positive
306
or negative for the presence of the bacterium. A binomial logistic regression was used to treat these results.
307
Fig. 3: Phagocytosis index based on micro-beads engulfment (percentage of haemocytes containing three
or more fluorescent beads relative to total haemocytes) during two successive infections of abalone from (A) Saint-Malo and (B) Molène. Red dots indicate the timing of bacterial exposure. ND indicates that no data is available.* indicates values that are significantly different from the control for a pairwise comparison of the least-squares means (p < 0.05).
M
A
NUS
C
R
IP
T
A
C
C
E
P
TE
D
In the hemolymph, very few individuals were detected as positive for V. harveyi: 4 infected abalones
308
from Molène and only 1 from Saint-Malo across all time points combined. Two uninfected control individuals
309
(one in each population) were also detected as positive. V. harveyi was detected in the gills of a greater number
310
of individuals: 15 positives in Molène and 5 in Saint-Malo with V. harveyi being detected in 1 uninfected control
311
in the Molène population. The time points which exhibited the greatest number of positives were 1 day and 5
312
days after the first exposure. For all time points, the proportion of positive individuals was greater for Molène
313
than for Saint-Malo. A logistic regression was consequently performed only on the infected abalones by taking
314
into account 3 explanatory factors relating to the probability of abalones to be positive for V. harveyi on the
315
gills: the phagocytosis index, the THC and the populations. All three factors significantly influenced the odds of
316
abalone being positive for V. harveyi, with the odds of an abalone being positive for V. harveyi being 12.9 times
317
higher in abalones from Molène.
318
319
320
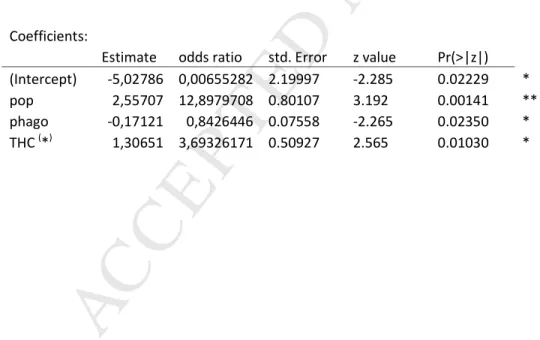
Coefficients:
Estimate odds ratio std. Error z value Pr(>|z|) (Intercept) -5,02786 0,00655282 2.19997 -2.285 0.02229 * pop 2,55707 12,8979708 0.80107 3.192 0.00141 ** phago -0,17121 0,8426446 0.07558 -2.265 0.02350 * THC (*) 1,30651 3,69326171 0.50927 2.565 0.01030 *
Table 1: Logistic regression examining the effect of the population(pop), the phagocytosis index (phago) and the total haemocytes count (THC), on the proportion of abalones positive to V. harveyi on the gills. (*) For THC, the estimate and odds ratio are calculated for an increase of 500 cells/µL.
M
A
NUS
C
R
IP
T
A
C
C
E
P
TE
D
321 322 3.5 Post-infection analyses: 3233.5.1 Fluorescence microscopy of phagocytosis 324
In order to validate that V. harveyi is internalized rather than adhered externally to abalone
325
haemocytes, 3-dimensional fluorescence microscopy was carried out using individuals from Saint-Malo and
326
Molène. Three-dimensional fluorescence microscopy shows that V. harveyi is well phagocyted by the
327
haemocytes of H. tuberculata from the two populations. In Fig 5, the nucleus of the haemocyte is shown in blue
328
and its cytoskeleton, delimiting the plasma membrane of haemocytes, is shown in orange. The green points
329
observed to the left of the nucleus and within the cell membranes correspond to GFP-labelled V. harveyi
330
located inside the cell.The flanking panels (Fig. 5 A, C), showing cross-sections of the haemocyte along the z-
331
Fig. 4: Percentage of positive individuals for V.harveyi (n=9) in (A) haemolymph and (B) gills obtained by
qPCR using specific primers and a TaqMan probe. The number 0 indicates that no individuals were found as positive at a given population and time point. Red dots indicate the timing of bacterial exposure. ND indicates that no data is available.
M
A
NUS
C
R
IP
T
A
C
C
E
P
TE
D
and x-axes, confirm that bacteria are inside haemocyte cells and not merely at the surface. Similar images were
332
obtained using haemocytes from individuals from both Saint-Malo and Molène.
333
334
335
336
3.5.2 Effect of the V. harveyi ECPs on the capacities of abalone to phagocyte this bacteria 337
Haemocytes of abalones from each population were exposed to 0, 15 and 30 µg.ml-1 of ECPs obtained from the
338
ORM4 strain of V. harveyi. Phagocytosis of GFP-labelled V. harveyi under exposure to ECPs was quantified two
339
months after the successive infections experiment (Fig. 6). A nested ANOVA showed no significant differences
340
between the Saint-Malo and Molène populations, but the factor ECPs exhibited a significant p-value < 0.001.
341
Thus, pairwise comparisons of ls-means were performed within each population in order to evaluate their
342
responses to ECPs treatments. A concentration of 30µg.ml-1 ECPs showed a significant negative effect on the
343
phagocytosis index of uninfected individuals, with an inhibition of phagocytosis of 19% for abalone from
344
Molène and 22.8% for Saint-Malo. Abalones from Saint-Malo having survived the successive infections showed
345
no significant difference in phagocytosis when exposed to 0, 15 and 30 µg.ml-1 of ECPs.
346
Fig. 5: 3-dimensional fluorescence microscopy (x60) pictures of a haemocyte (cytoskeleton in orange and nucleus in blue) which has phagocyted GFP-labelled V. harveyi (green). The central picture (B) shows a reconstruction of 14 stacked fluorescence images. The flanking pictures show cross-sections compiled along the (A) z-axis and (C) x-axis.
M
A
NUS
C
R
IP
T
A
C
C
E
P
TE
D
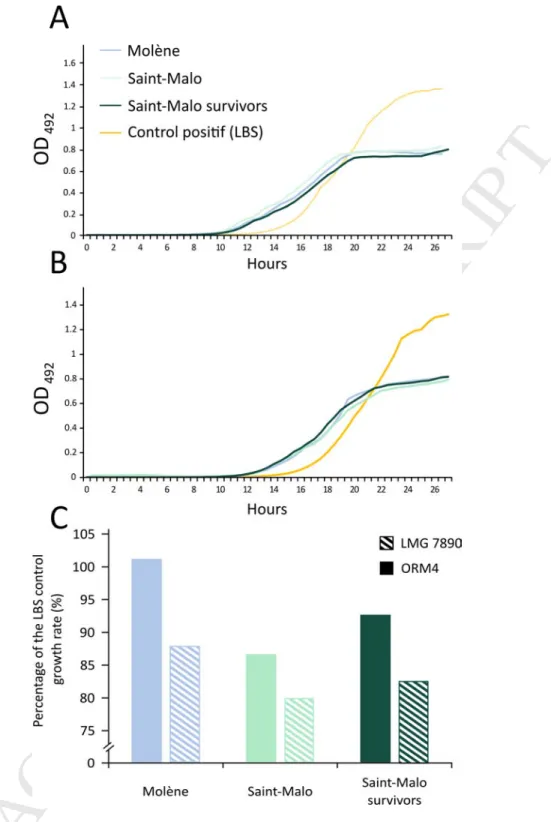
347 3483.5.3 Ability of V. harveyi to grow in acellular fraction of abalones hemolymph 349
The growth of two strains of V. harveyi (LMG7890 and ORM4) in the acellular fraction of the
350
hemolymph from abalone of Saint-Malo and Molène were followed during 42 hours (Fig. 7). In order to have
351
the necessary volume of serum, hemolymph of five individuals was pooled for each population. The two
352
bacterial strains tested began their growth at approximately 2-3 hours earlier than in LBS, the positive control.
353
Growth rate was faster in the pathogenic strain (ORM4) relative to the non-pathogenic (LMG7890). Moreover,
354
the ability of V. harveyi to grow in abalone serum was lower in Saint-Malo (86% of the maximum growth rate
355
observed in LBS for uninfected abalone and 92% for survivors), while the growth rate in the serum of abalone
356
from Molène was nearly the same as in the LBS positive control (101% of the rate observed in LBS).
357
358
Fig. 6: Impact of two concentrations of extracellular products of V. harveyi (15µg/mL and 30
µg/mL) on phagocytosis of GFP-labelled bacteria. Values are the means of green fluorescence emitted by haemocytes. * indicates values that are significantly different from condition without ECPs for a pairwise comparison of the least-squares means (*P < 0.05, **P < 0.01, ***P < 0.001).
M
A
NUS
C
R
IP
T
A
C
C
E
P
TE
D
359 360 4. Discussion 361Fig. 7: Growth curves of the (A) non-virulent strain LMG7890 and (B) the virulent strain ORM4 in
the serum of abalones. The growth of the bacteria in LBS was used as a positive control. (C) Growth rate of the LMH7890 and ORM4 strains in abalone serum are expressed as a percentage of the maximum growth rate in the LBS control.
M
A
NUS
C
R
IP
T
A
C
C
E
P
TE
D
Populations exposed to contrasting environmental conditions and having different disease occurrences
362
can evolve different susceptibilities against a particular pathogen. Based on this hypothesis, two populations of
363
H. tuberculata were chosen to examine how response to infection to V. harveyi could vary in abalone of 364
different origins. In Saint-Malo, where the average sea water temperatures exceed 17°C during the summer
365
spawning period, conditions are favorable for disease development and indeed, this population has been
366
frequently impacted by disease [10]. On the other hand, mortality has never been reported in Molène and the
367
surrounding region, where temperatures of 17°C are rarely observed[9]. Successive infections conducted with
368
abalones from each of these two natural populations showed marked differences in survival. Following 24 days
369
after a first exposure to V. harveyi, a survival rate of 51% was observed for abalone from Molène and 95% for
370
abalone from Saint-Malo (Fig. 1). Interestingly, the survival rate for Saint-Malo was not statistically different
371
from that of uninfected controls. Our experimental infections confirm the hypothesis that abalone from a site
372
that has experienced recurrent mortality (Saint-Malo) shows improved survival following infection with V.
373
harveyi. According to Coustau and Théron (2004), resistance is defined as a relative term which indicates that a 374
group exhibits a significantly better ability to prevent infection by a specific pathogen. Thus, all subsequent
375
analyses were performed to identify mechanisms which could explain the resistance to the disease observed in
376
abalone from Saint-Malo.
377
Differences in survival of H. tuberculata following successive infection with V. harveyi (106 bacteria/mL;
378
19°C) has been previously observed in farmed abalones [17]. Survival rate improved from 36% after a first
379
infection to 56% following a second exposure, revealing different levels of resistance to the disease within the
380
farmed population and a better ability to resist a second infection. While reduced mortality in this experiment
381
may have been due to immune priming, the enhanced resistance observed at the second exposure could also
382
be explained as an elimination of susceptible phenotypes following the first infection. In order to isolate a
383
priming effect, improved response to the disease needs to be observed in conditions where potentially
384
susceptible phenotypes are not eliminated at a first infection. Therefore, in the present experiment, mild
385
infection conditions in term of both temperature (18°C) and bacterial concentration (104 bacteria/mL) were
386
used to avoid mortality after a first exposure to V. harveyi, which was the case for the Saint-Malo population.
387
Despite these infection conditions, survival was low in the susceptible population of Molène. Thus, these
388
infection conditions allowed on one hand, to discriminate the two populations in term of resistance, and on the
M
A
NUS
C
R
IP
T
A
C
C
E
P
TE
D
other hand, to discern which parameters allowed improved resistance to the disease in abalone from
Saint-390
Malo.
391
After the first infection with V. harveyi, individuals from both Saint-Malo and Molène suffered an
392
important drop in phagocytosis (~40% compared to the control) after the first day of exposure, followed by a
393
recovery of this activity by the third day, showing a similar response between the two populations in cellular
394
immunity during the first infection (Fig. 3). The reduction in phagocytosis index could be explained by the
395
saturation of a high proportion of haemocytes following active phagocytosis of V. harveyi in the early stages of
396
exposure, resulting in less efficient bead engulfment by 24 hours post-infection. Alternatively, the observed
397
reduction in phagocytosis could be interpreted as an inhibition of phagocytosis. Previous studies have shown
398
that the ORM4 strain can perturb the MAPK signaling pathway by inhibiting phosphorylation of the p38 MAPK,
399
leading to inhibition of phagocytosis compared to the non-pathogenic strain of V. harveyi (LM7890)[16].
400
Moreover, a significant decrease in phagocytosis index 24 hours after exposure to V. harveyi is linked with a
401
downregulation of clathrin, a protein involved in endocytosis [15]. Therefore, the lower phagocytosis index
402
observed is likely due to an inhibition of phagocytosis induced by the pathogen.
403
Interestingly, no significant decrease in phagocytosis was observed 1 day after the second exposure for
404
abalones from Saint-Malo (Fig. 3A). The response of this population to the second infection can be interpreted
405
as an immune priming effect. The survival rates observed in the control and infected conditions in Saint-Malo
406
were similar, supporting the interpretation that the improved response to an infection can be due to a priming
407
effect rather than an elimination of susceptible phenotypes. For the Molène population, low survival rates
408
following the first infection preclude such interpretation.
409
Immune priming allows invertebrates to show improved survival to a pathogen following a first
410
infection. This mechanism is now known in several insect species [30–32] and the freshwater snail
411
Biomphalaria glabrata [20,33]. In the marine realm, immune priming was first examined in copepods [34]. 412
More recently, examples among a few marine molluscs have also been documented: Chlamys farreri [35],
413
Mytilus galloprovincialis [36] and Crassostrea gigas [37]. In the gastropod Biomphalaria glabrata, a species 414
phylogenetically close to H. tuberculata, a first exposure to the trematode Schistosoma mansoni conferred an
415
immune priming effect which led to complete protection, such that a secondary infection exhibited animals
416
with a parasite prevalence of 0% for primed individuals compared to 100% for unprimed [20]. In the Pacific
417
oyster C. gigas, a more acute and rapid immune response in term of phagocytosis and hematopoiesis was
M
A
NUS
C
R
IP
T
A
C
C
E
P
TE
D
observed after being primed with heat-killed Vibrio splendidus 7 days before the infection [35]. Since
419
phagocytosis is usually the first response of the host against the pathogen, inhibition of this mechanism is a
420
widespread strategy among pathogens to persist inside the host tissues [38]. Early phagocytosis response can
421
then be crucial for the resistance of animals against infection and septicemia. In the case of H. tuberculata, the
422
first exposure can act as an immune treatment that prevents future phagocytosis inhibition in abalone, thereby
423
improving the early response to a subsequent exposure. A priming effect could allow the abalone immune
424
system to be stimulated in the field at the beginning of the mortality season, thus enhancing protection for the
425
rest of the critical period.
426
Because of the importance of the phagocytic response, and its implication in priming effect, this
427
immune mechanism has been further examined. During the experimental infections, host phagocytosis was
428
quantified using fluorescent beads. This commonly used approach [16] shows the activity of haemocytes rather
429
than the actual ability to phagocytose a specific bacterium cell. While actual internalization of V. harveyi cells
430
has previously been shown in primary cultured cells of farmed abalone haemolymph and gills [26], 3D
431
fluorescent microscopy was used to confirm that this was the case in the freshly collected haemolymph from
432
abalone from both Saint-Malo and Molène. Fluorescent microscopy shows that GFP-labelled bacterial cells are
433
clearly observed inside the haemocytes, providing unquestionable evidence of internalization of V. harveyi by
434
the haemocytes of H. tuberculata (Fig. 5) and confirming that subsequent flow cytometry measurements made
435
with GFP-labelled V. harveyi quantifies actual phagocytosis. Phagocytosis of GFP-labelled bacteria performed
436
two months after the infection experiment on uninfected individuals exhibited similar responses between the
437
two populations. Abalones from Saint-Malo and Molène showed the same phagocytosis capacity and the same
438
response to the ECPs. Indeed, the two populations suffer a phagocytosis inhibition of about 20% when exposed
439
to 30 µg.ml-1 of ECPs relative to the to the 0 µg.ml-1 controls (Fig. 6). However, for the abalone from Saint-Malo
440
surviving the successive infections, no statistical difference was observed between phagocytosis index exposed
441
to concentrations of 0 µg, 15 µg.ml-1 and 30 µg.ml-1 of ECPs, suggesting a potential long-term priming effect
442
against the inhibition of phagocytosis induced by ECPs. This result indicates that the protection against
443
phagocytosis inhibition induced by the first exposure has persisted for over two months.
444
Our results are the first to indicate the existence of immune priming in abalones, however, the present
445
study does not differentiate between the two possible types of priming. Immune priming in invertebrates
446
occurs either as a sustained response of immune mechanisms which prevents a subsequent attack, or via a
M
A
NUS
C
R
IP
T
A
C
C
E
P
TE
D
specific response which allows recognition of the pathogen thus inducing a more intensive and rapid immune
448
response [20]. Future work addressing whether sustained response or specificity of response is present in
449
abalone could further our understanding of how immune priming acts in this species. For example, the injection
450
of heat-killed bacteria could address whether immune priming is a specific response in H. tuberculata, as
451
performed with the Pacific oyster [37]. Enhanced phagocytosis was observed only in oysters injected with
heat-452
killed V. splendidus, but not with 4 other species of bacteria, suggesting specific recognition of this pathogen.
453
The injection of heat-killed bacteria would also allow the induction of a more intensive immune effect by
454
delivering higher doses of the pathogen. The infection performed in the present study was weak to avoid
455
mortality, possibly leading to a partial or diminished immune priming response.
456
Sustained immune response is another possible mechanism of immune priming. The pathogenic strain
457
of V. harveyi ORM4 is able to avoid the bactericidal response of abalone through an inhibition of the activity of
458
the p38 MAPK, a MAP kinase which is thought to trigger a number of immune responses such as phagocytosis
459
or the secretion of reactive oxygen species [16]. This kind of virulence has also been shown in other marine
460
models. For example, the secretion of a metalloprotease by Vibrio aestuarianus, a pathogen of the Pacific
461
oyster C. gigas, inhibits, among other immune parameters, phagocytosis [39]. Proteases secreted by the
462
pathogen are a common mechanisms for the inhibition of phagocytosis, but can be counter-acted by protease
463
inhibitors produced by the host [40]. In the disk abalone Haliotis discus discus, three types of clade B serine
464
protease inhibitors are expressed in haemocytes following injection of V. parahaemolyticus or of LPS [41].
465
Sustained synthesis of protease inhibitors by H. tuberculata may therefore be a possible explanation of the
466
long-term protection against phagocytosis inhibition. Future work quantifying protease inhibitors following
467
successive infections with V. harveyi could confirm this hypothesis.
468
Humoral effectors may also contribute to the resistance of the Saint-Malo abalone to V. harveyi
469
infection. Marine invertebrates possess a large set of antimicrobial peptides that can counteract bacterial
470
growth [42]. Hemocyanin can also have strong antimicrobial activity [43], while other factors can limit bacterial
471
growth by sequestering or limiting the availability of nutrients such as iron [44]. In the European abalone, the
472
onset of growth of the two bacterial strains occurred 2-3 hours earlier in the serum of abalone than the LBS
473
control, irrespective of the population, showing potential activators of bacterial growth may be present in the
474
abalone serum. Moreover, bacterial growth rate was greater for the virulent strain of V. harveyi (ORM4)
475
compared to the non-virulent strain LMG 7890 (Fig. 7). However, maximum growth rate of the virulent strain
M
A
NUS
C
R
IP
T
A
C
C
E
P
TE
D
ORM4 was lower in the haemolymph of Saint-Malo compared to Molène, indicating that the serum of abalone
477
from Malo is less favorable for ORM4 growth. Therefore, resistance to V. harveyi in abalone from
Saint-478
Malo may in part be explained by the ability to slow down bacterial growth within the serum. Host fluids can
479
have significant effects in growth and gene expression of bacteria [45,46]. For example, the pedal mucus of the
480
small abalone Haliotis diversicolor has been showed to induce the formation of a biofilm by Vibrio alginolyticus
481
and to enhance the density of bacteria [46]. In the present work, bacterial growth in the serum was measured
482
two months after the successive infections; it is possible that different responses may be observed during
483
infection with V. harveyi.
484
The most striking differences between the resistant and susceptible populations were observed in the
485
detection of V. harveyi in the haemolymph and the gills of abalone. In the haemolymph, V. harveyi was
486
detected in only 5 individuals, all from the Molène population (Fig. 4A). Despite the low survival rate in abalone
487
from Molène, the small number of individuals positive for V. harveyi can be explained by the rapid growth rate
488
of V. harveyi in abalone serum (~10 hours, see Fig 7), rendering the time frame to detect the bacteria in
489
hemolymph (between the beginning of exponential phase and septicemia) very short. It is nevertheless
490
interesting to note that all individuals for which V. harveyi was detected were from Molène, suggesting that V.
491
harveyi is better able to penetrate the haemolymph of abalone from this population. The results of THC 492
support this interpretation. Although no differences in THC were observed between infected abalones and
493
uninfected controls in the Saint-Malo population, abalone from Molène showed a significant increase of the
494
number of circulating haemocytes after 24 hours of exposure to V. harveyi (Fig. 2). This likely denotes an
495
inflammatory response by a recruitment of haemocytes in the hemocoel suggesting greater presence of V.
496
harveyi in this compartment in abalone from Molène. 497
Detection of V. harveyi in the gills was significantly greater in abalone from Molène compared to
Saint-498
Malo (Fig. 4B), and a binomial regression showed that the detection of V. harveyi on the gills was correlated
499
with an increase of THC and a decrease of phagocytosis index (Table. 1). These findings indicate that even if the
500
bacterium is not detected in the haemolymph, its presence in the gills already induces an immune response.
501
The portal of entry of V. harveyi is the gills of abalones [47], where previous work has shown that bacterial
502
density can be 5-fold greater in the gills compared to other tissues 6 hours after exposure. The small number of
503
individuals which were positive for V. harveyi in the gills among abalone from Saint-Malo suggests that an
504
important part of the resistance of this population may depend on the ability to prevent the settlement and
M
A
NUS
C
R
IP
T
A
C
C
E
P
TE
D
penetration of bacteria in the gills. The ability to adhere to the portal of entry of the host can be essential for
506
the virulence of a bacterium. This is the case of Flavobacterium colunmare and Yersinia ruckeri, for which all
507
known virulent strains are able to adhere to the gills of their respective hosts, whereas non-virulent strains
508
cannot [48,49]. Preventing settlement of bacteria on the gills may be an important defense mechanism against
509
disease. Other strategies can also be used to counteract the settlement of bacteria on the gills of marine
510
invertebrates, such as the localized production of lysozyme or antimicrobial peptides. In the penaid shrimp
511
Marsupenaeus japonicas, lysozyme expression and antimicrobial activity are elevated in the gills [50]. 512
Moreover, an antimicrobial peptide expressed only in gills has been discovered in the abalone Haliotis discus
513
[51]. Since the gills may be important in the resistance to V. harveyi infection, future work comparing potential
514
antimicrobial or anti-adherent activity in the gills of abalone from the two populations may help to identify the
515
mechanisms by which abalone from Saint-Malo have enhanced resistance against V. harveyi.
516
Surprisingly, no individuals were positive for V. harveyi in the gills 3 days after the first exposure in
517
both populations. This is possibly due to the fact that bacterial concentrations fluctuate over the course of the
518
experimental infection, as was quantified in similar experiments [22]. Thus, bacterial concentrations at this
519
given time point may have fallen below the detection limit.
520
521
5. Conclusions
522
This study shows the differential resistance between the two populations of H. tuberculata against V.
523
harveyi and the comparisons between these two populations identified a number of resistance effectors. 524
Abalone haemolymph exhibited weak defenses against the bacteria, and are presumably insufficient to contain
525
a septicemia, although phagocytosis and limitation of bacterium growth in the serum are two possible
526
resistance mechanisms. On the other hand, the significant differences observed in detection of V. harveyi in the
527
gills point towards an important implication of the gills in the resistance of the Saint-Malo population. Our
528
results show the first evidence of immune priming in Haliotis tuberculata and the enhanced capacity of
529
phagocytosis at the second infection demonstrate a potential importance of cellular response against V.
530
harveyi. A synergistic interaction among effectors in the gills and haemolymph likely lead to disease resistance. 531
Further work is needed to understand precisely how the population of Saint-Malo resists infection and to find
532
the gills effectors that counteract the settlement of V. harveyi in abalone gills.
533
M
A
NUS
C
R
IP
T
A
C
C
E
P
TE
D
Acknowledgments 535This work was supported by the "Laboratoire d'Excellence" LabexMER (ANR-10-LABX-19) and co-funded by a
536
grant from the French government under the program "Investissements d'Avenir". The authors are grateful to
537
RIERA Fabien; RICHARD Gaelle; HARNEY Ewan; LAISNEY Naïda; PETINAY Stephanie for their help in sampling
538
during the infections experiment, and BIDAULT Adeline her assistance and suggestions for qPCR analyses.
539
Finally, authors are also grateful to all the SMEL team for their help and their warm welcome within their
540 structure. 541 542 References 543
[1] S. Altizer, D. Harvell, E. Friedle, Rapid evolutionary dynamics and disease threats to biodiversity, Trends
544
Ecol. Evol. 18 (2003) 589–596. doi:10.1016/j.tree.2003.08.013.
545
[2] L. Wilfert, F.M. Jiggins, The dynamics of reciprocal selective sweeps of host resistance and a parasite
546
counter-adaptation in drosophila, Biol. Lett. 6 (2010) 666–8. doi:10.1098/rsbl.2010.0329.
547
[3] C.D. Harvell, C. E.Mitchell, R.W. Jessica, A. Sonia, P.D. Andrew, R. S.Ostfeld, et al., Climate warming and
548
disease risks for terrestrial and marine biota, Science (80-. ). 296 (2002) 2158–2162.
549
doi:10.1126/science.1063699.
550
[4] W. Cheng, I.S. Hsiao, C.-H. Hsu, J.C. Chen, Change in water temperature on the immune response of
551
Taiwan abalone Haliotis diversicolor supertexta and its susceptibility to Vibrio parahaemolyticus, Dis.
552
Aquat. Organ. 60 (2004) 157–164. doi:10.1016/j.fsi.2004.03.007.
553
[5] L. Vezzulli, I. Brettar, E. Pezzati, P.C. Reid, R.R. Colwell, M.G. Höfle, et al., Long-term effects of ocean
554
warming on the prokaryotic community: evidence from the vibrios, ISME J. 6 (2012) 21–30.
555
doi:10.1038/ismej.2011.89.
556
[6] K.K. Lee, P.C. Liu, Y.C. Chen, C.Y. Huang, The implication of ambient temperature with the outbreak of
557
vibriosis in cultured small abalone Haliotis diversicolor supertexta Lischke, J. Therm. Biol. 26 (2001)
558
585–587. doi:10.1016/S0306-4565(01)00004-3.
559
[7] M. Monari, V. Matozzo, J. Foschi, O. Cattani, G.P. Serrazanetti, M.G. Marin, Effects of high temperatures
560
on functional responses of haemocytes in the clam Chamelea gallina, Fish Shellfish Immunol. 22 (2007)
561
98–114. doi:10.1016/j.fsi.2006.03.016.
562
[8] J.L. Nicolas, O. Basuyaux, J. Mazurié, A. Thébault, Vibrio carchariae, a pathogen of the abalone Haliotis